Greece Industrial Chain Market (2026-2032) | Strategy, Pricing Analysis, Drivers, Consumer Insights, Competitive, Companies, Strategic Insights, Opportunities, Demand, Industry, Supply, Restraints, Trends, Growth, Competition, Analysis, Investment Trends, Segments, Size, Share, Outlook, Forecast, Segmentation, Challenges, Value, Revenue
Market Forecast By Chain Type (Roller Chains, Leaf Chains, Silent Chains, Engineered Chains), By Material Used (Stainless Steel, Carbon Steel, Alloy Steel, Nickel-Plated Steel), By Application (Conveyor Systems, Power Transmission, Lifting Applications, Mining & Drilling), By End User (Manufacturing, Automotive, Construction, Oil & Gas), By Sales Model (Direct Sales, Distributors, Online Suppliers, Industrial Suppliers) And Competitive Landscape
| Product Code: ETC12478629 | Publication Date: Apr 2025 | Updated Date: Apr 2026 | Product Type: Market Research Report | |
| Publisher: 6Wresearch | No. of Pages: 65 | No. of Figures: 34 | No. of Tables: 19 | |
Greece Industrial Chain Market Size (2020-2030)
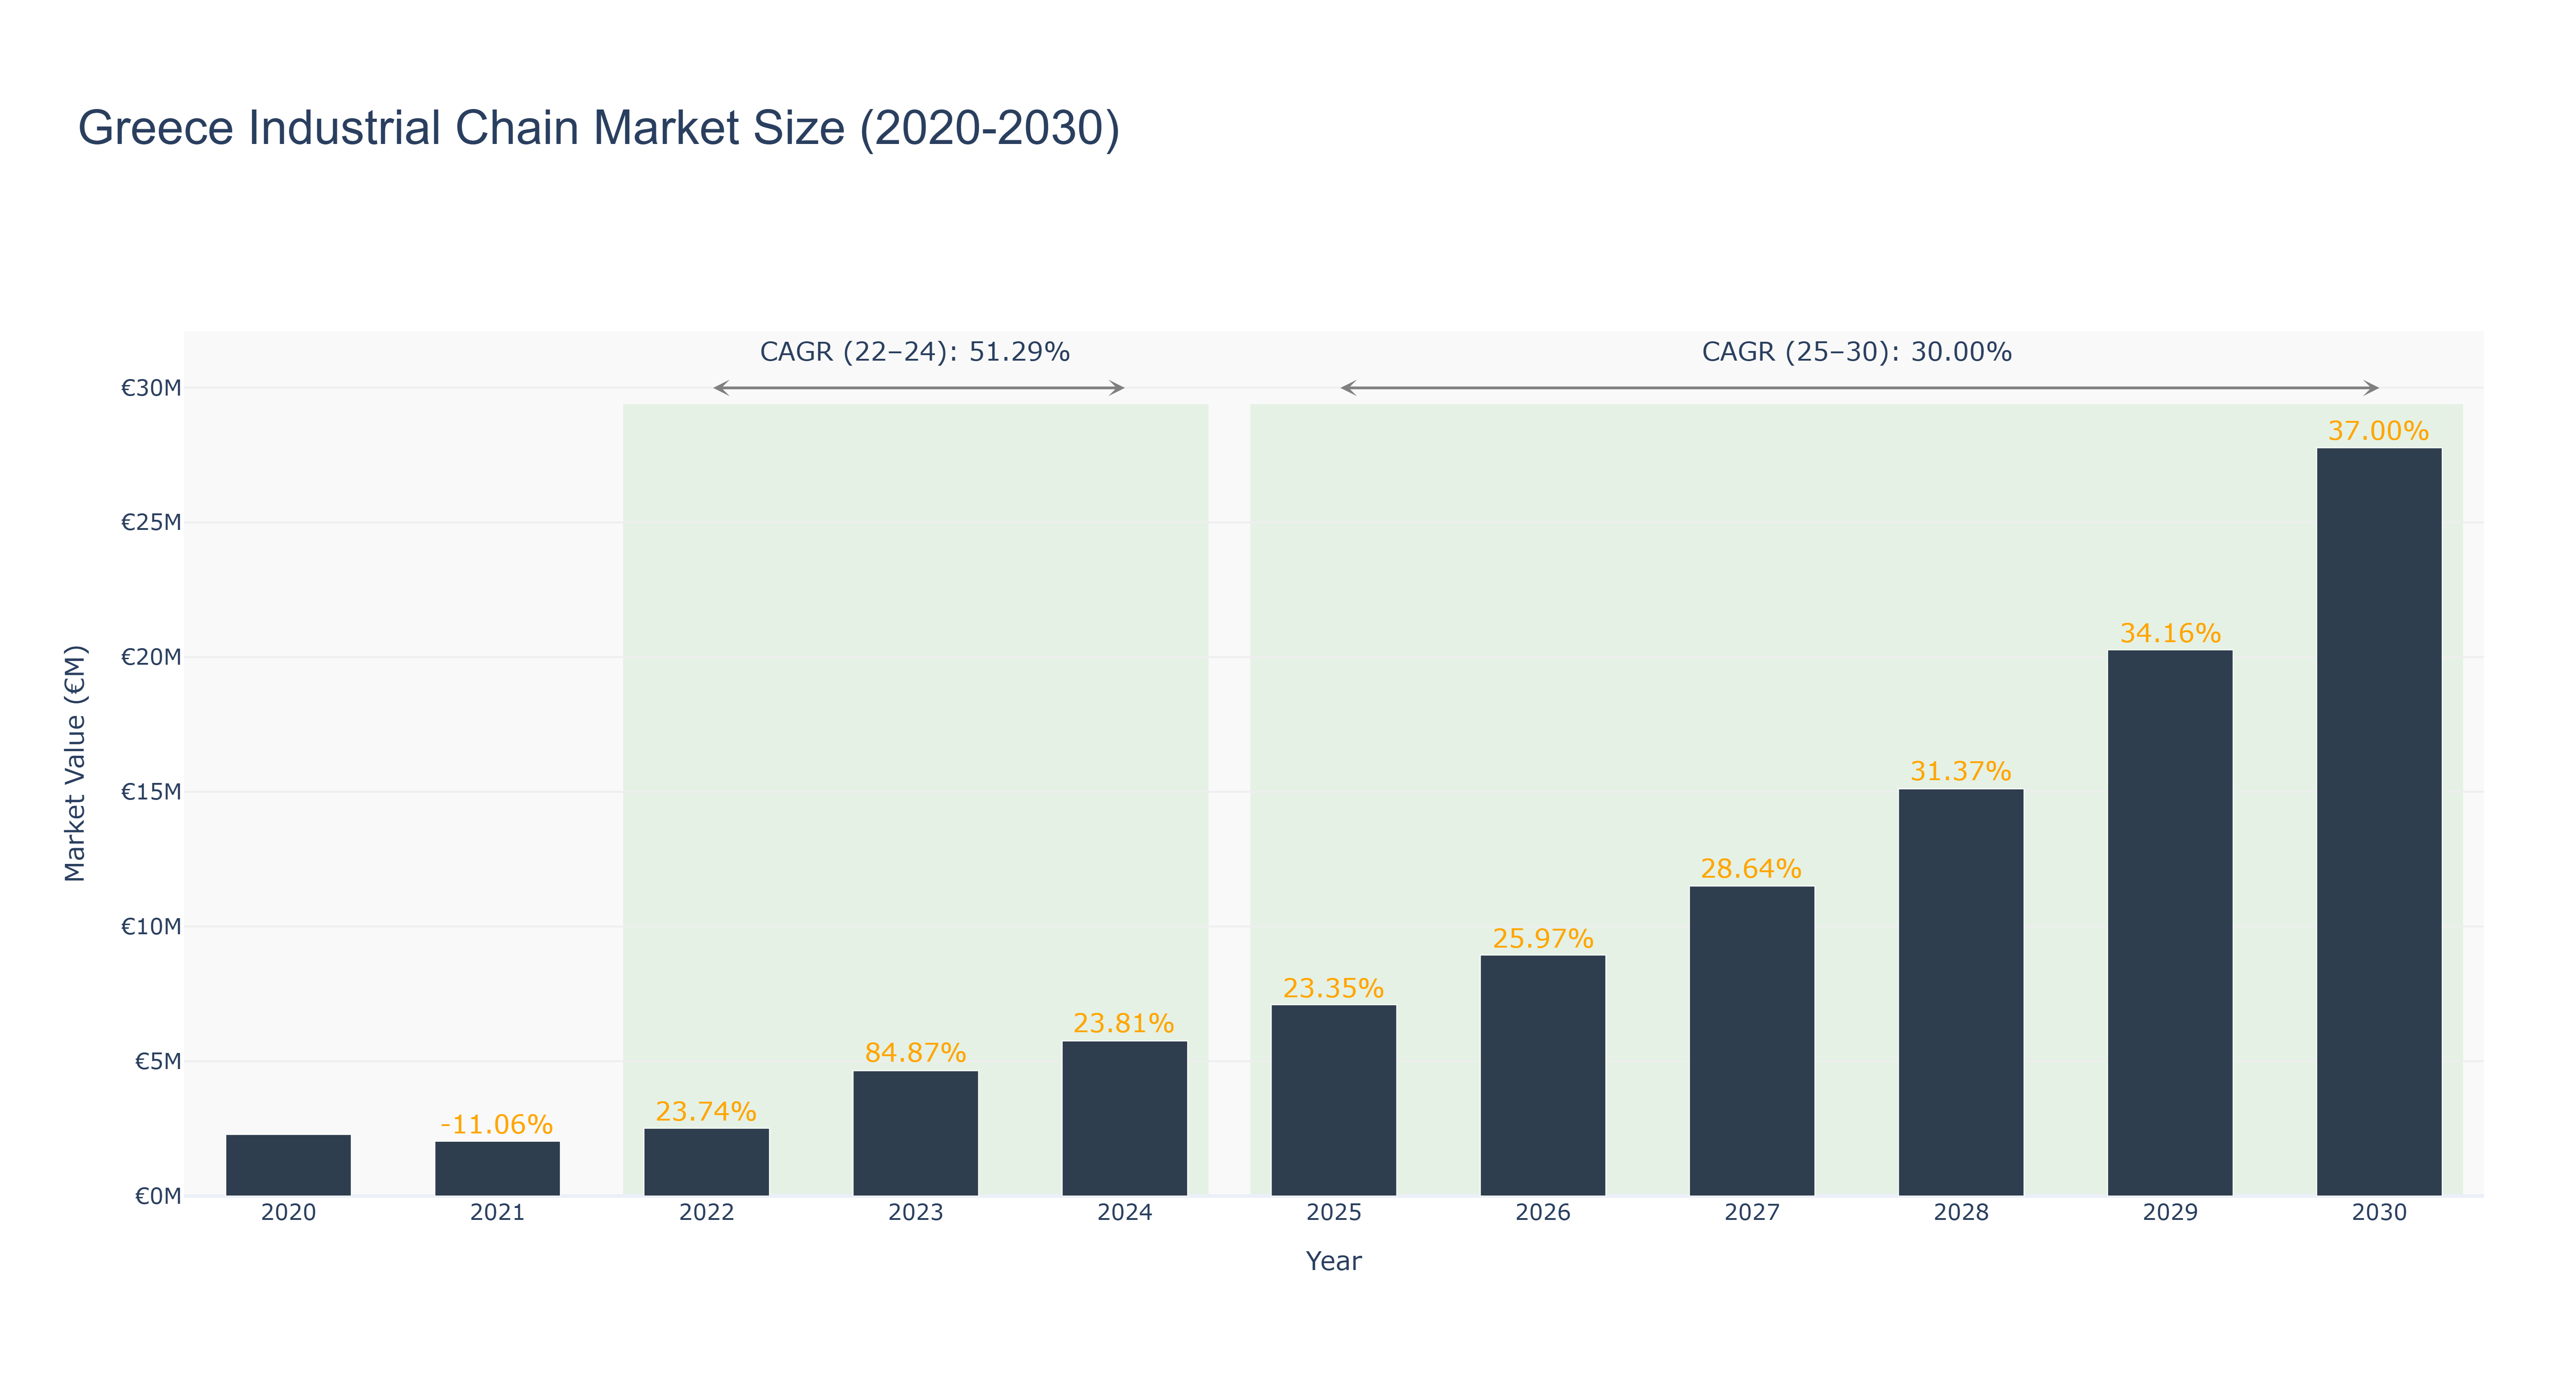
The Greece Industrial Chain Market has shown a significant growth trajectory over the years. The peak market size was €27.77 million in 2030, with a compound annual growth rate (CAGR) of 37.00% from 2025 to 2030. The actual market size saw steady growth from €2.28 million in 2020 to €5.75 million in 2024. The market experienced a sharp increase in 2023, with a growth rate of 84.87%, driven by increased investments in industrial infrastructure and technology. The recent CAGR from 2022 to 2024 was 51.29%, indicating rapid expansion during that period. Looking ahead, the CAGR from 2025 to 2030 is forecasted at 30.0%, reflecting sustained growth opportunities in the industrial chain sector. Future developments in Greece include the implementation of advanced manufacturing technologies to enhance production efficiency and meet growing market demands.
Greece Industrial Chain Market: Production & Trade Performance (2019-2025)
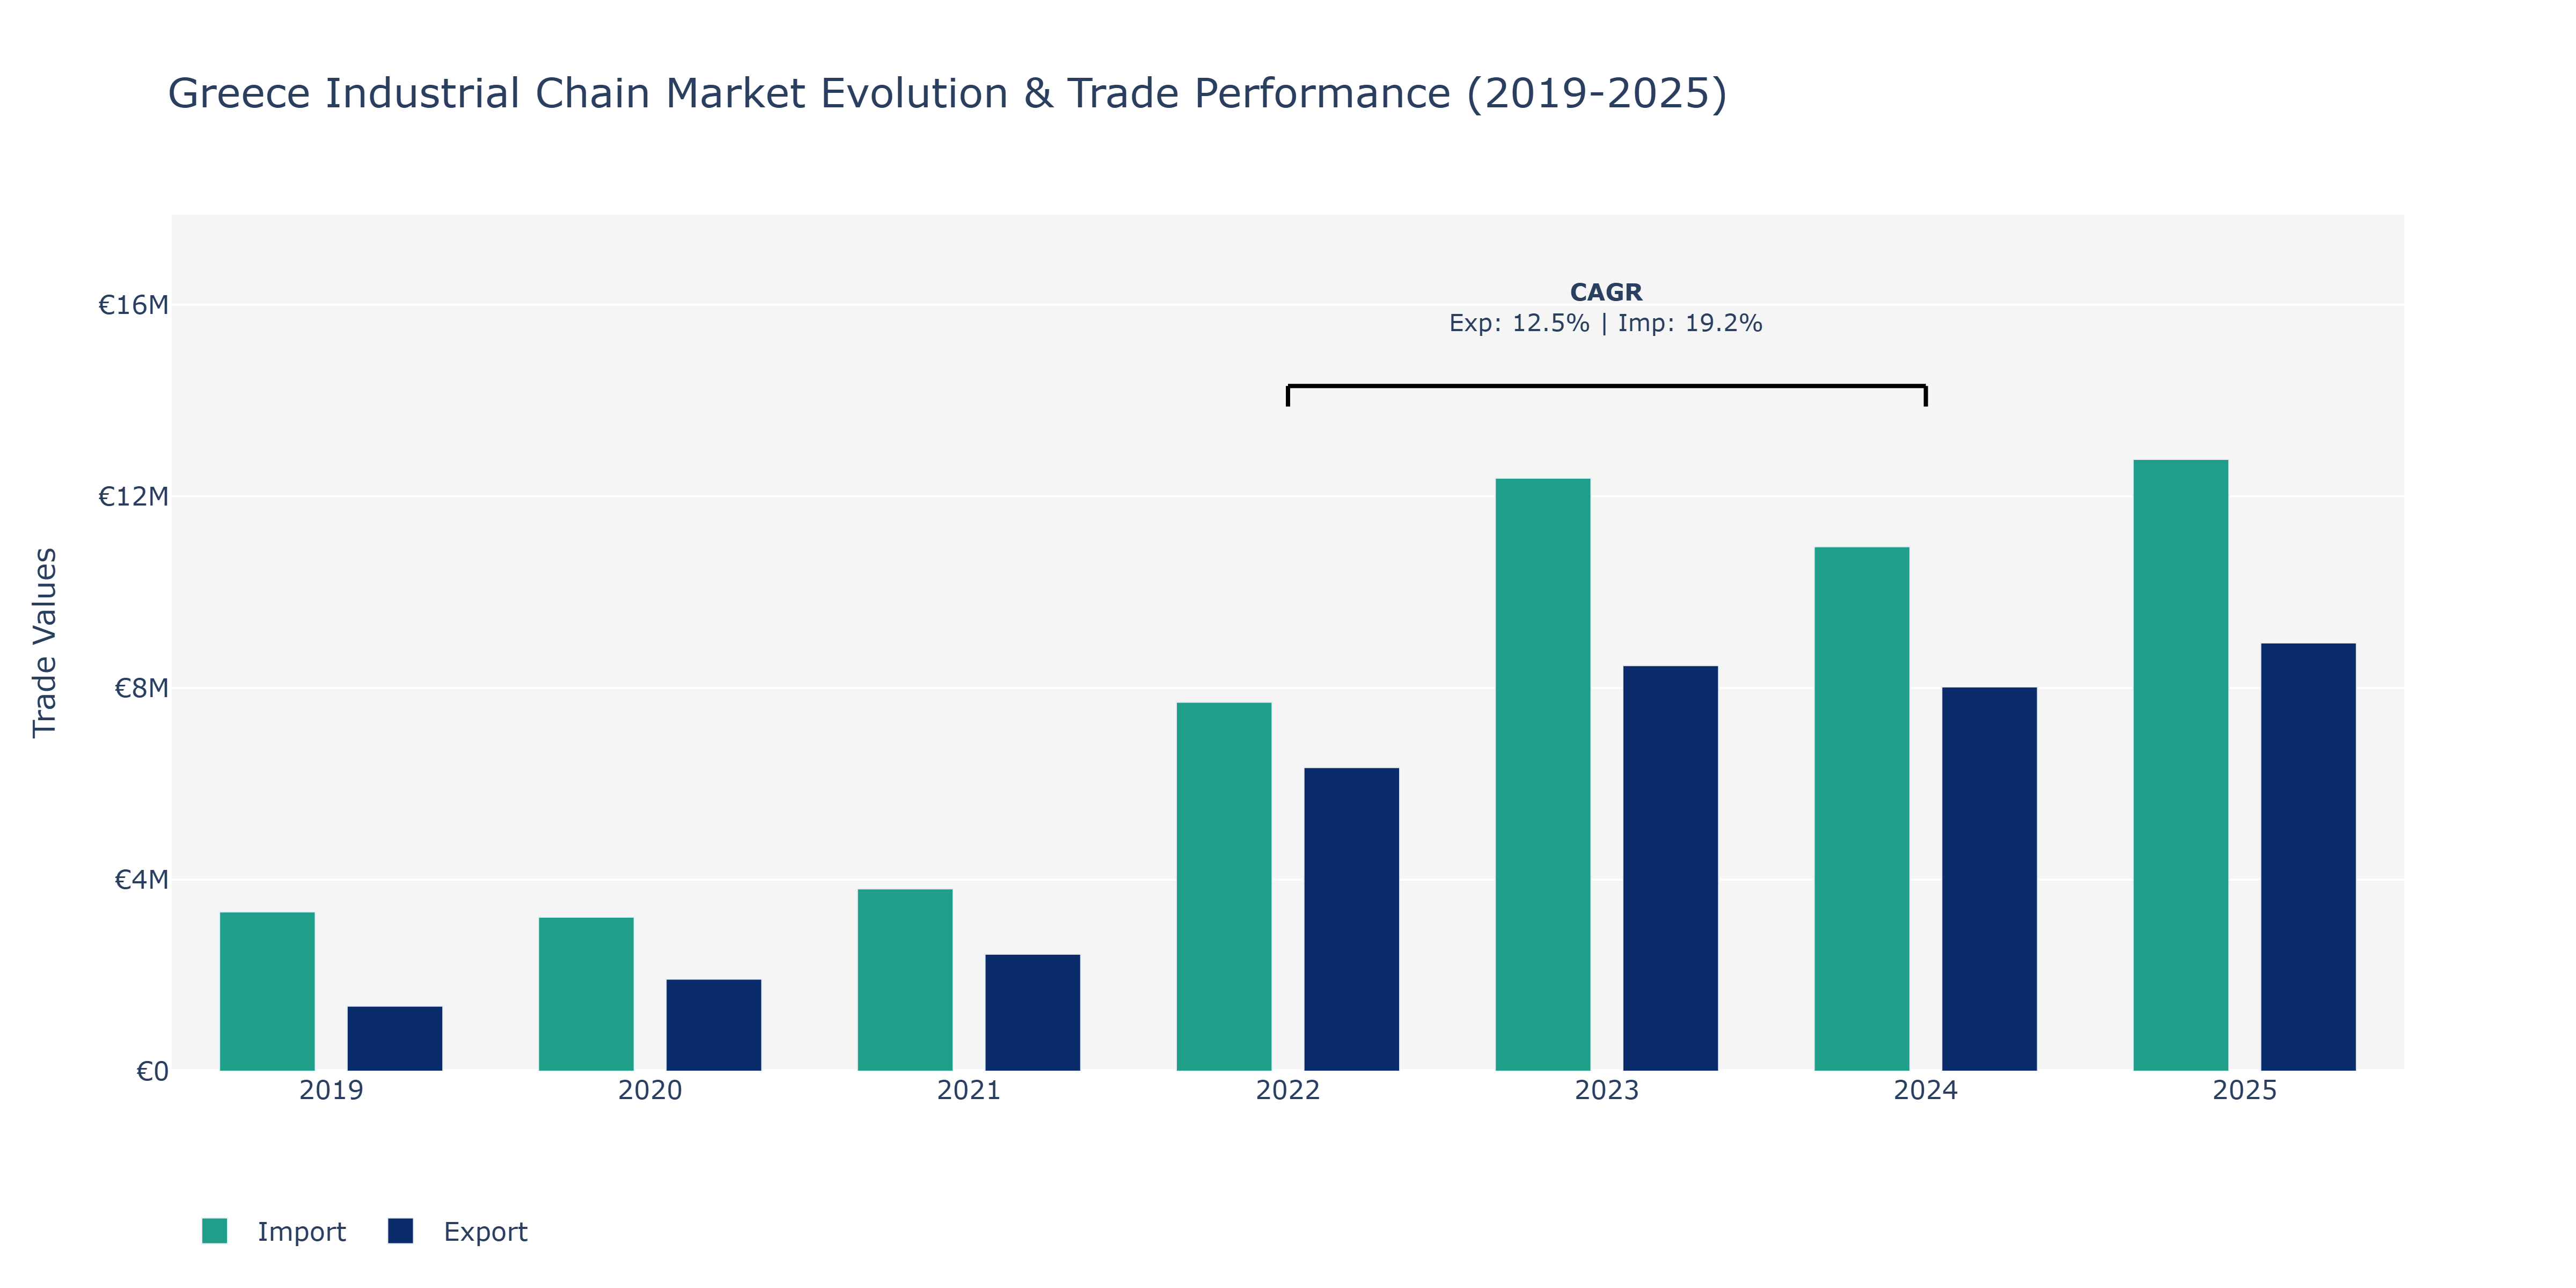
Between 2019 and 2025, Greece's Industrial Chain Market experienced notable growth in both exports and imports. Exports surged from €1.36 million in 2019 to approximately €8.94 million in 2025, displaying a consistent upward trajectory. Conversely, imports also saw a substantial increase from around €3.32 million in 2019 to about €12.77 million in 2025. Noteworthy peaks in both exports and imports were observed in 2025, indicating a robust market performance. The market's expansion can be attributed to Greece's strategic geographical location, which enhances trade opportunities, coupled with the country's focus on strengthening its industrial sector. Additionally, advancements in technology and infrastructure improvements have likely boosted the efficiency of the supply chain, facilitating increased trade activities. The steady growth in both exports and imports showcases Greece's growing prominence in the global industrial chain market.
Key Highlights of the Report:
- Greece Industrial Chain Market Outlook
- Market Size of Greece Industrial Chain Market, 2025
- Forecast of Greece Industrial Chain Market, 2032
- Historical Data and Forecast of Greece Industrial Chain Revenues & Volume for the Period 2022-2032F
- Greece Industrial Chain Market Trend Evolution
- Greece Industrial Chain Market Drivers and Challenges
- Greece Industrial Chain Price Trends
- Greece Industrial Chain Porter's Five Forces
- Greece Industrial Chain Industry Life Cycle
- Historical Data and Forecast of Greece Industrial Chain Market Revenues & Volume By Chain Type for the Period 2022-2032F
- Historical Data and Forecast of Greece Industrial Chain Market Revenues & Volume By Roller Chains for the Period 2022-2032F
- Historical Data and Forecast of Greece Industrial Chain Market Revenues & Volume By Leaf Chains for the Period 2022-2032F
- Historical Data and Forecast of Greece Industrial Chain Market Revenues & Volume By Silent Chains for the Period 2022-2032F
- Historical Data and Forecast of Greece Industrial Chain Market Revenues & Volume By Engineered Chains for the Period 2022-2032F
- Historical Data and Forecast of Greece Industrial Chain Market Revenues & Volume By Material Used for the Period 2022-2032F
- Historical Data and Forecast of Greece Industrial Chain Market Revenues & Volume By Stainless Steel for the Period 2022-2032F
- Historical Data and Forecast of Greece Industrial Chain Market Revenues & Volume By Carbon Steel for the Period 2022-2032F
- Historical Data and Forecast of Greece Industrial Chain Market Revenues & Volume By Alloy Steel for the Period 2022-2032F
- Historical Data and Forecast of Greece Industrial Chain Market Revenues & Volume By Nickel-Plated Steel for the Period 2022-2032F
- Historical Data and Forecast of Greece Industrial Chain Market Revenues & Volume By Application for the Period 2022-2032F
- Historical Data and Forecast of Greece Industrial Chain Market Revenues & Volume By Conveyor Systems for the Period 2022-2032F
- Historical Data and Forecast of Greece Industrial Chain Market Revenues & Volume By Power Transmission for the Period 2022-2032F
- Historical Data and Forecast of Greece Industrial Chain Market Revenues & Volume By Lifting Applications for the Period 2022-2032F
- Historical Data and Forecast of Greece Industrial Chain Market Revenues & Volume By Mining & Drilling for the Period 2022-2032F
- Historical Data and Forecast of Greece Industrial Chain Market Revenues & Volume By End User for the Period 2022-2032F
- Historical Data and Forecast of Greece Industrial Chain Market Revenues & Volume By Manufacturing for the Period 2022-2032F
- Historical Data and Forecast of Greece Industrial Chain Market Revenues & Volume By Automotive for the Period 2022-2032F
- Historical Data and Forecast of Greece Industrial Chain Market Revenues & Volume By Construction for the Period 2022-2032F
- Historical Data and Forecast of Greece Industrial Chain Market Revenues & Volume By Oil & Gas for the Period 2022-2032F
- Historical Data and Forecast of Greece Industrial Chain Market Revenues & Volume By Sales Model for the Period 2022-2032F
- Historical Data and Forecast of Greece Industrial Chain Market Revenues & Volume By Direct Sales for the Period 2022-2032F
- Historical Data and Forecast of Greece Industrial Chain Market Revenues & Volume By Distributors for the Period 2022-2032F
- Historical Data and Forecast of Greece Industrial Chain Market Revenues & Volume By Online Suppliers for the Period 2022-2032F
- Historical Data and Forecast of Greece Industrial Chain Market Revenues & Volume By Industrial Suppliers for the Period 2022 - 2032F
- Greece Industrial Chain Import Export Trade Statistics
- Market Opportunity Assessment By Chain Type
- Market Opportunity Assessment By Material Used
- Market Opportunity Assessment By Application
- Market Opportunity Assessment By End User
- Market Opportunity Assessment By Sales Model
- Greece Industrial Chain Top Companies Market Share
- Greece Industrial Chain Competitive Benchmarking By Technical and Operational Parameters
- Greece Industrial Chain Company Profiles
- Greece Industrial Chain Key Strategic Recommendations
Frequently Asked Questions About the Market Study (FAQs):
6Wresearch actively monitors the Greece Industrial Chain Market and publishes its comprehensive annual report, highlighting emerging trends, growth drivers, revenue analysis, and forecast outlook. Our insights help businesses to make data-backed strategic decisions with ongoing market dynamics. Our analysts track relevent industries related to the Greece Industrial Chain Market, allowing our clients with actionable intelligence and reliable forecasts tailored to emerging regional needs.
Yes, we provide customisation as per your requirements. To learn more, feel free to contact us on sales@6wresearch.com
1 Executive Summary |
2 Introduction |
2.1 Key Highlights of the Report |
2.2 Report Description |
2.3 Market Scope & Segmentation |
2.4 Research Methodology |
2.5 Assumptions |
3 Greece Industrial Chain Market Overview |
3.1 Greece Country Macro Economic Indicators |
3.2 Greece Industrial Chain Market Revenues & Volume, 2022 & 2032F |
3.3 Greece Industrial Chain Market - Industry Life Cycle |
3.4 Greece Industrial Chain Market - Porter's Five Forces |
3.5 Greece Industrial Chain Market Revenues & Volume Share, By Chain Type, 2022 & 2032F |
3.6 Greece Industrial Chain Market Revenues & Volume Share, By Material Used, 2022 & 2032F |
3.7 Greece Industrial Chain Market Revenues & Volume Share, By Application, 2022 & 2032F |
3.8 Greece Industrial Chain Market Revenues & Volume Share, By End User, 2022 & 2032F |
3.9 Greece Industrial Chain Market Revenues & Volume Share, By Sales Model, 2022 & 2032F |
4 Greece Industrial Chain Market Dynamics |
4.1 Impact Analysis |
4.2 Market Drivers |
4.2.1 Growing demand for industrial chains in key sectors such as automotive, construction, and manufacturing |
4.2.2 Increasing investments in infrastructure projects in Greece |
4.2.3 Adoption of advanced technologies and automation in industrial processes |
4.3 Market Restraints |
4.3.1 Economic instability and uncertainty in Greece affecting investment decisions |
4.3.2 Intense competition from international industrial chain manufacturers |
4.3.3 Volatility in raw material prices impacting production costs |
5 Greece Industrial Chain Market Trends |
6 Greece Industrial Chain Market, By Types |
6.1 Greece Industrial Chain Market, By Chain Type |
6.1.1 Overview and Analysis |
6.1.2 Greece Industrial Chain Market Revenues & Volume, By Chain Type, 2022 - 2032F |
6.1.3 Greece Industrial Chain Market Revenues & Volume, By Roller Chains, 2022 - 2032F |
6.1.4 Greece Industrial Chain Market Revenues & Volume, By Leaf Chains, 2022 - 2032F |
6.1.5 Greece Industrial Chain Market Revenues & Volume, By Silent Chains, 2022 - 2032F |
6.1.6 Greece Industrial Chain Market Revenues & Volume, By Engineered Chains, 2022 - 2032F |
6.2 Greece Industrial Chain Market, By Material Used |
6.2.1 Overview and Analysis |
6.2.2 Greece Industrial Chain Market Revenues & Volume, By Stainless Steel, 2022 - 2032F |
6.2.3 Greece Industrial Chain Market Revenues & Volume, By Carbon Steel, 2022 - 2032F |
6.2.4 Greece Industrial Chain Market Revenues & Volume, By Alloy Steel, 2022 - 2032F |
6.2.5 Greece Industrial Chain Market Revenues & Volume, By Nickel-Plated Steel, 2022 - 2032F |
6.3 Greece Industrial Chain Market, By Application |
6.3.1 Overview and Analysis |
6.3.2 Greece Industrial Chain Market Revenues & Volume, By Conveyor Systems, 2022 - 2032F |
6.3.3 Greece Industrial Chain Market Revenues & Volume, By Power Transmission, 2022 - 2032F |
6.3.4 Greece Industrial Chain Market Revenues & Volume, By Lifting Applications, 2022 - 2032F |
6.3.5 Greece Industrial Chain Market Revenues & Volume, By Mining & Drilling, 2022 - 2032F |
6.4 Greece Industrial Chain Market, By End User |
6.4.1 Overview and Analysis |
6.4.2 Greece Industrial Chain Market Revenues & Volume, By Manufacturing, 2022 - 2032F |
6.4.3 Greece Industrial Chain Market Revenues & Volume, By Automotive, 2022 - 2032F |
6.4.4 Greece Industrial Chain Market Revenues & Volume, By Construction, 2022 - 2032F |
6.4.5 Greece Industrial Chain Market Revenues & Volume, By Oil & Gas, 2022 - 2032F |
6.5 Greece Industrial Chain Market, By Sales Model |
6.5.1 Overview and Analysis |
6.5.2 Greece Industrial Chain Market Revenues & Volume, By Direct Sales, 2022 - 2032F |
6.5.3 Greece Industrial Chain Market Revenues & Volume, By Distributors, 2022 - 2032F |
6.5.4 Greece Industrial Chain Market Revenues & Volume, By Online Suppliers, 2022 - 2032F |
6.5.5 Greece Industrial Chain Market Revenues & Volume, By Industrial Suppliers, 2022 - 2032F |
7 Greece Industrial Chain Market Import-Export Trade Statistics |
7.1 Greece Industrial Chain Market Export to Major Countries |
7.2 Greece Industrial Chain Market Imports from Major Countries |
8 Greece Industrial Chain Market Key Performance Indicators |
8.1 Number of infrastructure projects initiated or completed in Greece |
8.2 Adoption rate of automation technologies in Greek industries |
8.3 Percentage of industrial chain imports substituted by domestic production |
8.4 Rate of growth in key sectors utilizing industrial chains in Greece |
8.5 Number of strategic partnerships formed with key industries for supply of industrial chains |
9 Greece Industrial Chain Market - Opportunity Assessment |
9.1 Greece Industrial Chain Market Opportunity Assessment, By Chain Type, 2022 & 2032F |
9.2 Greece Industrial Chain Market Opportunity Assessment, By Material Used, 2022 & 2032F |
9.3 Greece Industrial Chain Market Opportunity Assessment, By Application, 2022 & 2032F |
9.4 Greece Industrial Chain Market Opportunity Assessment, By End User, 2022 & 2032F |
9.5 Greece Industrial Chain Market Opportunity Assessment, By Sales Model, 2022 & 2032F |
10 Greece Industrial Chain Market - Competitive Landscape |
10.1 Greece Industrial Chain Market Revenue Share, By Companies, 2025 |
10.2 Greece Industrial Chain Market Competitive Benchmarking, By Operating and Technical Parameters |
11 Company Profiles |
12 Recommendations |
13 Disclaimer |
Global Go To Market Strategy - 2030
Export potential enables firms to identify high-growth global markets with greater confidence by combining advanced trade intelligence with a structured quantitative methodology. The framework analyzes emerging demand trends and country-level import patterns while integrating macroeconomic and trade datasets such as GDP and population forecasts, bilateral import–export flows, tariff structures, elasticity differentials between developed and developing economies, geographic distance, and import demand projections. Using weighted trade values from 2020–2024 as the base period to project country-to-country export potential for 2030, these inputs are operationalized through calculated drivers such as gravity model parameters, tariff impact factors, and projected GDP per-capita growth. Through an analysis of hidden potentials, demand hotspots, and market conditions that are most favorable to success, this method enables firms to focus on target countries, maximize returns, and global expansion with data, backed by accuracy.
By factoring in the projected importer demand gap that is currently unmet and could be potential opportunity, it identifies the potential for the Exporter (Country) among 190 countries, against the general trade analysis, which identifies the biggest importer or exporter.
To discover high-growth global markets and optimize your business strategy:
Click Here
Pricing
- Single User License$ 1,995
- Department License$ 2,400
- Site License$ 3,120
- Global License$ 3,795

Leadership Perspectives from Industry Events
Search
Thought Leadership and Analyst Meet


Our Clients
6WResearch In News
- India Export Attractiveness Tracker 2026
- India Air Conditioner Market Set for Strong Rebound in 2026 After Weather-Led Correction and GST-Driven Recovery: 6Wresearch
- ADAS in India: How Automatic Emergency Braking, Blind Spot Detection & Driver Monitoring are Transforming Road Safety
- Doha a strategic location for EV manufacturing hub: IPA Qatar
- Demand for luxury TVs surging in the GCC, says Samsung
- Empowering Growth: The Thriving Journey of Bangladesh’s Cable Industry
Latest Reports
- Qatar Access and Home Network Market (2026-2032)
- Nicaragua RPG Gaming Market (2026-2032)
- New Zealand RPG Gaming Market (2026-2032)
- Netherlands RPG Gaming Market (2026-2032)
- Nauru RPG Gaming Market (2026-2032)
- Namibia RPG Gaming Market (2026-2032)
- Mozambique RPG Gaming Market (2026-2032)
- Montenegro RPG Gaming Market (2026-2032)
- Mongolia RPG Gaming Market (2026-2032)
- Monaco RPG Gaming Market (2026-2032)
Industry Events and Analyst Meet

EV India Expo 2026

HIMTEX 2026

India Refining Summit 2026

India EV Show 2026

EV tech India Expo 2026
Whitepaper
- Middle East & Africa Commercial Security Market Click here to view more.
- Middle East & Africa Fire Safety Systems & Equipment Market Click here to view more.
- GCC Drone Market Click here to view more.
- Middle East Lighting Fixture Market Click here to view more.
- GCC Physical & Perimeter Security Market Click here to view more.