Greece Potassium Fluorosilicate Market (2026-2032) | Forecast, Analysis, Trends, Companies, Value, Size, Revenue, Growth, Share, Outlook, Segmentation & Industry
Market Forecast By Type (0.98, Other), By Application (Metal industry (fluxing agents)., Glass industry (opacifying agent)., Construction industry (additive for concrete)) And Competitive Landscape
| Product Code: ETC4893773 | Publication Date: Nov 2023 | Updated Date: Apr 2026 | Product Type: Market Research Report | |
| Publisher: 6Wresearch | Author: Shubham Padhi | No. of Pages: 60 | No. of Figures: 30 | No. of Tables: 5 |
Greece Potassium Fluorosilicate Market Size (2020-2030)
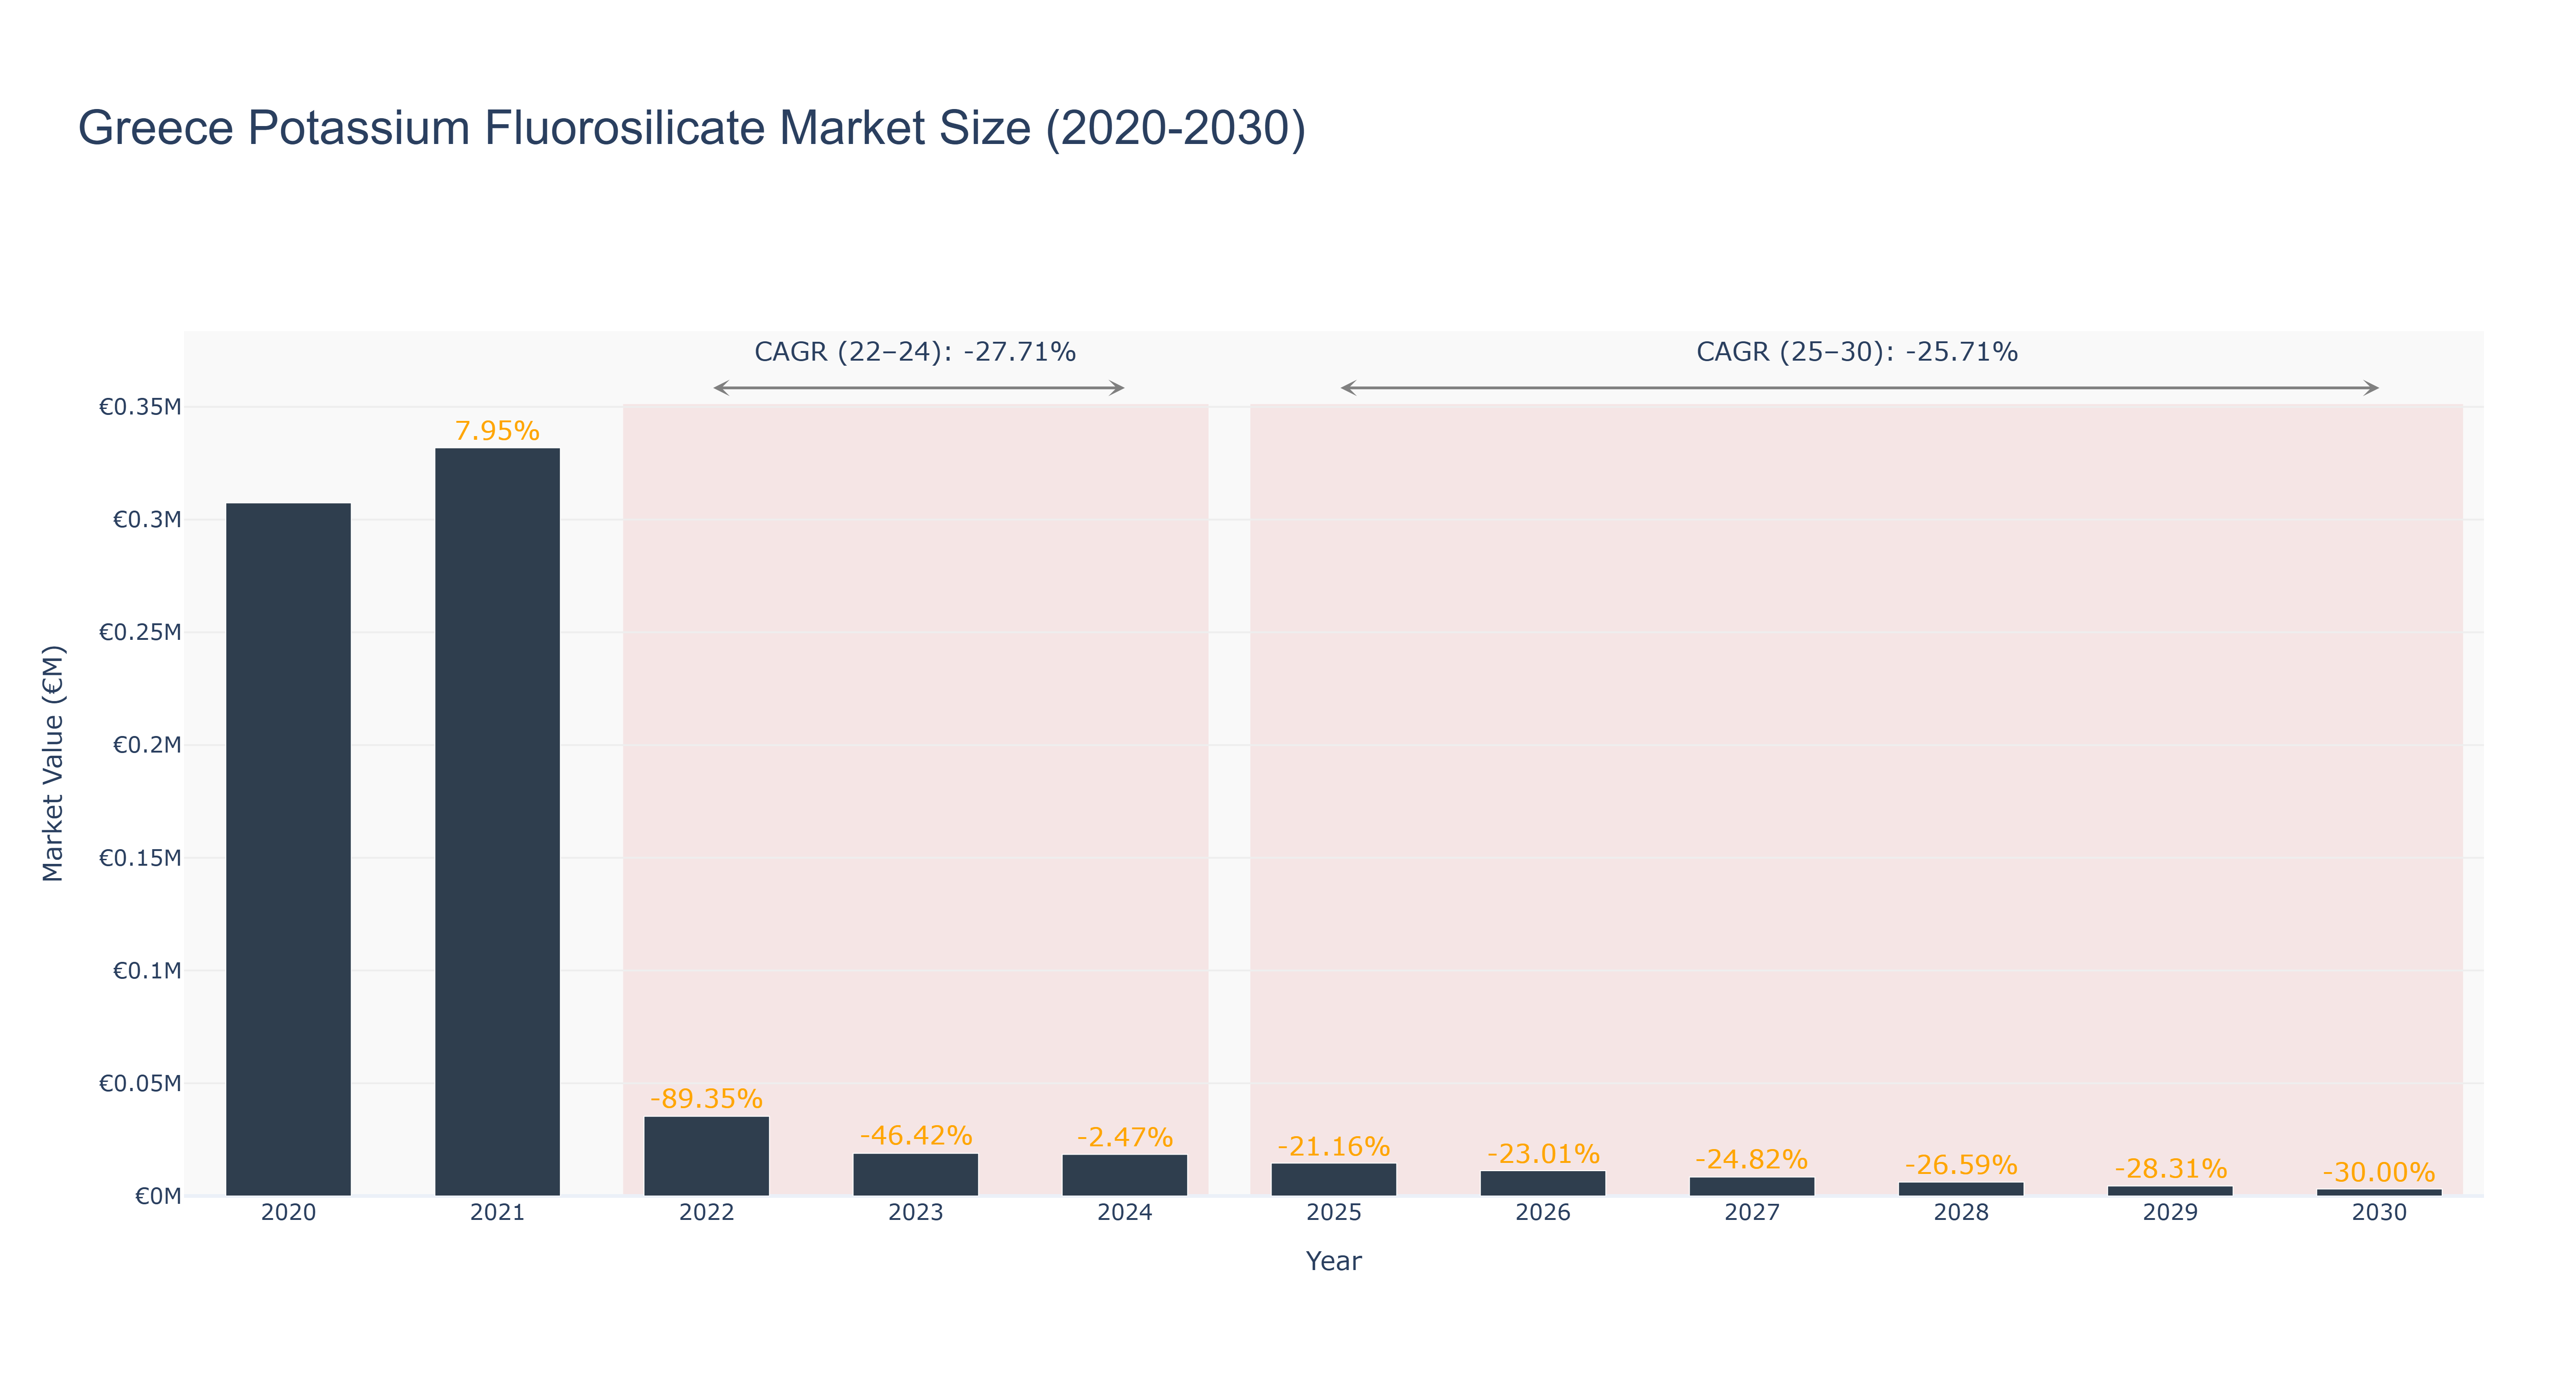
The Greece Potassium Fluorosilicate Market has exhibited a significant decline following a peak market size of €331.84 thousand in 2021. The actual market size has dramatically decreased from €35.35 thousand in 2022 to €18.47 thousand in 2024, reflecting a negative CAGR of -27.71% during this period. The downturn can be attributed to various factors, including reduced demand in key sectors and competitive pressures from alternative materials. Looking ahead, the forecasted period from 2025 to 2030 suggests a continued contraction, with projected market sizes decreasing from €14.56 thousand in 2025 to €3.11 thousand by 2030, corresponding to a CAGR of -25.71%. This sustained decline underscores challenges such as market saturation and potential regulatory changes impacting production. Without significant innovation or new applications, the market is likely to remain under pressure, reflecting broader trends in the chemical industry.
Greece Potassium Fluorosilicate Market: Production & Trade Performance (2019-2025)
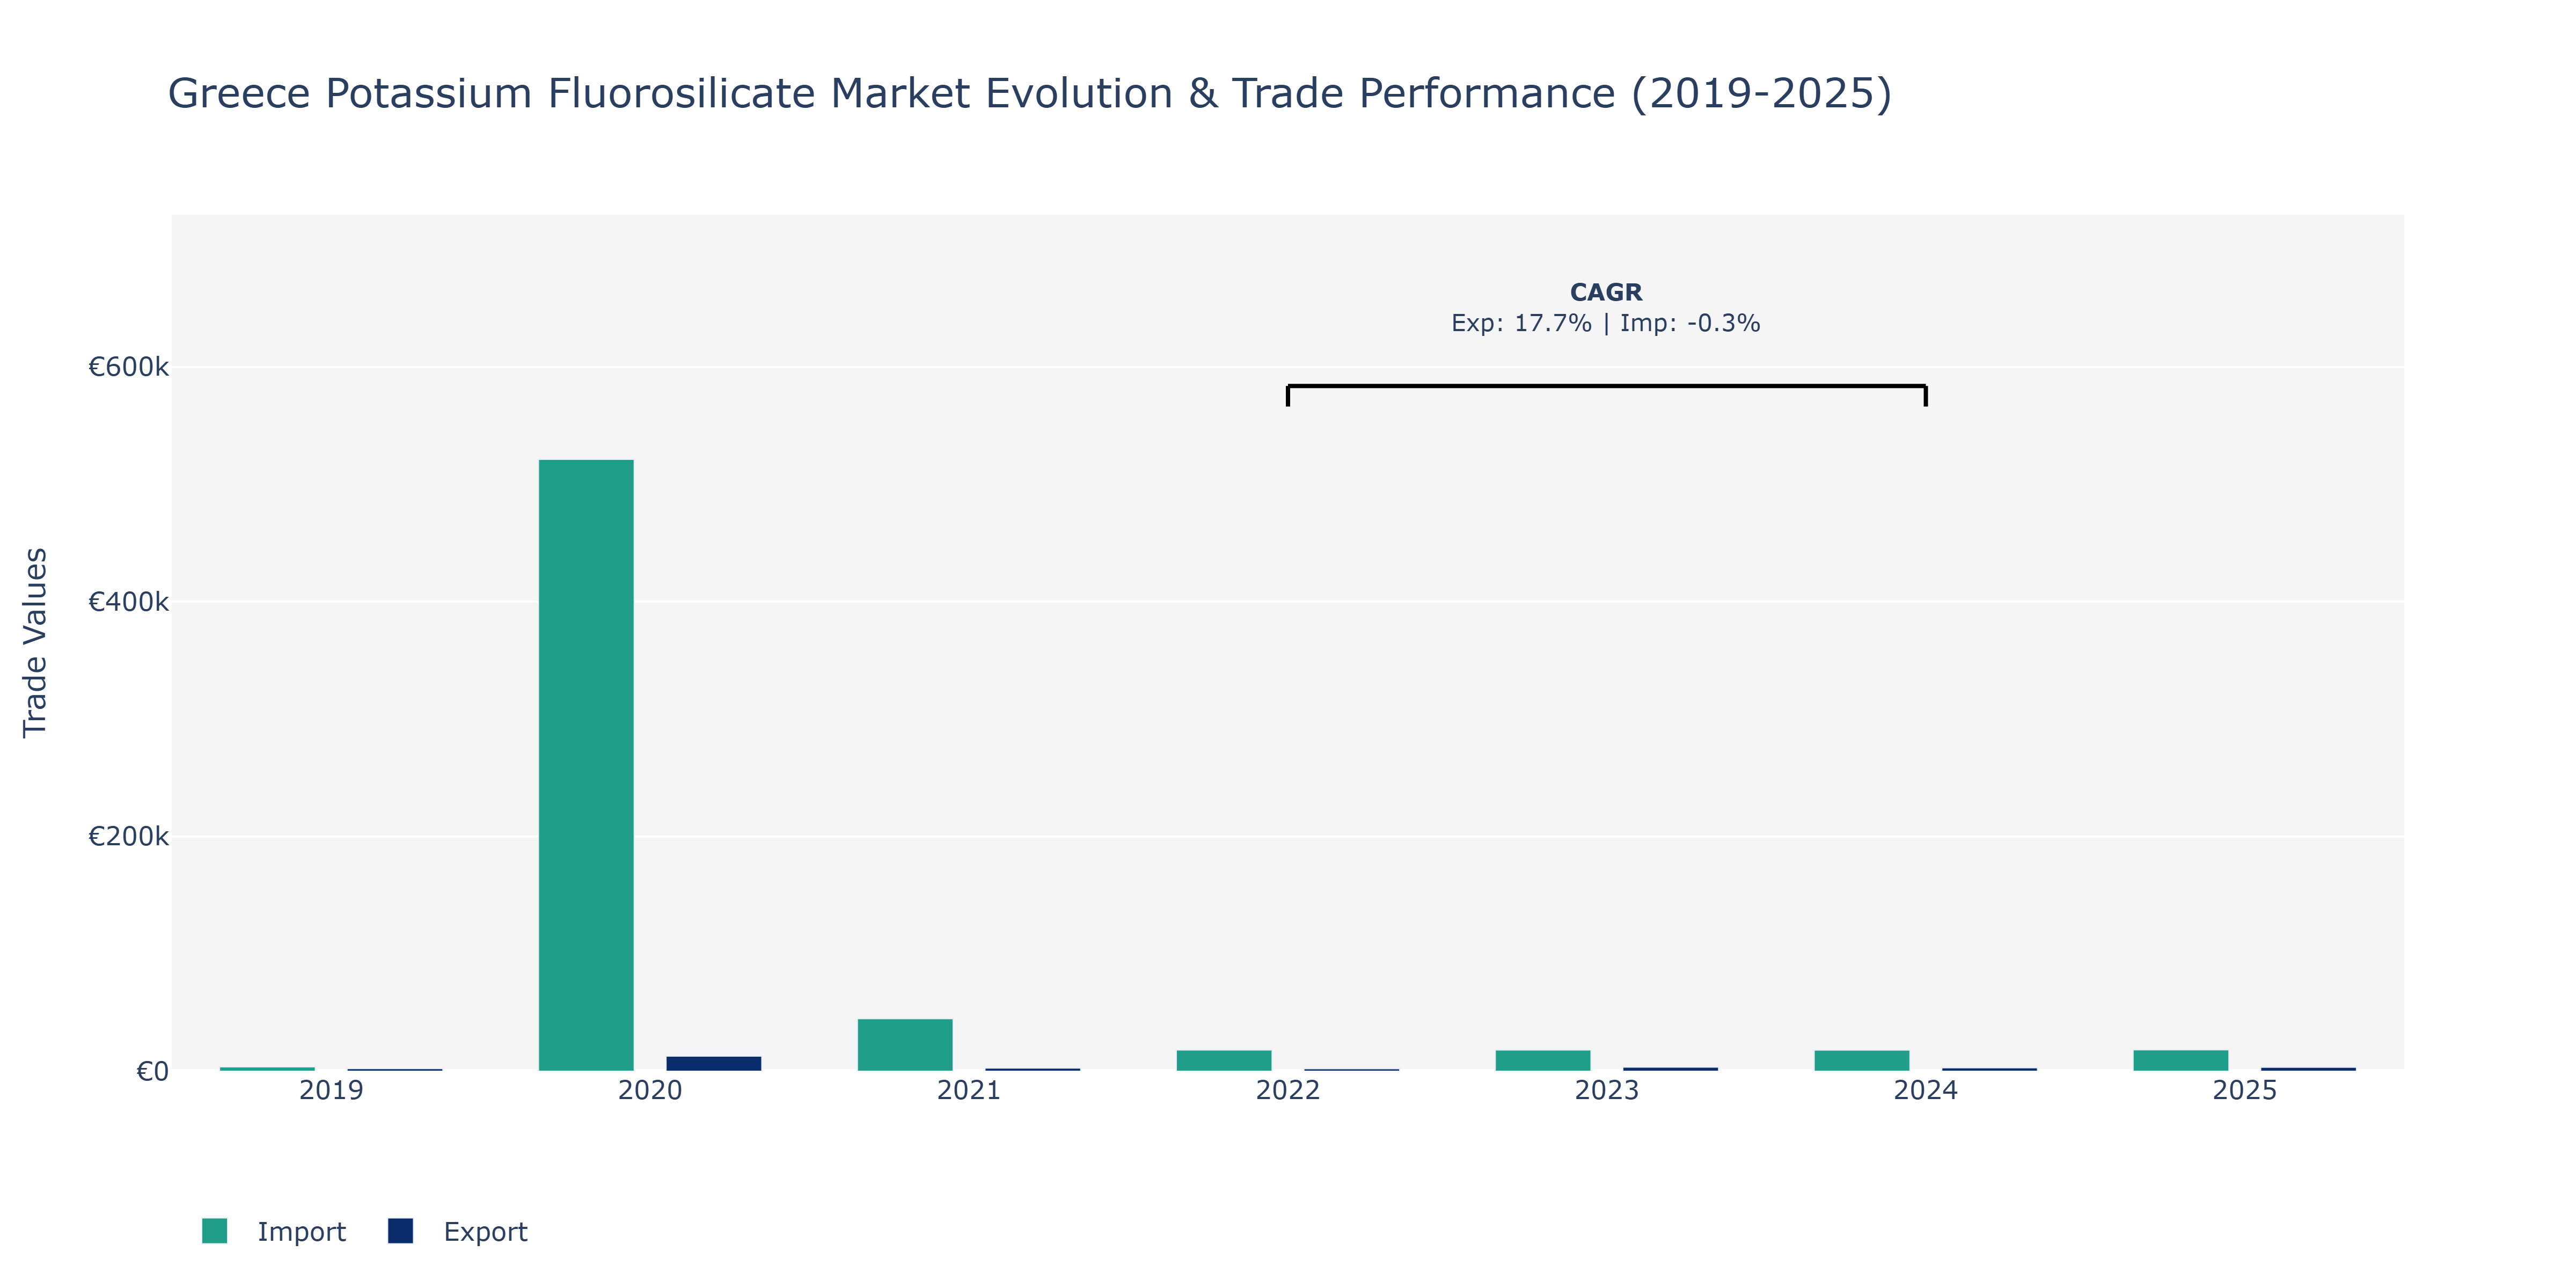
In the Greece Potassium Fluorosilicate Market, exports and imports witnessed notable fluctuations over the years. In 2020, imports surged to €521.2 thousand, marking a substantial increase from the previous year's €3.64 thousand, possibly driven by heightened demand for raw materials or production inputs. Conversely, exports peaked at €12.78 thousand in 2020, indicating a significant surge likely due to increased international trade partnerships or a rise in global demand for potassium fluorosilicate products. Despite this peak, exports declined in 2021 to €2.58 thousand, potentially impacted by market saturation or shifts in consumer preferences. The following years saw a mix of fluctuations in both exports and imports, reflecting changing market dynamics influenced by factors such as global supply chain disruptions or evolving industry regulations. Such dynamics emphasize the need for market players to stay agile and adapt swiftly to market changes to maintain competitiveness and sustainability in the Greece Potassium Fluorosilicate Market.
Key Highlights of the Report:
- Greece Potassium Fluorosilicate Market Outlook
- Market Size of Greece Potassium Fluorosilicate Market, 2025
- Forecast of Greece Potassium Fluorosilicate Market, 2032
- Historical Data and Forecast of Greece Potassium Fluorosilicate Revenues & Volume for the Period 2022-2032F
- Greece Potassium Fluorosilicate Market Trend Evolution
- Greece Potassium Fluorosilicate Market Drivers and Challenges
- Greece Potassium Fluorosilicate Price Trends
- Greece Potassium Fluorosilicate Porter`s Five Forces
- Greece Potassium Fluorosilicate Industry Life Cycle
- Historical Data and Forecast of Greece Potassium Fluorosilicate Market Revenues & Volume By Type for the Period 2022-2032F
- Historical Data and Forecast of Greece Potassium Fluorosilicate Market Revenues & Volume By 0.98 for the Period 2022-2032F
- Historical Data and Forecast of Greece Potassium Fluorosilicate Market Revenues & Volume By Other for the Period 2022-2032F
- Historical Data and Forecast of Greece Potassium Fluorosilicate Market Revenues & Volume By Application for the Period 2022-2032F
- Historical Data and Forecast of Greece Potassium Fluorosilicate Market Revenues & Volume By Metal industry (fluxing agents). for the Period 2022-2032F
- Historical Data and Forecast of Greece Potassium Fluorosilicate Market Revenues & Volume By Glass industry (opacifying agent). for the Period 2022-2032F
- Historical Data and Forecast of Greece Potassium Fluorosilicate Market Revenues & Volume By Construction industry (additive for concrete) for the Period 2022-2032F
- Greece Potassium Fluorosilicate Import Export Trade Statistics
- Market Opportunity Assessment By Type
- Market Opportunity Assessment By Application
- Greece Potassium Fluorosilicate Top Companies Market Share
- Greece Potassium Fluorosilicate Competitive Benchmarking By Technical and Operational Parameters
- Greece Potassium Fluorosilicate Company Profiles
- Greece Potassium Fluorosilicate Key Strategic Recommendations
Frequently Asked Questions About the Market Study (FAQs):
6Wresearch actively monitors the Greece Potassium Fluorosilicate Market and publishes its comprehensive annual report, highlighting emerging trends, growth drivers, revenue analysis, and forecast outlook. Our insights help businesses to make data-backed strategic decisions with ongoing market dynamics. Our analysts track relevent industries related to the Greece Potassium Fluorosilicate Market, allowing our clients with actionable intelligence and reliable forecasts tailored to emerging regional needs.
Yes, we provide customisation as per your requirements. To learn more, feel free to contact us on sales@6wresearch.com
1 Executive Summary |
2 Introduction |
2.1 Key Highlights of the Report |
2.2 Report Description |
2.3 Market Scope & Segmentation |
2.4 Research Methodology |
2.5 Assumptions |
3 Greece Potassium Fluorosilicate Market Overview |
3.1 Greece Country Macro Economic Indicators |
3.2 Greece Potassium Fluorosilicate Market Revenues & Volume, 2022 & 2032F |
3.3 Greece Potassium Fluorosilicate Market - Industry Life Cycle |
3.4 Greece Potassium Fluorosilicate Market - Porter's Five Forces |
3.5 Greece Potassium Fluorosilicate Market Revenues & Volume Share, By Type, 2022 & 2032F |
3.6 Greece Potassium Fluorosilicate Market Revenues & Volume Share, By Application, 2022 & 2032F |
4 Greece Potassium Fluorosilicate Market Dynamics |
4.1 Impact Analysis |
4.2 Market Drivers |
4.2.1 Growing demand from the glass and ceramics industry due to its use as a flux in glass manufacturing. |
4.2.2 Increasing usage in the production of aluminum and magnesium alloys. |
4.2.3 Rising adoption in the agriculture sector for fertilizer applications. |
4.3 Market Restraints |
4.3.1 Fluctuating raw material prices impacting the production cost. |
4.3.2 Environmental regulations and concerns regarding the use of potassium fluorosilicate. |
4.3.3 Competition from substitute products like potassium fluoride affecting market growth. |
5 Greece Potassium Fluorosilicate Market Trends |
6 Greece Potassium Fluorosilicate Market Segmentations |
6.1 Greece Potassium Fluorosilicate Market, By Type |
6.1.1 Overview and Analysis |
6.1.2 Greece Potassium Fluorosilicate Market Revenues & Volume, By 0.98, 2022-2032F |
6.1.3 Greece Potassium Fluorosilicate Market Revenues & Volume, By Other, 2022-2032F |
6.2 Greece Potassium Fluorosilicate Market, By Application |
6.2.1 Overview and Analysis |
6.2.2 Greece Potassium Fluorosilicate Market Revenues & Volume, By Metal industry (fluxing agents)., 2022-2032F |
6.2.3 Greece Potassium Fluorosilicate Market Revenues & Volume, By Glass industry (opacifying agent)., 2022-2032F |
6.2.4 Greece Potassium Fluorosilicate Market Revenues & Volume, By Construction industry (additive for concrete), 2022-2032F |
7 Greece Potassium Fluorosilicate Market Import-Export Trade Statistics |
7.1 Greece Potassium Fluorosilicate Market Export to Major Countries |
7.2 Greece Potassium Fluorosilicate Market Imports from Major Countries |
8 Greece Potassium Fluorosilicate Market Key Performance Indicators |
8.1 Average selling price of potassium fluorosilicate. |
8.2 Number of new applications or industries adopting potassium fluorosilicate. |
8.3 Research and development investment in improving the quality and efficiency of potassium fluorosilicate production. |
9 Greece Potassium Fluorosilicate Market - Opportunity Assessment |
9.1 Greece Potassium Fluorosilicate Market Opportunity Assessment, By Type, 2022 & 2032F |
9.2 Greece Potassium Fluorosilicate Market Opportunity Assessment, By Application, 2022 & 2032F |
10 Greece Potassium Fluorosilicate Market - Competitive Landscape |
10.1 Greece Potassium Fluorosilicate Market Revenue Share, By Companies, 2025 |
10.2 Greece Potassium Fluorosilicate Market Competitive Benchmarking, By Operating and Technical Parameters |
11 Company Profiles |
12 Recommendations | 13 Disclaimer |
Global Go To Market Strategy - 2030
Export potential enables firms to identify high-growth global markets with greater confidence by combining advanced trade intelligence with a structured quantitative methodology. The framework analyzes emerging demand trends and country-level import patterns while integrating macroeconomic and trade datasets such as GDP and population forecasts, bilateral import–export flows, tariff structures, elasticity differentials between developed and developing economies, geographic distance, and import demand projections. Using weighted trade values from 2020–2024 as the base period to project country-to-country export potential for 2030, these inputs are operationalized through calculated drivers such as gravity model parameters, tariff impact factors, and projected GDP per-capita growth. Through an analysis of hidden potentials, demand hotspots, and market conditions that are most favorable to success, this method enables firms to focus on target countries, maximize returns, and global expansion with data, backed by accuracy.
By factoring in the projected importer demand gap that is currently unmet and could be potential opportunity, it identifies the potential for the Exporter (Country) among 190 countries, against the general trade analysis, which identifies the biggest importer or exporter.
To discover high-growth global markets and optimize your business strategy:
Click Here
Pricing
- Single User License$ 1,995
- Department License$ 2,400
- Site License$ 3,120
- Global License$ 3,795

Leadership Perspectives from Industry Events
Search
Thought Leadership and Analyst Meet


Our Clients
6WResearch In News
- Doha a strategic location for EV manufacturing hub: IPA Qatar
- Demand for luxury TVs surging in the GCC, says Samsung
- Empowering Growth: The Thriving Journey of Bangladesh’s Cable Industry
- Demand for luxury TVs surging in the GCC, says Samsung
- Video call with a traditional healer? Once unthinkable, it’s now common in South Africa
- Intelligent Buildings To Smooth GCC’s Path To Net Zero
Latest Reports
- Cape Verde Portable Hand-Thrown Extinguisher Market (2026-2032)
- Canada Portable Hand-Thrown Extinguisher Market (2026-2032)
- Cameroon Portable Hand-Thrown Extinguisher Market (2026-2032)
- Burundi Portable Hand-Thrown Extinguisher Market (2026-2032)
- Burkina Faso Portable Hand-Thrown Extinguisher Market (2026-2032)
- Bulgaria Portable Hand-Thrown Extinguisher Market (2026-2032)
- Brunei Portable Hand-Thrown Extinguisher Market (2026-2032)
- Botswana Portable Hand-Thrown Extinguisher Market (2026-2032)
- Bosnia and Herzegovina Portable Hand-Thrown Extinguisher Market (2026-2032)
- Bolivia Portable Hand-Thrown Extinguisher Market (2026-2032)
Industry Events and Analyst Meet

HIMTEX 2026

India Refining Summit 2026

India EV Show 2026

EV tech India Expo 2026

Auto Tech Asia 2026
Whitepaper
- Middle East & Africa Commercial Security Market Click here to view more.
- Middle East & Africa Fire Safety Systems & Equipment Market Click here to view more.
- GCC Drone Market Click here to view more.
- Middle East Lighting Fixture Market Click here to view more.
- GCC Physical & Perimeter Security Market Click here to view more.