Greece Twine Market (2026-2032) | Revenue, Companies, Value, Analysis, Growth, Segmentation, Size, Outlook, Industry, Forecast, Trends & Share
Market Forecast By Type (Polyethylene Rope Twine, Metal Rope Twine, Other), By Applications (Industrial, Construction, Oil, Coal mine, Other) And Competitive Landscape
| Product Code: ETC5821562 | Publication Date: Nov 2023 | Updated Date: Apr 2026 | Product Type: Market Research Report | |
| Publisher: 6Wresearch | Author: Ravi Bhandari | No. of Pages: 60 | No. of Figures: 30 | No. of Tables: 5 |
Greece Twine Market Size (2020-2030)
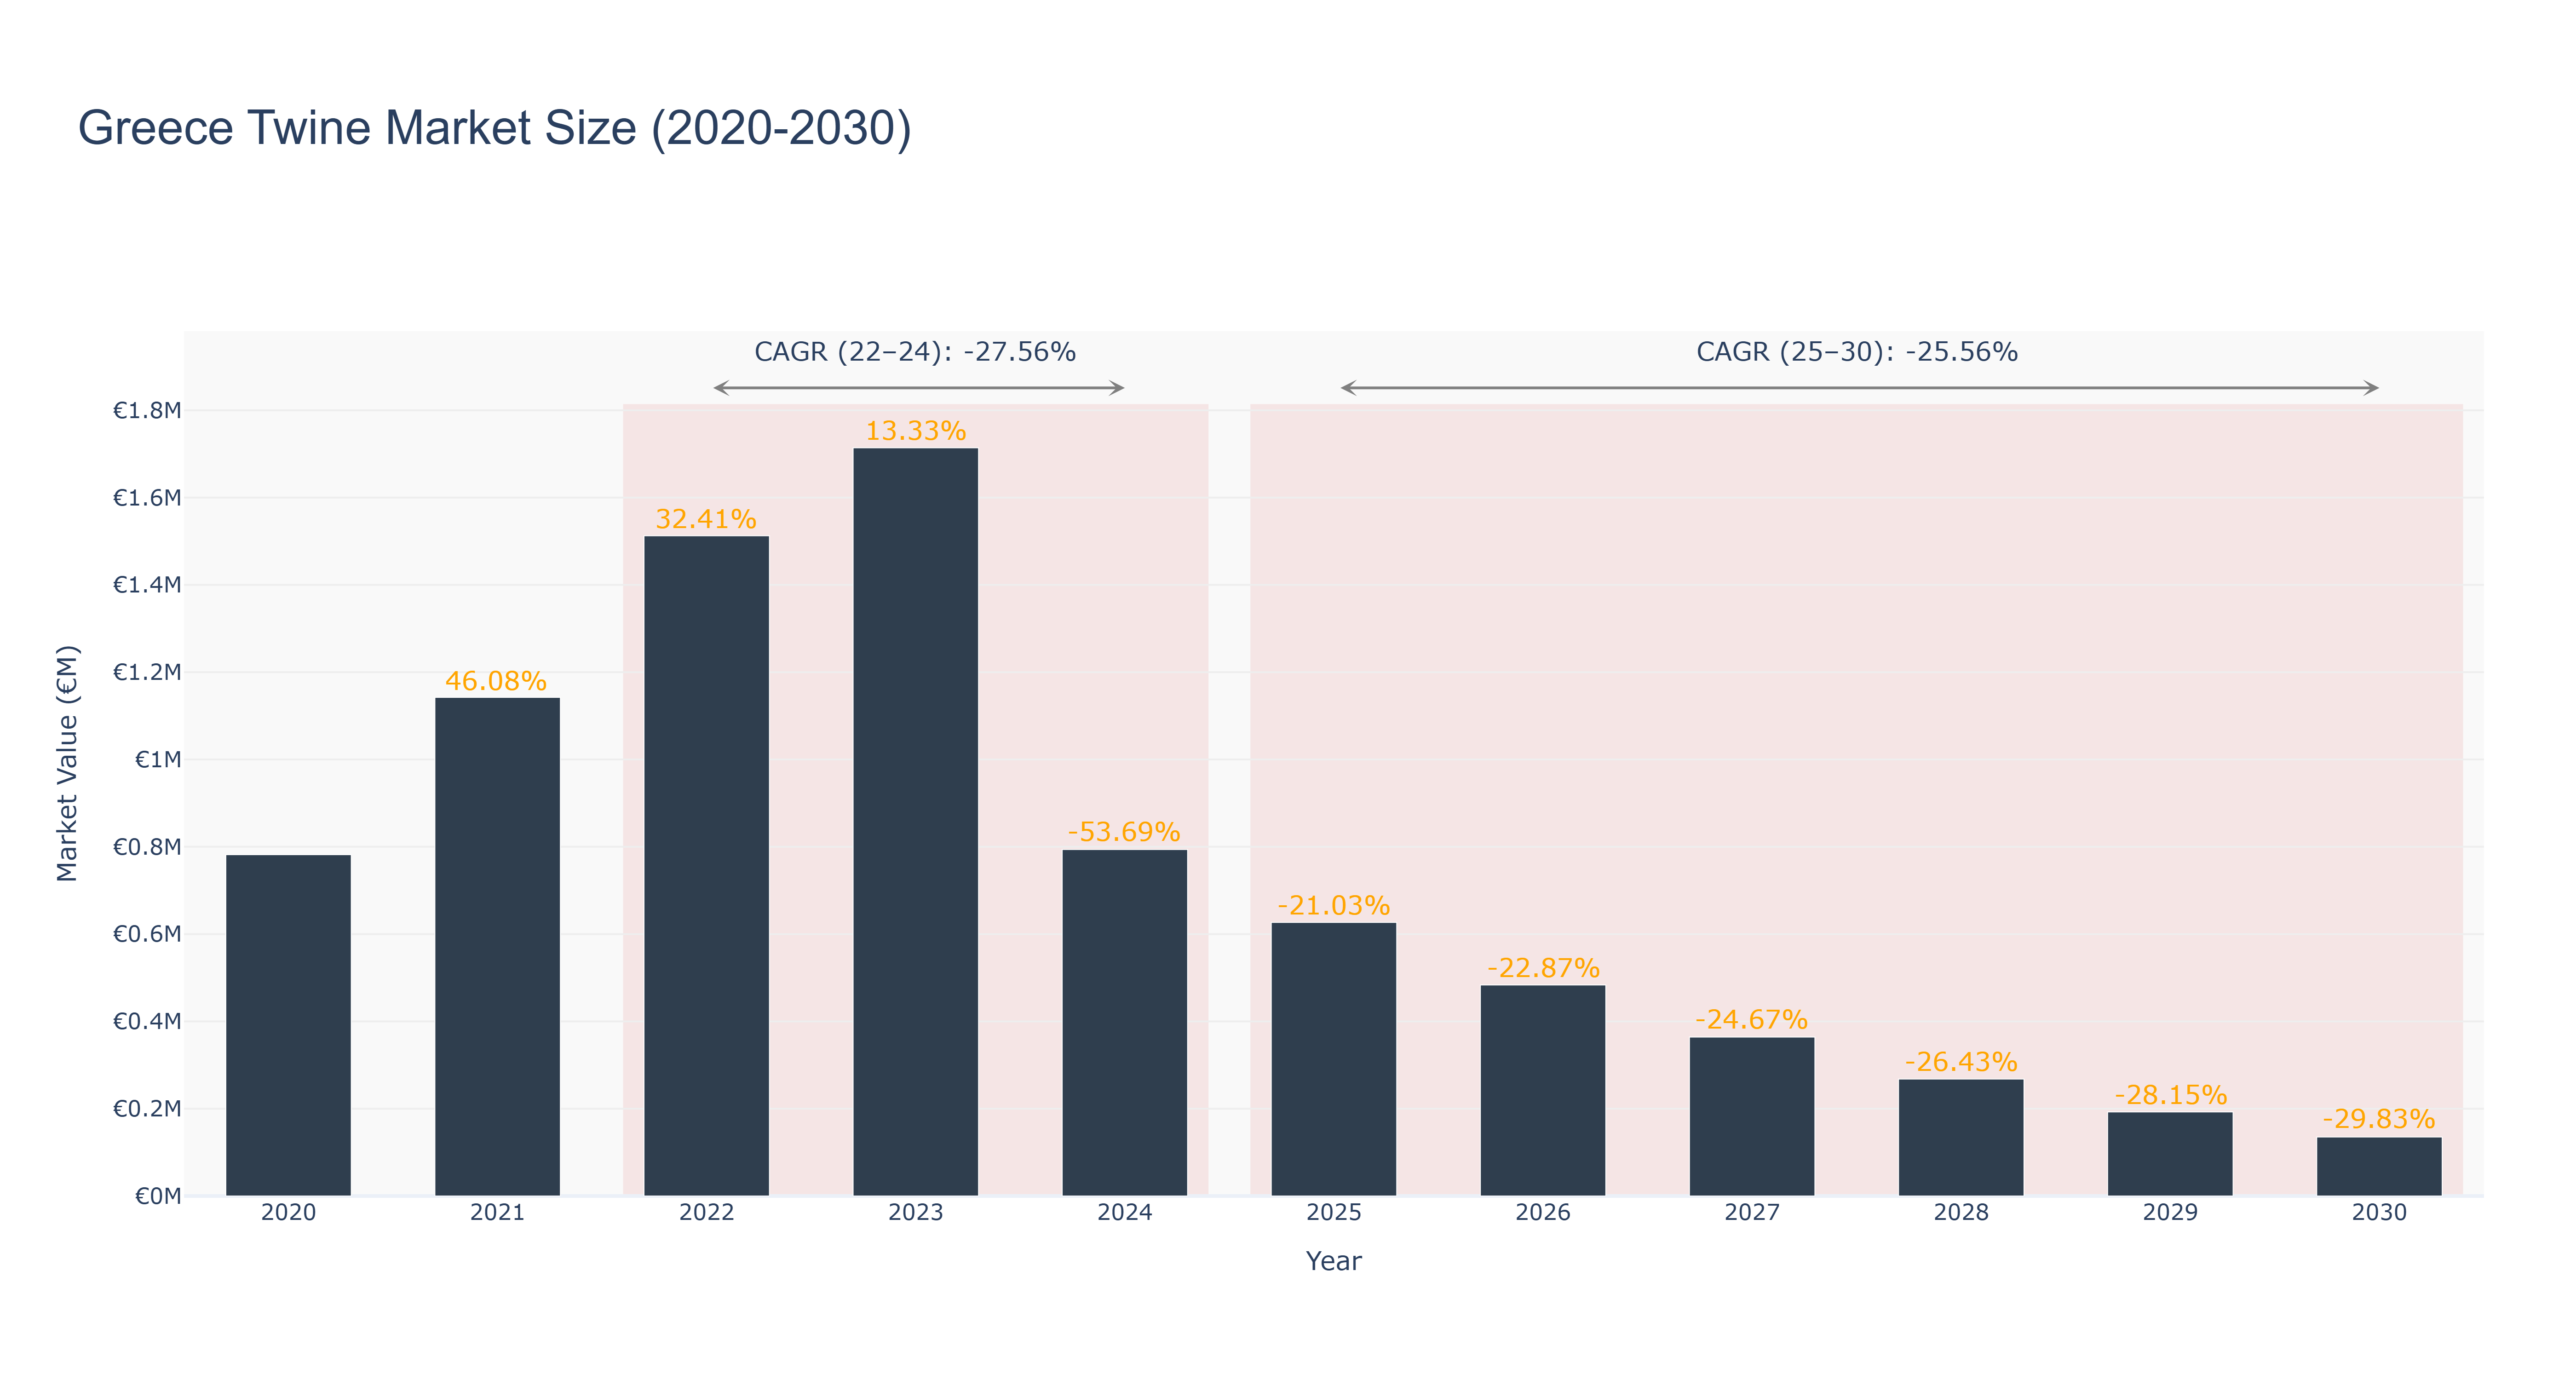
The Greece Twine Market experienced a peak market size of €1.71 million in 2023, followed by a significant decline to €0.79 million in 2024. The market continued to shrink, reaching €0.48 million in 2026. The downward trend can be attributed to various factors such as economic instability, changing consumer preferences, and increased competition. The forecasted market size from 2025 to 2030 is expected to further decrease, with a CAGR of -25.56% from 2025 to 2030. Despite the challenging market conditions, recent developments indicate a shift towards sustainable production practices and the introduction of innovative twine materials. These initiatives aim to revitalize the market and cater to evolving environmental regulations and consumer demands. Industry drivers influencing the market include cost-effective solutions, technological advancements in twine production, and a focus on sustainability. These factors will play a crucial role in shaping the future landscape of the Greece Twine Market, driving innovation and market growth.
Greece Twine Market: Production & Trade Performance (2019-2025)
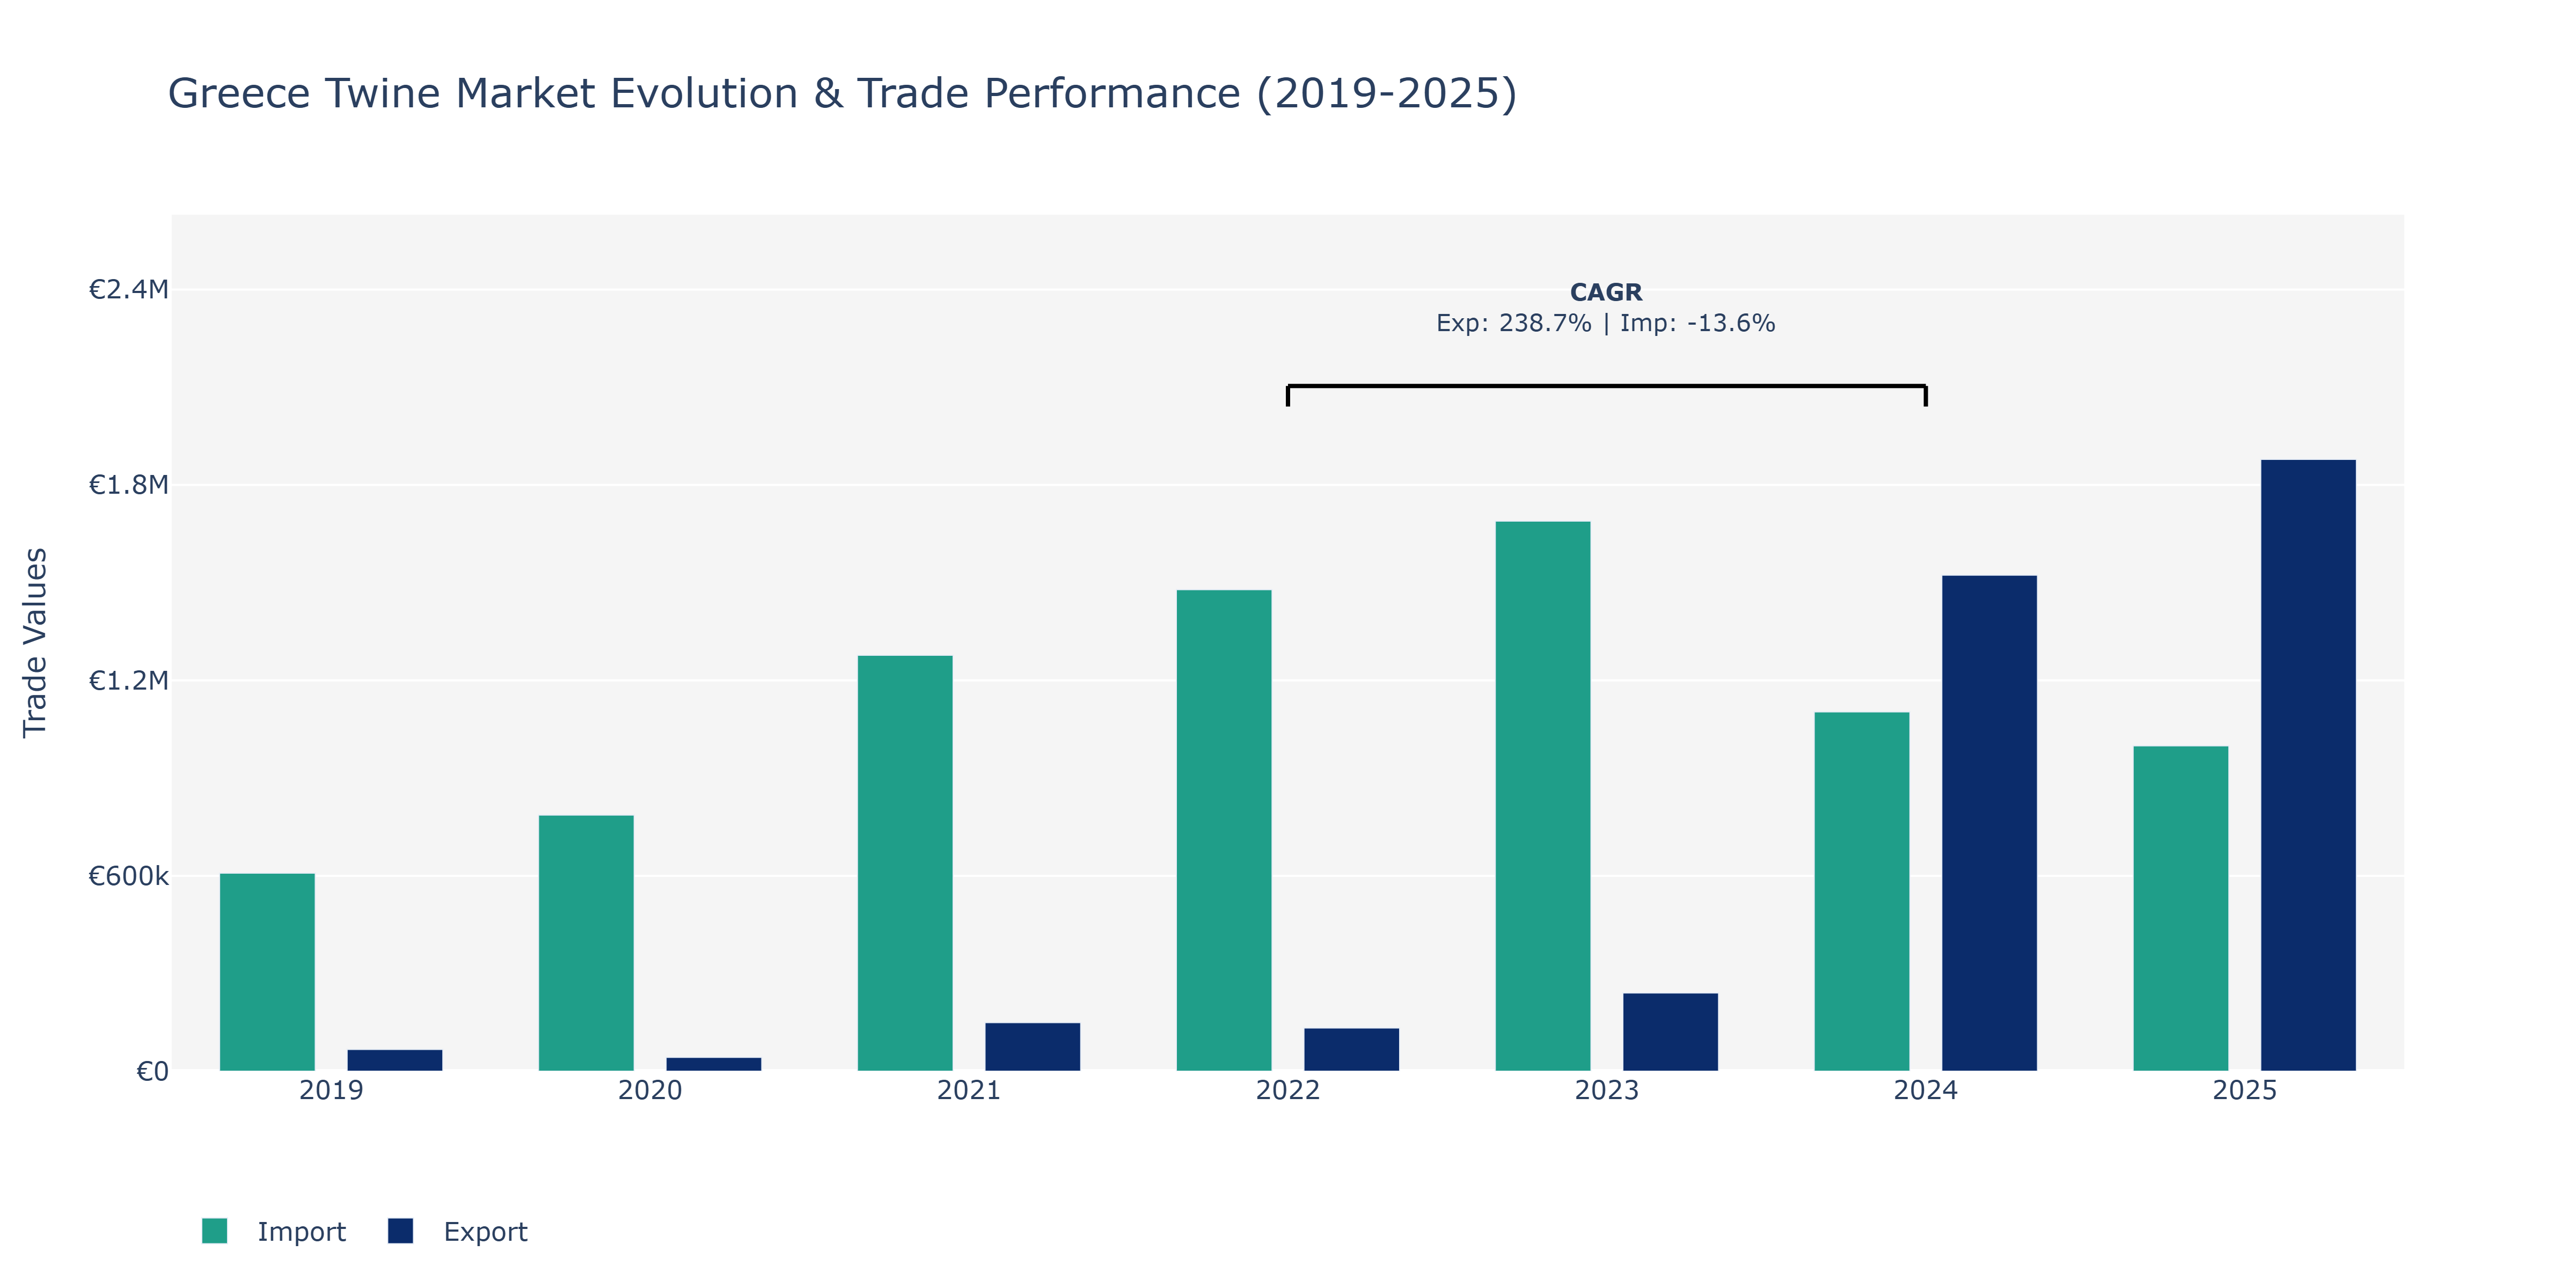
The Greece Twine Market experienced notable fluctuations in both exports and imports over the analyzed period. In 2019, exports stood at €66.83 thousand while imports were significantly higher at €607.96 thousand. The subsequent year, exports dropped to €42.51 thousand, contrasting with a surge in imports to €786.34 thousand. In 2021, both exports and imports showed a substantial increase, reaching €149.15 thousand and €1.28 million, respectively. The trend continued in 2022 with exports at €132.72 thousand and imports at €1.48 million. However, a significant surge was observed in 2023, with exports skyrocketing to €240.28 thousand and imports totaling €1.69 million. By 2024, exports peaked at a substantial €1.52 million, while imports saw a decrease to €1.1 million. This shift in trade balances could be attributed to changes in global demand for twine products, domestic production capacities, and evolving trade agreements impacting the market dynamics.
Key Highlights of the Report:
- Greece Twine Market Outlook
- Market Size of Greece Twine Market, 2025
- Forecast of Greece Twine Market, 2032
- Historical Data and Forecast of Greece Twine Revenues & Volume for the Period 2022-2032F
- Greece Twine Market Trend Evolution
- Greece Twine Market Drivers and Challenges
- Greece Twine Price Trends
- Greece Twine Porter`s Five Forces
- Greece Twine Industry Life Cycle
- Historical Data and Forecast of Greece Twine Market Revenues & Volume By Type for the Period 2022-2032F
- Historical Data and Forecast of Greece Twine Market Revenues & Volume By Polyethylene Rope Twine for the Period 2022-2032F
- Historical Data and Forecast of Greece Twine Market Revenues & Volume By Metal Rope Twine for the Period 2022-2032F
- Historical Data and Forecast of Greece Twine Market Revenues & Volume By Other for the Period 2022-2032F
- Historical Data and Forecast of Greece Twine Market Revenues & Volume By Applications for the Period 2022-2032F
- Historical Data and Forecast of Greece Twine Market Revenues & Volume By Industrial for the Period 2022-2032F
- Historical Data and Forecast of Greece Twine Market Revenues & Volume By Construction for the Period 2022-2032F
- Historical Data and Forecast of Greece Twine Market Revenues & Volume By Oil for the Period 2022-2032F
- Historical Data and Forecast of Greece Twine Market Revenues & Volume By Coal mine for the Period 2022-2032F
- Historical Data and Forecast of Greece Twine Market Revenues & Volume By Other for the Period 2022-2032F
- Greece Twine Import Export Trade Statistics
- Market Opportunity Assessment By Type
- Market Opportunity Assessment By Applications
- Greece Twine Top Companies Market Share
- Greece Twine Competitive Benchmarking By Technical and Operational Parameters
- Greece Twine Company Profiles
- Greece Twine Key Strategic Recommendations
Frequently Asked Questions About the Market Study (FAQs):
6Wresearch actively monitors the Greece Twine Market and publishes its comprehensive annual report, highlighting emerging trends, growth drivers, revenue analysis, and forecast outlook. Our insights help businesses to make data-backed strategic decisions with ongoing market dynamics. Our analysts track relevent industries related to the Greece Twine Market, allowing our clients with actionable intelligence and reliable forecasts tailored to emerging regional needs.
Yes, we provide customisation as per your requirements. To learn more, feel free to contact us on sales@6wresearch.com
1 Executive Summary |
2 Introduction |
2.1 Key Highlights of the Report |
2.2 Report Description |
2.3 Market Scope & Segmentation |
2.4 Research Methodology |
2.5 Assumptions |
3 Greece Twine Market Overview |
3.1 Greece Country Macro Economic Indicators |
3.2 Greece Twine Market Revenues & Volume, 2022 & 2032F |
3.3 Greece Twine Market - Industry Life Cycle |
3.4 Greece Twine Market - Porter's Five Forces |
3.5 Greece Twine Market Revenues & Volume Share, By Type, 2022 & 2032F |
3.6 Greece Twine Market Revenues & Volume Share, By Applications, 2022 & 2032F |
4 Greece Twine Market Dynamics |
4.1 Impact Analysis |
4.2 Market Drivers |
4.2.1 Growing demand for eco-friendly packaging solutions in various industries |
4.2.2 Increasing adoption of twine for agricultural applications in Greece |
4.2.3 Rising trend of DIY and crafting activities driving demand for twine products |
4.3 Market Restraints |
4.3.1 Fluctuations in raw material prices impacting production costs |
4.3.2 Competition from substitute products like plastic ropes and wires in certain applications |
5 Greece Twine Market Trends |
6 Greece Twine Market Segmentations |
6.1 Greece Twine Market, By Type |
6.1.1 Overview and Analysis |
6.1.2 Greece Twine Market Revenues & Volume, By Polyethylene Rope Twine, 2022-2032F |
6.1.3 Greece Twine Market Revenues & Volume, By Metal Rope Twine, 2022-2032F |
6.1.4 Greece Twine Market Revenues & Volume, By Other, 2022-2032F |
6.2 Greece Twine Market, By Applications |
6.2.1 Overview and Analysis |
6.2.2 Greece Twine Market Revenues & Volume, By Industrial, 2022-2032F |
6.2.3 Greece Twine Market Revenues & Volume, By Construction, 2022-2032F |
6.2.4 Greece Twine Market Revenues & Volume, By Oil, 2022-2032F |
6.2.5 Greece Twine Market Revenues & Volume, By Coal mine, 2022-2032F |
6.2.6 Greece Twine Market Revenues & Volume, By Other, 2022-2032F |
7 Greece Twine Market Import-Export Trade Statistics |
7.1 Greece Twine Market Export to Major Countries |
7.2 Greece Twine Market Imports from Major Countries |
8 Greece Twine Market Key Performance Indicators |
8.1 Percentage increase in demand for eco-friendly packaging solutions in Greece |
8.2 Growth rate of the agricultural sector in Greece |
8.3 Number of DIY and crafting events or workshops in the country |
8.4 Innovation rate in twine manufacturing technologies |
8.5 Sustainability initiatives adopted by twine manufacturers in Greece |
9 Greece Twine Market - Opportunity Assessment |
9.1 Greece Twine Market Opportunity Assessment, By Type, 2022 & 2032F |
9.2 Greece Twine Market Opportunity Assessment, By Applications, 2022 & 2032F |
10 Greece Twine Market - Competitive Landscape |
10.1 Greece Twine Market Revenue Share, By Companies, 2025 |
10.2 Greece Twine Market Competitive Benchmarking, By Operating and Technical Parameters |
11 Company Profiles |
12 Recommendations | 13 Disclaimer |
Global Go To Market Strategy - 2030
Export potential enables firms to identify high-growth global markets with greater confidence by combining advanced trade intelligence with a structured quantitative methodology. The framework analyzes emerging demand trends and country-level import patterns while integrating macroeconomic and trade datasets such as GDP and population forecasts, bilateral import–export flows, tariff structures, elasticity differentials between developed and developing economies, geographic distance, and import demand projections. Using weighted trade values from 2020–2024 as the base period to project country-to-country export potential for 2030, these inputs are operationalized through calculated drivers such as gravity model parameters, tariff impact factors, and projected GDP per-capita growth. Through an analysis of hidden potentials, demand hotspots, and market conditions that are most favorable to success, this method enables firms to focus on target countries, maximize returns, and global expansion with data, backed by accuracy.
By factoring in the projected importer demand gap that is currently unmet and could be potential opportunity, it identifies the potential for the Exporter (Country) among 190 countries, against the general trade analysis, which identifies the biggest importer or exporter.
To discover high-growth global markets and optimize your business strategy:
Click Here
Pricing
- Single User License$ 1,995
- Department License$ 2,400
- Site License$ 3,120
- Global License$ 3,795

Leadership Perspectives from Industry Events
Search
Thought Leadership and Analyst Meet


Our Clients
6WResearch In News
- India Export Attractiveness Tracker 2026
- India Air Conditioner Market Set for Strong Rebound in 2026 After Weather-Led Correction and GST-Driven Recovery: 6Wresearch
- ADAS in India: How Automatic Emergency Braking, Blind Spot Detection & Driver Monitoring are Transforming Road Safety
- Doha a strategic location for EV manufacturing hub: IPA Qatar
- Demand for luxury TVs surging in the GCC, says Samsung
- Empowering Growth: The Thriving Journey of Bangladesh’s Cable Industry
Latest Reports
- Qatar Access and Home Network Market (2026-2032)
- Nicaragua RPG Gaming Market (2026-2032)
- New Zealand RPG Gaming Market (2026-2032)
- Netherlands RPG Gaming Market (2026-2032)
- Nauru RPG Gaming Market (2026-2032)
- Namibia RPG Gaming Market (2026-2032)
- Mozambique RPG Gaming Market (2026-2032)
- Montenegro RPG Gaming Market (2026-2032)
- Mongolia RPG Gaming Market (2026-2032)
- Monaco RPG Gaming Market (2026-2032)
Industry Events and Analyst Meet

EV India Expo 2026

HIMTEX 2026

India Refining Summit 2026

India EV Show 2026

EV tech India Expo 2026
Whitepaper
- Middle East & Africa Commercial Security Market Click here to view more.
- Middle East & Africa Fire Safety Systems & Equipment Market Click here to view more.
- GCC Drone Market Click here to view more.
- Middle East Lighting Fixture Market Click here to view more.
- GCC Physical & Perimeter Security Market Click here to view more.