Hungary Billiard Cues Market (2026-2032) Outlook | Size, Analysis, Trends, Growth, Forecast, Value, Industry, Revenue, Companies & Share
Market Forecast By Type (Snooker Cue, Nine Ball Cue, Others), By Applications (Club, Race, Family, Others) And Competitive Landscape
| Product Code: ETC228979 | Publication Date: Aug 2022 | Updated Date: Apr 2026 | Product Type: Market Research Report | |
| Publisher: 6Wresearch | Author: Ravi Bhandari | No. of Pages: 75 | No. of Figures: 35 | No. of Tables: 20 |
Hungary Billiard Cues Market Size (2020-2030)
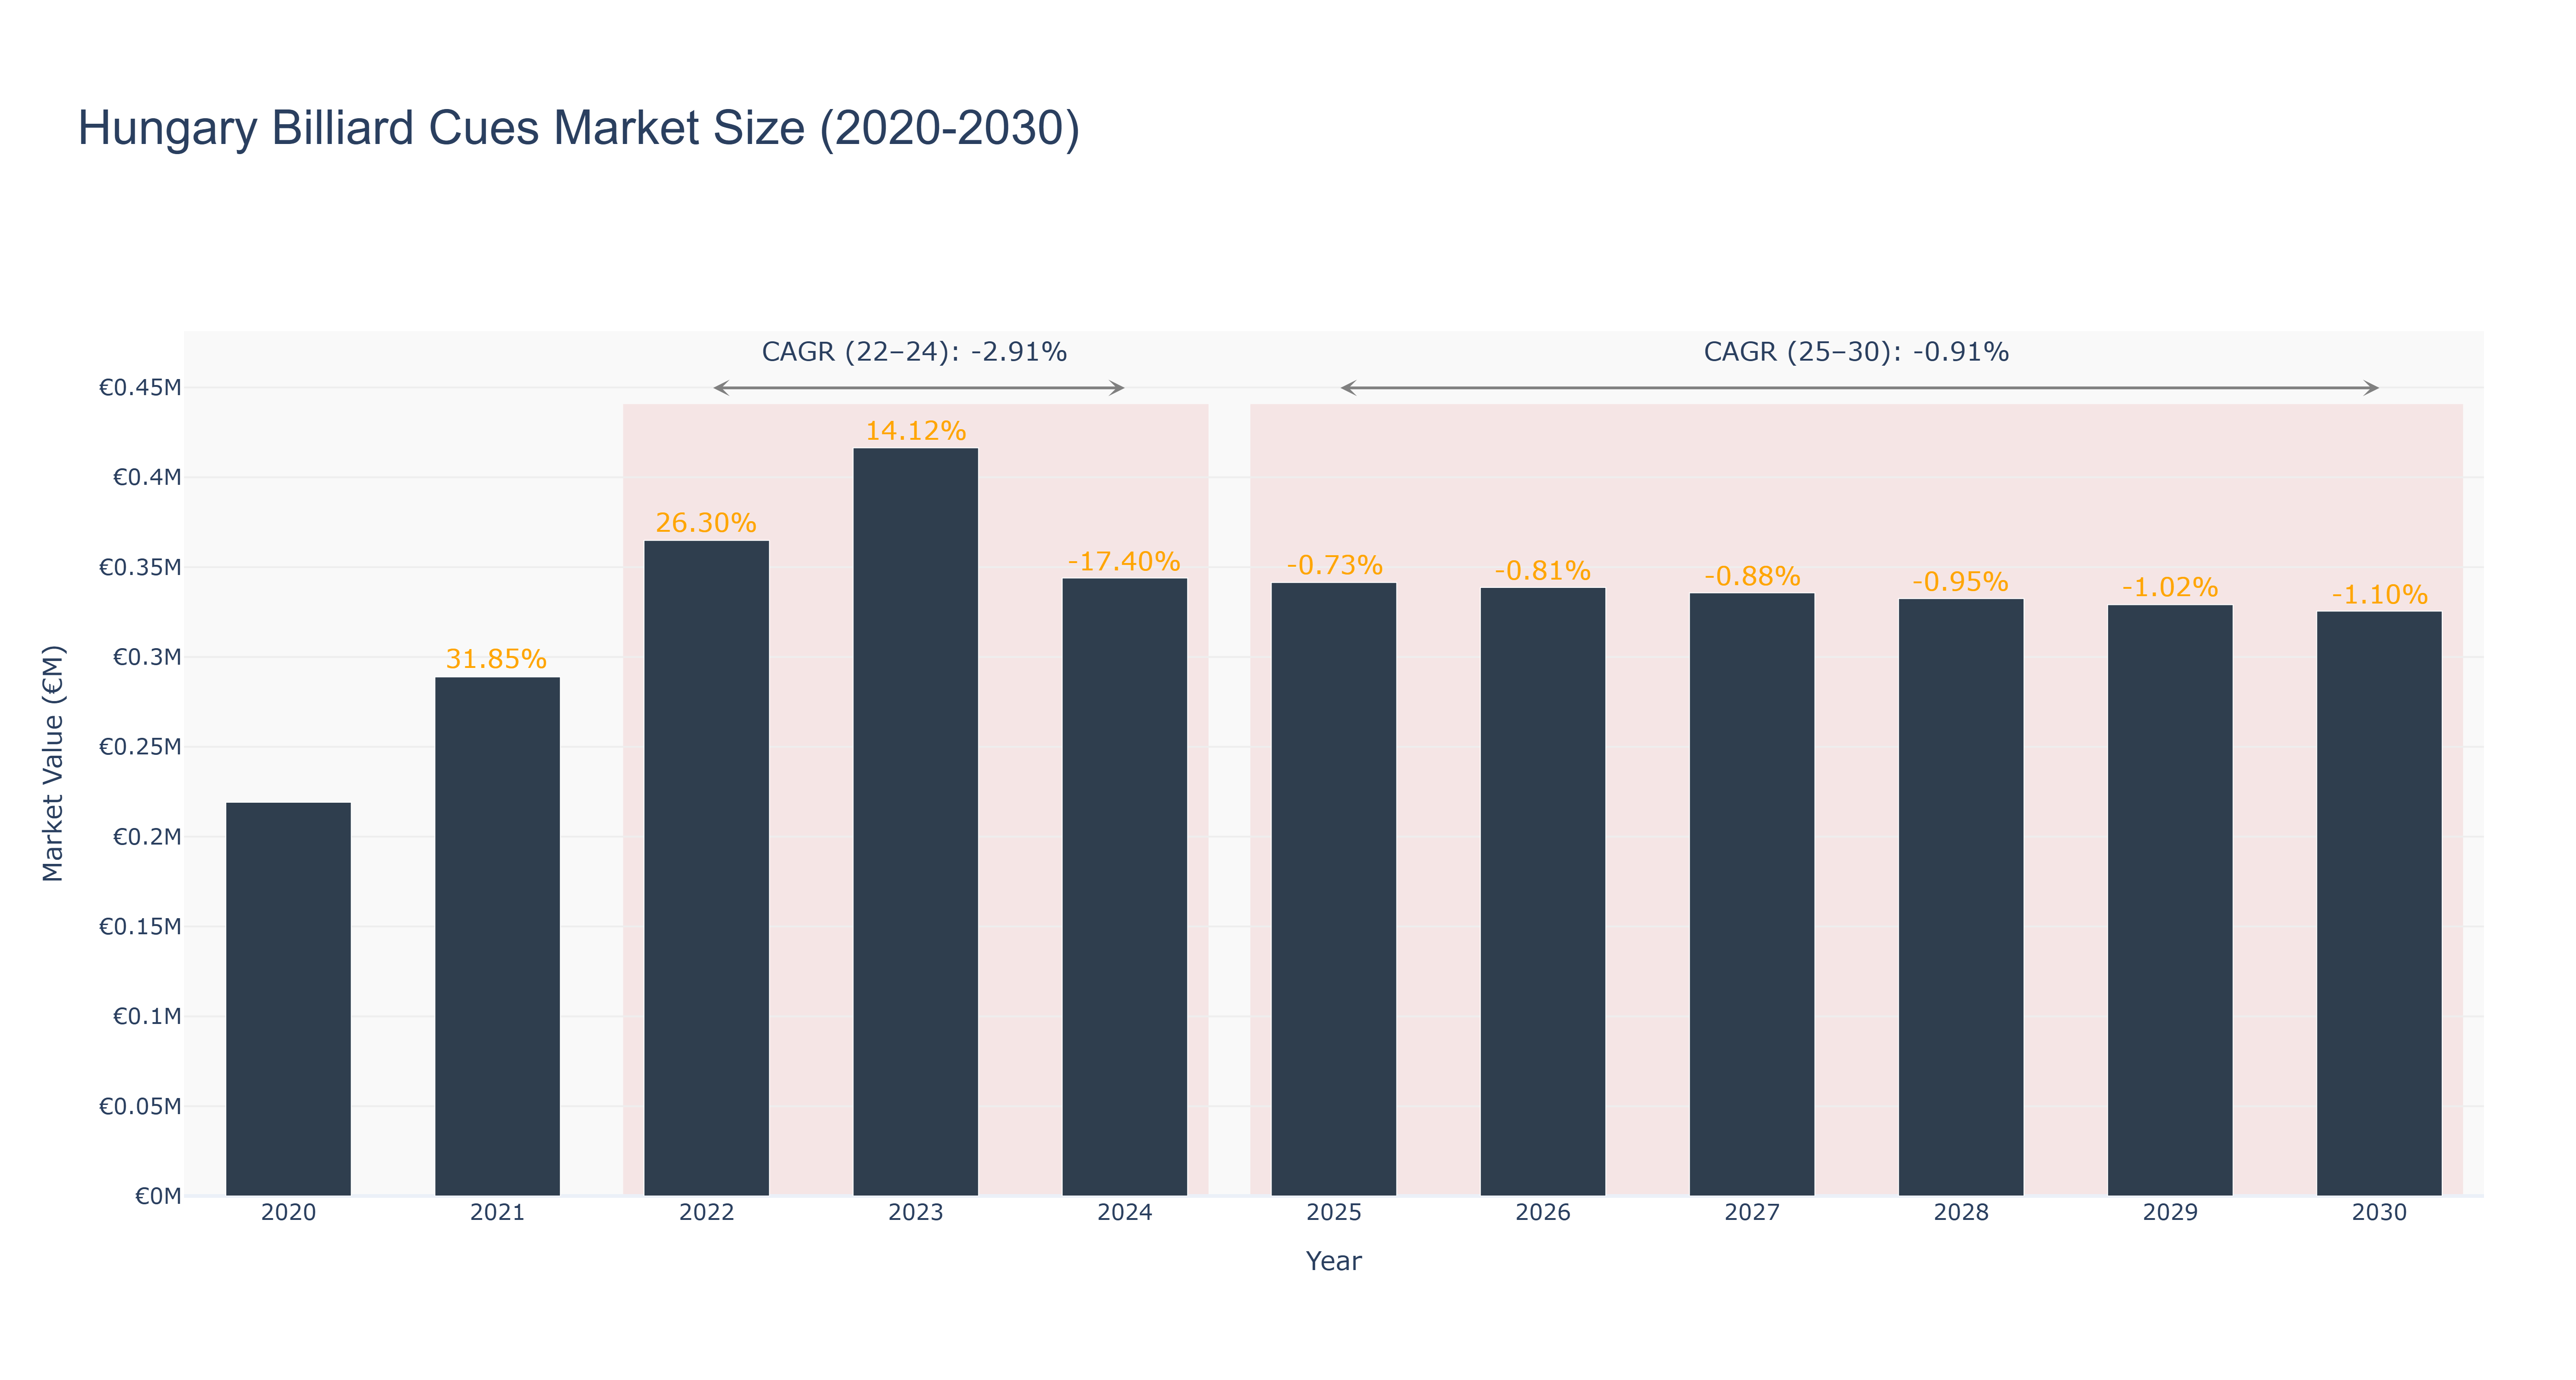
Hungary's Billiard Cues Market experienced a peak in 2023 with a market size of €0.42 million, followed by a decline to €0.34 million in 2024. The market is forecasted to remain stable around €0.33 million from 2025 to 2030, with a negative CAGR of -0.91% between 2025-30. The market's recent downturn can be attributed to decreasing consumer interest and saturation in the billiard cues segment. However, with the growing popularity of online billiards platforms and the increasing focus on customization and innovation in cue designs, the market is expected to witness a gradual recovery in the coming years. Hungary's Billiard Cues Market is set to see new investments in digital marketing strategies and product diversification, aiming to attract a younger demographic and boost overall market demand.
Hungary Billiard Cues Market: Production & Trade Performance (2019-2025)
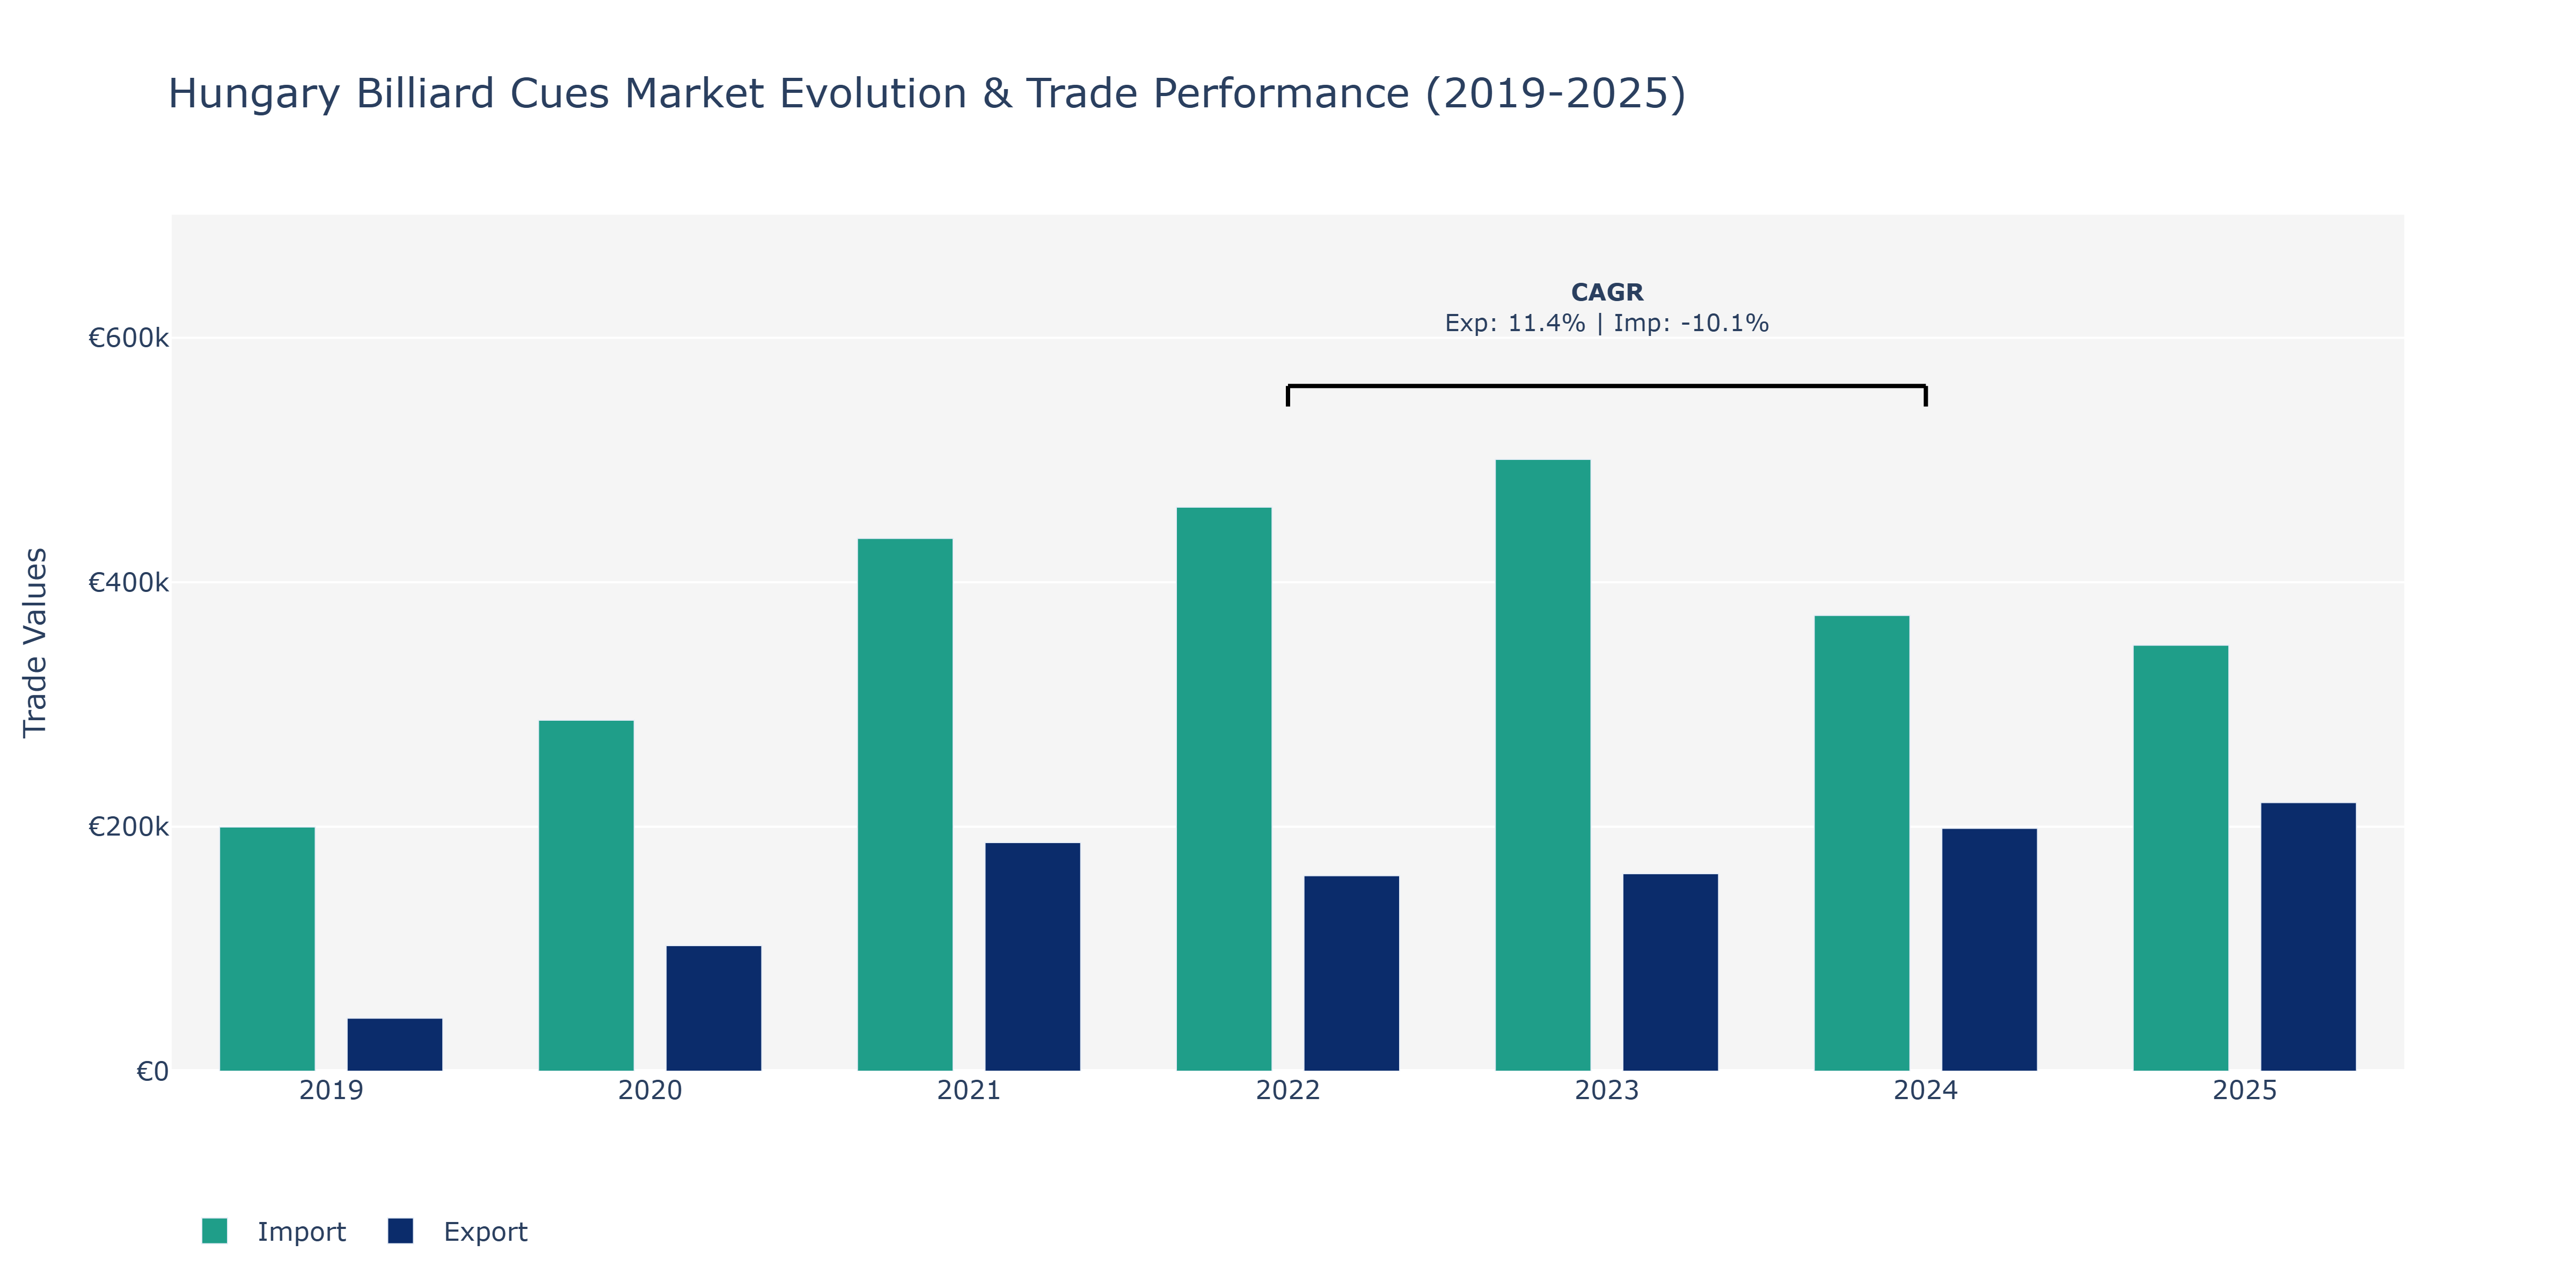
Between 2019 and 2025, Hungary's Billiard Cues Market saw significant fluctuations in both exports and imports. Exports experienced steady growth, starting at €43.31 thousand in 2019 and peaking at €219.82 thousand in 2025, showcasing a consistent upward trend. On the other hand, imports demonstrated a more volatile pattern, reaching their highest point of €500.58 thousand in 2023 before decreasing to €348.58 thousand in 2025. This decline in imports could be attributed to various factors such as changes in consumer preferences, fluctuations in currency exchange rates affecting import costs, or shifts in global trade dynamics impacting the sourcing of billiard cues. Despite the decline in imports, the market maintained a positive export trend, possibly driven by the quality and competitiveness of Hungary's billiard cue products in the international market. The contrasting trends in exports and imports highlight the market's resilience and adaptability to external economic factors, emphasizing the importance of strategic planning and market positioning for sustained growth.
Key Highlights of the Report:
- Hungary Billiard Cues Market Outlook
- Market Size of Hungary Billiard Cues Market, 2025
- Forecast of Hungary Billiard Cues Market, 2032
- Historical Data and Forecast of Hungary Billiard Cues Revenues & Volume for the Period 2022-2032F
- Hungary Billiard Cues Market Trend Evolution
- Hungary Billiard Cues Market Drivers and Challenges
- Hungary Billiard Cues Price Trends
- Hungary Billiard Cues Porter's Five Forces
- Hungary Billiard Cues Industry Life Cycle
- Historical Data and Forecast of Hungary Billiard Cues Market Revenues & Volume By Type for the Period 2022-2032F
- Historical Data and Forecast of Hungary Billiard Cues Market Revenues & Volume By Snooker Cue for the Period 2022-2032F
- Historical Data and Forecast of Hungary Billiard Cues Market Revenues & Volume By Nine Ball Cue for the Period 2022-2032F
- Historical Data and Forecast of Hungary Billiard Cues Market Revenues & Volume By Others for the Period 2022-2032F
- Historical Data and Forecast of Hungary Billiard Cues Market Revenues & Volume By Applications for the Period 2022-2032F
- Historical Data and Forecast of Hungary Billiard Cues Market Revenues & Volume By Club for the Period 2022-2032F
- Historical Data and Forecast of Hungary Billiard Cues Market Revenues & Volume By Race for the Period 2022-2032F
- Historical Data and Forecast of Hungary Billiard Cues Market Revenues & Volume By Family for the Period 2022-2032F
- Historical Data and Forecast of Hungary Billiard Cues Market Revenues & Volume By Others for the Period 2022-2032F
- Hungary Billiard Cues Import Export Trade Statistics
- Market Opportunity Assessment By Type
- Market Opportunity Assessment By Applications
- Hungary Billiard Cues Top Companies Market Share
- Hungary Billiard Cues Competitive Benchmarking By Technical and Operational Parameters
- Hungary Billiard Cues Company Profiles
- Hungary Billiard Cues Key Strategic Recommendations
Frequently Asked Questions About the Market Study (FAQs):
6Wresearch actively monitors the Hungary Billiard Cues Market and publishes its comprehensive annual report, highlighting emerging trends, growth drivers, revenue analysis, and forecast outlook. Our insights help businesses to make data-backed strategic decisions with ongoing market dynamics. Our analysts track relevent industries related to the Hungary Billiard Cues Market, allowing our clients with actionable intelligence and reliable forecasts tailored to emerging regional needs.
Yes, we provide customisation as per your requirements. To learn more, feel free to contact us on sales@6wresearch.com
1 Executive Summary |
2 Introduction |
2.1 Key Highlights of the Report |
2.2 Report Description |
2.3 Market Scope & Segmentation |
2.4 Research Methodology |
2.5 Assumptions |
3 Hungary Billiard Cues Market Overview |
3.1 Hungary Country Macro Economic Indicators |
3.2 Hungary Billiard Cues Market Revenues & Volume, 2022 & 2032F |
3.3 Hungary Billiard Cues Market - Industry Life Cycle |
3.4 Hungary Billiard Cues Market - Porter's Five Forces |
3.5 Hungary Billiard Cues Market Revenues & Volume Share, By Type, 2022 & 2032F |
3.6 Hungary Billiard Cues Market Revenues & Volume Share, By Applications, 2022 & 2032F |
4 Hungary Billiard Cues Market Dynamics |
4.1 Impact Analysis |
4.2 Market Drivers |
4.2.1 Growing popularity of billiards as a leisure activity in Hungary |
4.2.2 Increasing disposable income leading to higher spending on recreational products |
4.2.3 Rising focus on home entertainment and indoor activities |
4.2.4 Innovation in billiard cue technology and materials |
4.3 Market Restraints |
4.3.1 Seasonal nature of billiards as an activity, impacting cue sales during certain times of the year |
4.3.2 Competition from alternative recreational activities |
4.3.3 Economic downturn affecting consumer spending on non-essential items like billiard cues |
5 Hungary Billiard Cues Market Trends |
6 Hungary Billiard Cues Market, By Types |
6.1 Hungary Billiard Cues Market, By Type |
6.1.1 Overview and Analysis |
6.1.2 Hungary Billiard Cues Market Revenues & Volume, By Type, 2022 - 2032F |
6.1.3 Hungary Billiard Cues Market Revenues & Volume, By Snooker Cue, 2022 - 2032F |
6.1.4 Hungary Billiard Cues Market Revenues & Volume, By Nine Ball Cue, 2022 - 2032F |
6.1.5 Hungary Billiard Cues Market Revenues & Volume, By Others, 2022 - 2032F |
6.2 Hungary Billiard Cues Market, By Applications |
6.2.1 Overview and Analysis |
6.2.2 Hungary Billiard Cues Market Revenues & Volume, By Club, 2022 - 2032F |
6.2.3 Hungary Billiard Cues Market Revenues & Volume, By Race, 2022 - 2032F |
6.2.4 Hungary Billiard Cues Market Revenues & Volume, By Family, 2022 - 2032F |
6.2.5 Hungary Billiard Cues Market Revenues & Volume, By Others, 2022 - 2032F |
7 Hungary Billiard Cues Market Import-Export Trade Statistics |
7.1 Hungary Billiard Cues Market Export to Major Countries |
7.2 Hungary Billiard Cues Market Imports from Major Countries |
8 Hungary Billiard Cues Market Key Performance Indicators |
8.1 Average number of billiard clubs or venues in Hungary |
8.2 Participation rates in billiards tournaments and events |
8.3 Number of billiard cue manufacturers or retailers in Hungary |
8.4 Frequency of billiard cue upgrades or replacements among consumers |
8.5 Adoption rate of advanced cue technologies in the Hungarian market |
9 Hungary Billiard Cues Market - Opportunity Assessment |
9.1 Hungary Billiard Cues Market Opportunity Assessment, By Type, 2022 & 2032F |
9.2 Hungary Billiard Cues Market Opportunity Assessment, By Applications, 2022 & 2032F |
10 Hungary Billiard Cues Market - Competitive Landscape |
10.1 Hungary Billiard Cues Market Revenue Share, By Companies, 2025 |
10.2 Hungary Billiard Cues Market Competitive Benchmarking, By Operating and Technical Parameters |
11 Company Profiles |
12 Recommendations |
13 Disclaimer |
Global Go To Market Strategy - 2030
Export potential enables firms to identify high-growth global markets with greater confidence by combining advanced trade intelligence with a structured quantitative methodology. The framework analyzes emerging demand trends and country-level import patterns while integrating macroeconomic and trade datasets such as GDP and population forecasts, bilateral import–export flows, tariff structures, elasticity differentials between developed and developing economies, geographic distance, and import demand projections. Using weighted trade values from 2020–2024 as the base period to project country-to-country export potential for 2030, these inputs are operationalized through calculated drivers such as gravity model parameters, tariff impact factors, and projected GDP per-capita growth. Through an analysis of hidden potentials, demand hotspots, and market conditions that are most favorable to success, this method enables firms to focus on target countries, maximize returns, and global expansion with data, backed by accuracy.
By factoring in the projected importer demand gap that is currently unmet and could be potential opportunity, it identifies the potential for the Exporter (Country) among 190 countries, against the general trade analysis, which identifies the biggest importer or exporter.
To discover high-growth global markets and optimize your business strategy:
Click Here
Pricing
- Single User License$ 1,995
- Department License$ 2,400
- Site License$ 3,120
- Global License$ 3,795

Leadership Perspectives from Industry Events
Search
Thought Leadership and Analyst Meet


Our Clients
6WResearch In News
- India Air Conditioner Market Set for Strong Rebound in 2026 After Weather-Led Correction and GST-Driven Recovery: 6Wresearch
- ADAS in India: How Automatic Emergency Braking, Blind Spot Detection & Driver Monitoring are Transforming Road Safety
- Doha a strategic location for EV manufacturing hub: IPA Qatar
- Demand for luxury TVs surging in the GCC, says Samsung
- Empowering Growth: The Thriving Journey of Bangladesh’s Cable Industry
- Demand for luxury TVs surging in the GCC, says Samsung
Latest Reports
- Poland Fire Protection Systems Market (2026-2032)
- Cape Verde Portable Hand-Thrown Extinguisher Market (2026-2032)
- Canada Portable Hand-Thrown Extinguisher Market (2026-2032)
- Cameroon Portable Hand-Thrown Extinguisher Market (2026-2032)
- Burundi Portable Hand-Thrown Extinguisher Market (2026-2032)
- Burkina Faso Portable Hand-Thrown Extinguisher Market (2026-2032)
- Bulgaria Portable Hand-Thrown Extinguisher Market (2026-2032)
- Brunei Portable Hand-Thrown Extinguisher Market (2026-2032)
- Botswana Portable Hand-Thrown Extinguisher Market (2026-2032)
- Bosnia and Herzegovina Portable Hand-Thrown Extinguisher Market (2026-2032)
Industry Events and Analyst Meet

HIMTEX 2026

India Refining Summit 2026

India EV Show 2026

EV tech India Expo 2026

Auto Tech Asia 2026
Whitepaper
- Middle East & Africa Commercial Security Market Click here to view more.
- Middle East & Africa Fire Safety Systems & Equipment Market Click here to view more.
- GCC Drone Market Click here to view more.
- Middle East Lighting Fixture Market Click here to view more.
- GCC Physical & Perimeter Security Market Click here to view more.