Hungary Bio Ethanol Market (2026-2032) | Restraints, Segmentation, Strategy, Trends, Opportunities, Industry, Analysis, Competitive, Companies, Strategic Insights, Competition, Demand, Forecast, Drivers, Supply, Growth, Consumer Insights, Investment Trends, Value, Pricing Analysis, Outlook, Size, Share, Segments, Challenges, Revenue
Market Forecast By Feedstock Type (Sugarcane, Corn, Cellulosic Biomass), By Application (Fuel, Power Generation, Industrial Processes), By End User (Automotive, Energy Producers, Industrial), By Technology (Fermentation, Distillation, Enzymatic Hydrolysis), By Sustainability Factor (Renewable, Low Emissions, Sustainable) And Competitive Landscape
| Product Code: ETC11459981 | Publication Date: Apr 2025 | Updated Date: Apr 2026 | Product Type: Market Research Report | |
| Publisher: 6Wresearch | No. of Pages: 65 | No. of Figures: 34 | No. of Tables: 19 | |
Hungary Bio Ethanol Market Size (2020-2030)
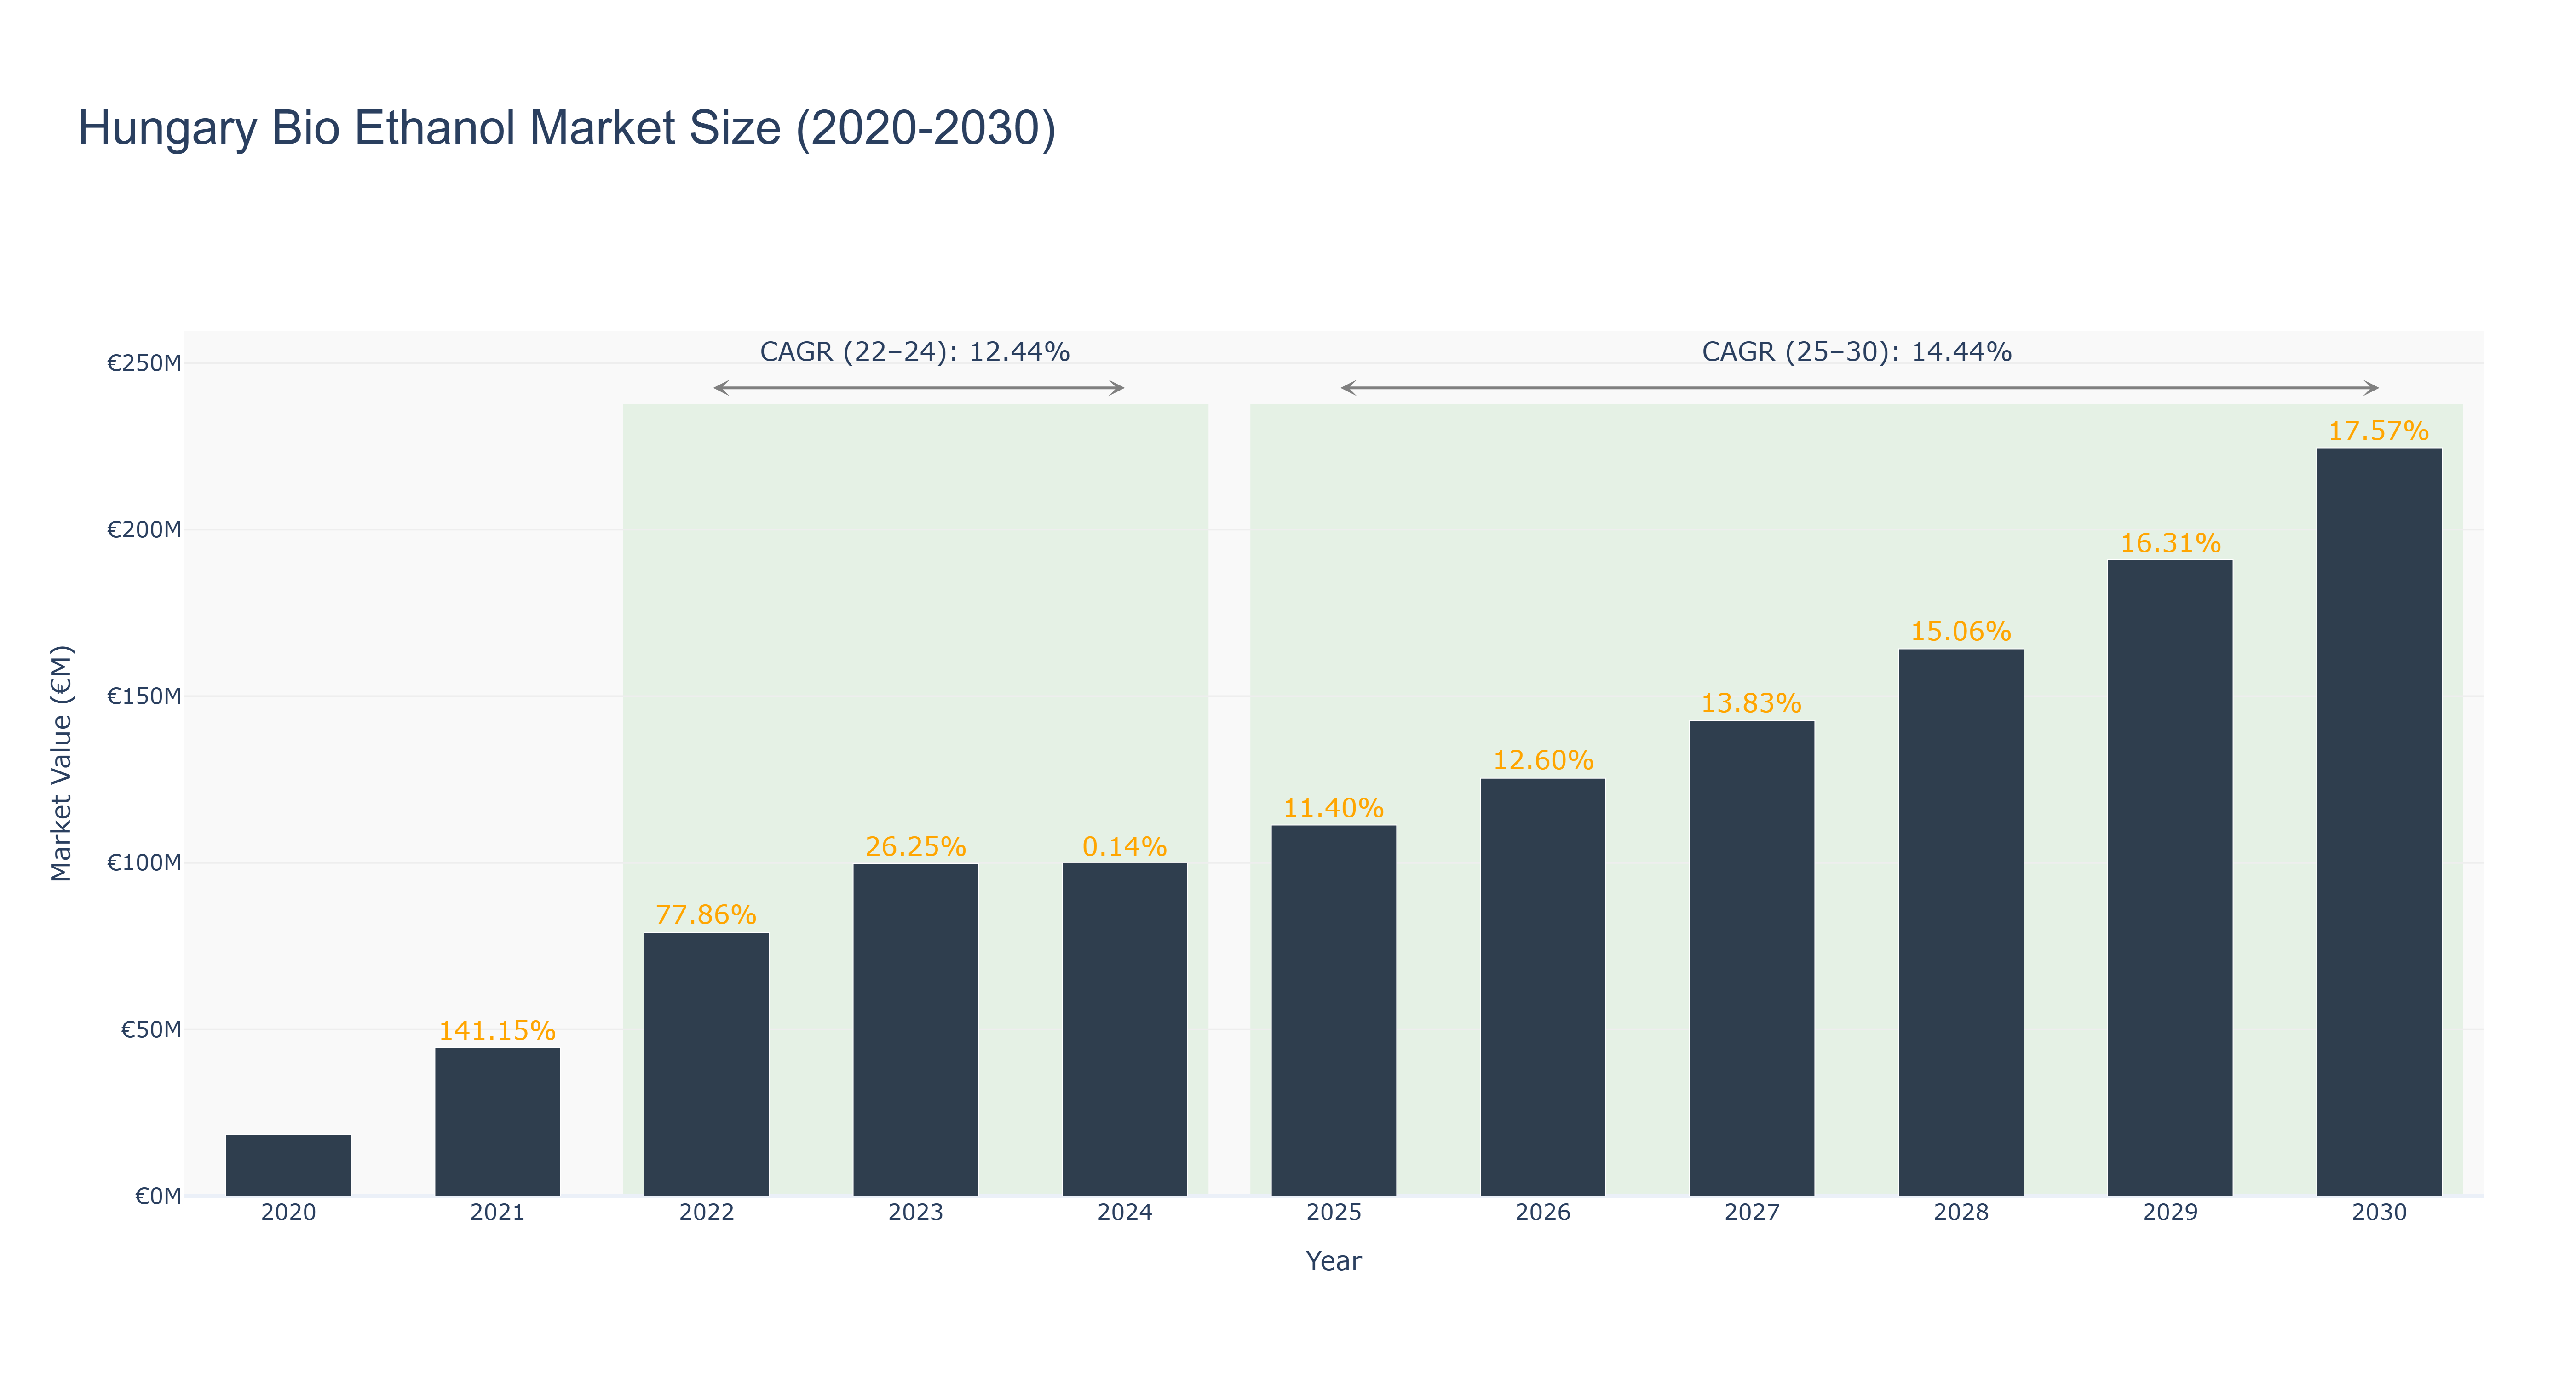
Hungary Bio Ethanol Market has shown a promising growth trajectory over the years. The market size peaked at €224.55 million in 2030, with a steady increase from €18.43 million in 2020. The actual market size saw significant growth from 2020 to 2024, followed by a forecasted upward trend from 2025 to 2030. The CAGR for the period 2022-24 was 12.44%, while for 2025-30 it is projected to be 14.44%. This growth can be attributed to increasing consumer awareness towards sustainable energy sources and government initiatives promoting biofuels. Recent developments in Hungary include investments in bioethanol production facilities and partnerships with agricultural stakeholders to ensure a stable supply chain. Moving forward, the market is expected to continue its growth trajectory with an emphasis on technological advancements and sustainability practices.
Hungary Bio Ethanol Market: Production & Trade Performance (2019-2025)
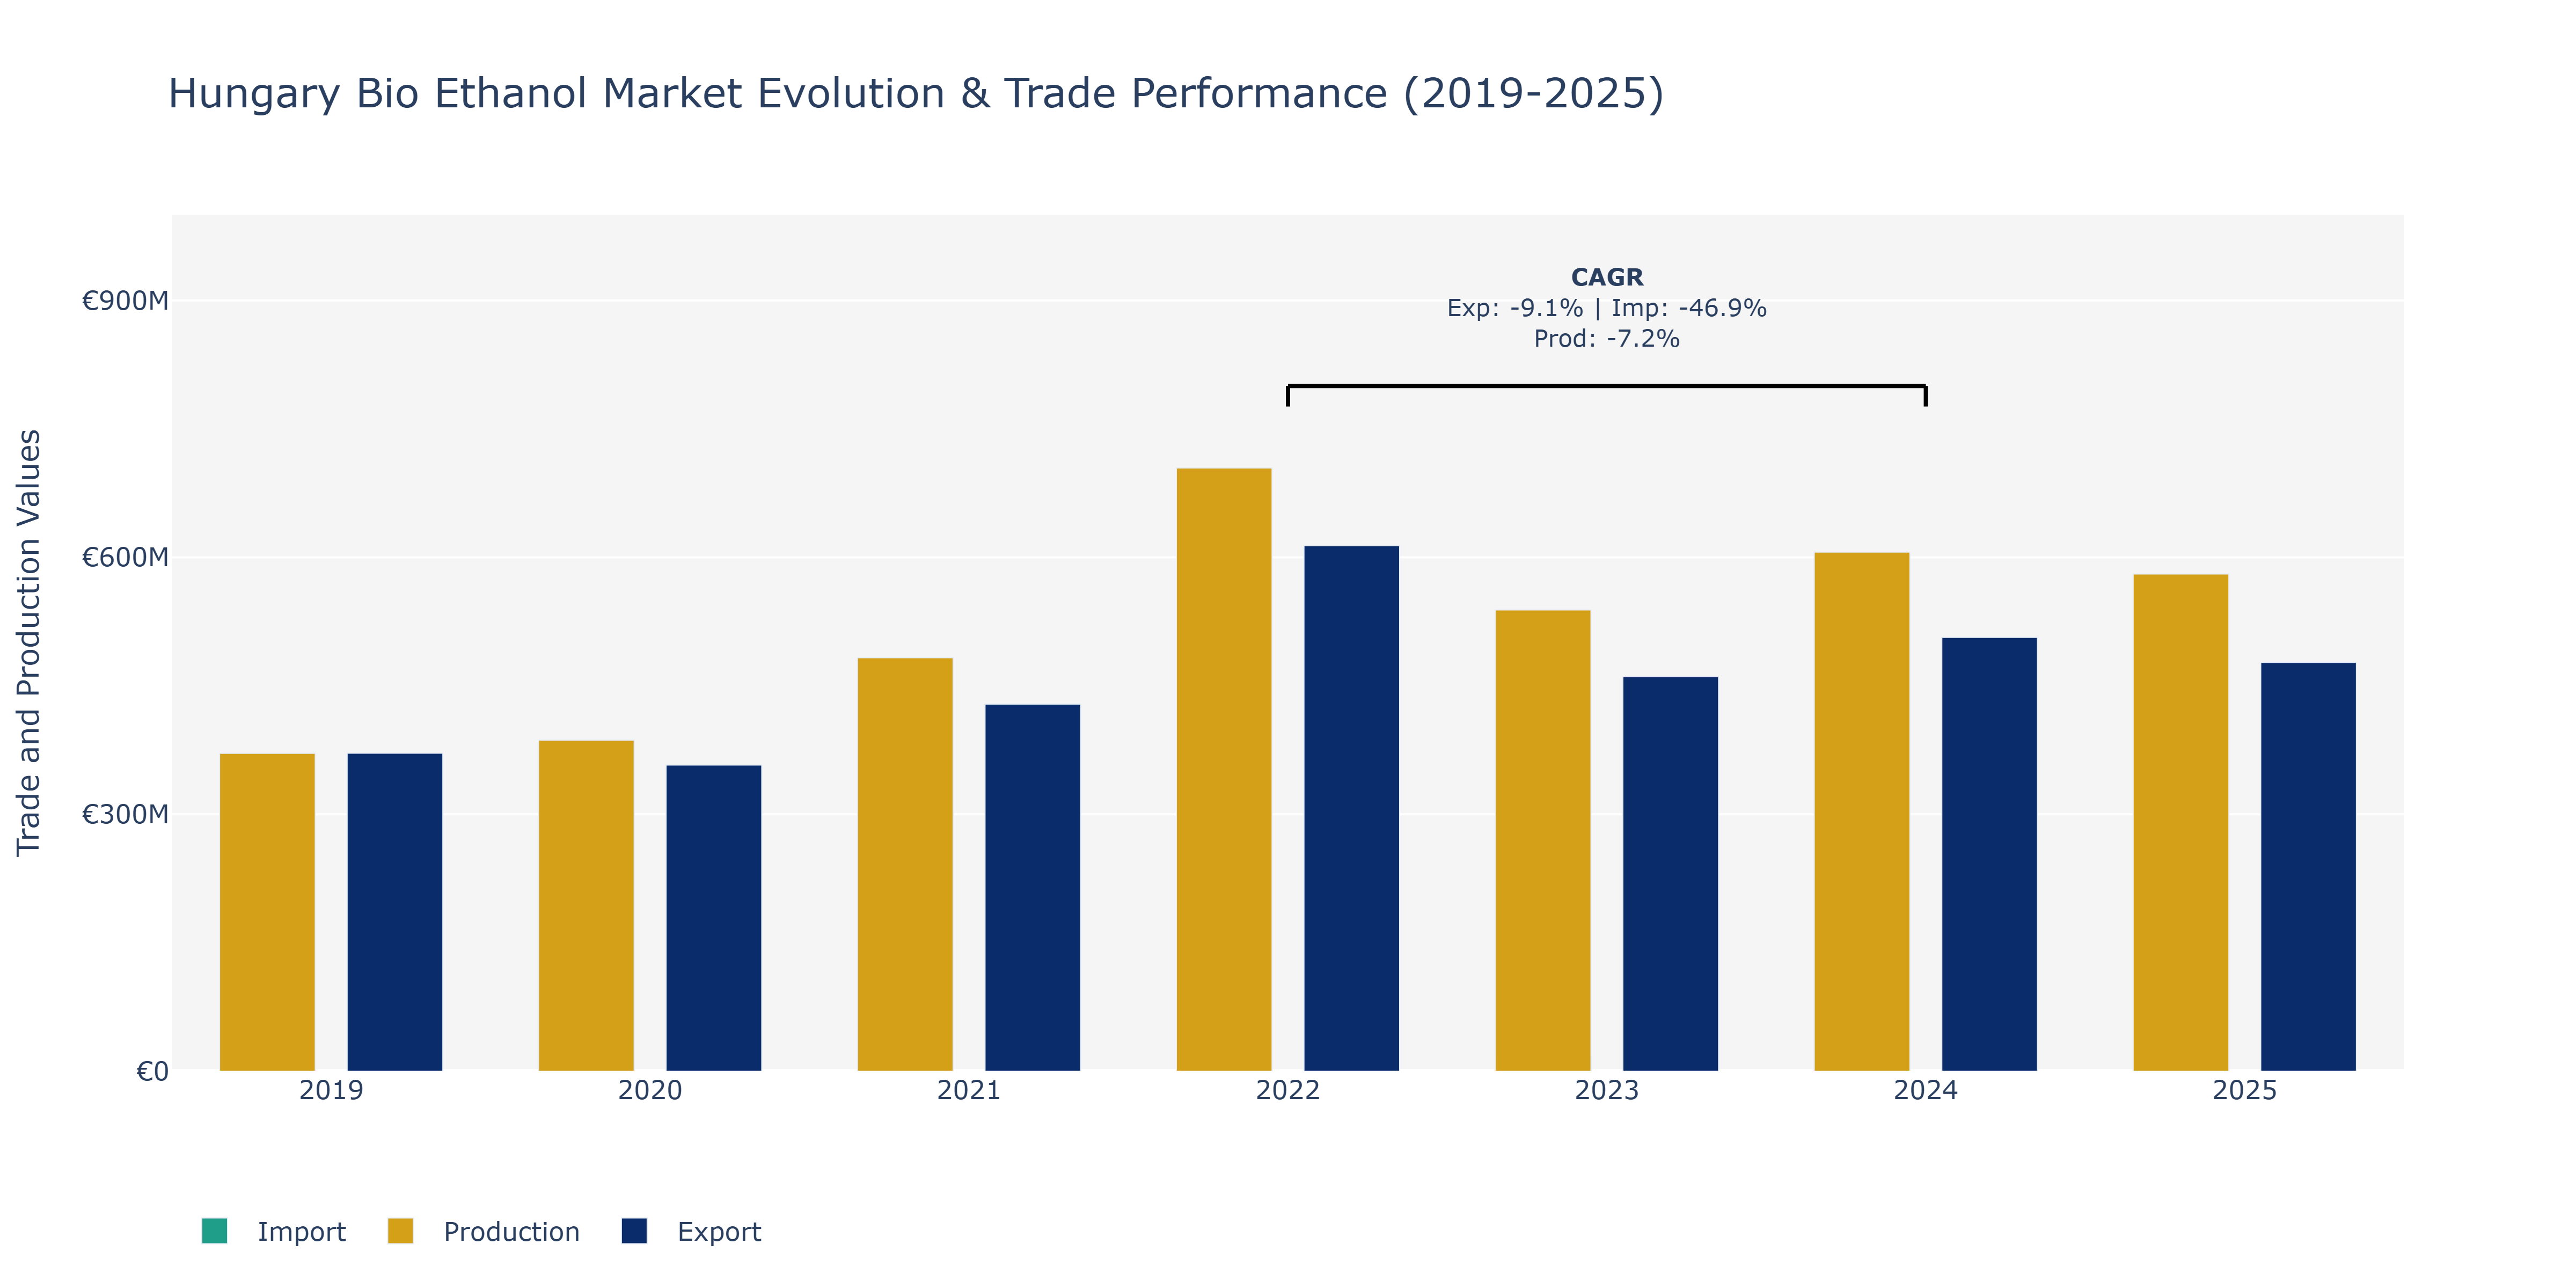
In the Hungary Bio Ethanol Market, exports exhibited fluctuations over the observed years, starting at €371.3 million in 2019, decreasing to €357.57 million in 2020, then peaking at €613.64 million in 2022 before dropping to €477.36 million in 2025. Imports followed a similar pattern, with values fluctuating between €2.9 million in 2019 to €15.78 million in 2023. Production levels also varied, standing at €371.14 million in 2019, reaching €704.45 million in 2022, and then decreasing to €580.68 million in 2025. The fluctuations in exports could be attributed to changes in global demand for bioethanol products, while imports may have been influenced by shifts in domestic consumption patterns. The rise in production until 2022 could be linked to increased investments in bioethanol infrastructure, while the subsequent decline might reflect market saturation or regulatory changes impacting production processes. These trends align with the broader global shift towards sustainable fuel sources, as seen in the European Union's Renewable Energy Directive, encouraging the use of biofuels.
Key Highlights of the Report:
- Hungary Bio Ethanol Market Outlook
- Market Size of Hungary Bio Ethanol Market, 2025
- Forecast of Hungary Bio Ethanol Market, 2032
- Historical Data and Forecast of Hungary Bio Ethanol Revenues & Volume for the Period 2022-2032F
- Hungary Bio Ethanol Market Trend Evolution
- Hungary Bio Ethanol Market Drivers and Challenges
- Hungary Bio Ethanol Price Trends
- Hungary Bio Ethanol Porter's Five Forces
- Hungary Bio Ethanol Industry Life Cycle
- Historical Data and Forecast of Hungary Bio Ethanol Market Revenues & Volume By Feedstock Type for the Period 2022-2032F
- Historical Data and Forecast of Hungary Bio Ethanol Market Revenues & Volume By Sugarcane for the Period 2022-2032F
- Historical Data and Forecast of Hungary Bio Ethanol Market Revenues & Volume By Corn for the Period 2022-2032F
- Historical Data and Forecast of Hungary Bio Ethanol Market Revenues & Volume By Cellulosic Biomass for the Period 2022-2032F
- Historical Data and Forecast of Hungary Bio Ethanol Market Revenues & Volume By Application for the Period 2022-2032F
- Historical Data and Forecast of Hungary Bio Ethanol Market Revenues & Volume By Fuel for the Period 2022-2032F
- Historical Data and Forecast of Hungary Bio Ethanol Market Revenues & Volume By Power Generation for the Period 2022-2032F
- Historical Data and Forecast of Hungary Bio Ethanol Market Revenues & Volume By Industrial Processes for the Period 2022-2032F
- Historical Data and Forecast of Hungary Bio Ethanol Market Revenues & Volume By End User for the Period 2022-2032F
- Historical Data and Forecast of Hungary Bio Ethanol Market Revenues & Volume By Automotive for the Period 2022-2032F
- Historical Data and Forecast of Hungary Bio Ethanol Market Revenues & Volume By Energy Producers for the Period 2022-2032F
- Historical Data and Forecast of Hungary Bio Ethanol Market Revenues & Volume By Industrial for the Period 2022-2032F
- Historical Data and Forecast of Hungary Bio Ethanol Market Revenues & Volume By Technology for the Period 2022-2032F
- Historical Data and Forecast of Hungary Bio Ethanol Market Revenues & Volume By Fermentation for the Period 2022-2032F
- Historical Data and Forecast of Hungary Bio Ethanol Market Revenues & Volume By Distillation for the Period 2022-2032F
- Historical Data and Forecast of Hungary Bio Ethanol Market Revenues & Volume By Enzymatic Hydrolysis for the Period 2022-2032F
- Historical Data and Forecast of Hungary Bio Ethanol Market Revenues & Volume By Sustainability Factor for the Period 2022-2032F
- Historical Data and Forecast of Hungary Bio Ethanol Market Revenues & Volume By Renewable for the Period 2022-2032F
- Historical Data and Forecast of Hungary Bio Ethanol Market Revenues & Volume By Low Emissions for the Period 2022-2032F
- Historical Data and Forecast of Hungary Bio Ethanol Market Revenues & Volume By Sustainable for the Period 2022-2032F
- Hungary Bio Ethanol Import Export Trade Statistics
- Market Opportunity Assessment By Feedstock Type
- Market Opportunity Assessment By Application
- Market Opportunity Assessment By End User
- Market Opportunity Assessment By Technology
- Market Opportunity Assessment By Sustainability Factor
- Hungary Bio Ethanol Top Companies Market Share
- Hungary Bio Ethanol Competitive Benchmarking By Technical and Operational Parameters
- Hungary Bio Ethanol Company Profiles
- Hungary Bio Ethanol Key Strategic Recommendations
Frequently Asked Questions About the Market Study (FAQs):
6Wresearch actively monitors the Hungary Bio Ethanol Market and publishes its comprehensive annual report, highlighting emerging trends, growth drivers, revenue analysis, and forecast outlook. Our insights help businesses to make data-backed strategic decisions with ongoing market dynamics. Our analysts track relevent industries related to the Hungary Bio Ethanol Market, allowing our clients with actionable intelligence and reliable forecasts tailored to emerging regional needs.
Yes, we provide customisation as per your requirements. To learn more, feel free to contact us on sales@6wresearch.com
1 Executive Summary |
2 Introduction |
2.1 Key Highlights of the Report |
2.2 Report Description |
2.3 Market Scope & Segmentation |
2.4 Research Methodology |
2.5 Assumptions |
3 Hungary Bio Ethanol Market Overview |
3.1 Hungary Country Macro Economic Indicators |
3.2 Hungary Bio Ethanol Market Revenues & Volume, 2022 & 2032F |
3.3 Hungary Bio Ethanol Market - Industry Life Cycle |
3.4 Hungary Bio Ethanol Market - Porter's Five Forces |
3.5 Hungary Bio Ethanol Market Revenues & Volume Share, By Feedstock Type, 2022 & 2032F |
3.6 Hungary Bio Ethanol Market Revenues & Volume Share, By Application, 2022 & 2032F |
3.7 Hungary Bio Ethanol Market Revenues & Volume Share, By End User, 2022 & 2032F |
3.8 Hungary Bio Ethanol Market Revenues & Volume Share, By Technology, 2022 & 2032F |
3.9 Hungary Bio Ethanol Market Revenues & Volume Share, By Sustainability Factor, 2022 & 2032F |
4 Hungary Bio Ethanol Market Dynamics |
4.1 Impact Analysis |
4.2 Market Drivers |
4.2.1 Increasing government support and incentives for biofuels in Hungary |
4.2.2 Growing awareness and demand for sustainable and renewable energy sources |
4.2.3 Rising concerns about environmental pollution and climate change leading to a shift towards bioethanol usage |
4.3 Market Restraints |
4.3.1 Fluctuating raw material prices impacting production costs |
4.3.2 Competition from other renewable energy sources like biodiesel or electric vehicles |
4.3.3 Lack of infrastructure for distribution and usage of bioethanol in Hungary |
5 Hungary Bio Ethanol Market Trends |
6 Hungary Bio Ethanol Market, By Types |
6.1 Hungary Bio Ethanol Market, By Feedstock Type |
6.1.1 Overview and Analysis |
6.1.2 Hungary Bio Ethanol Market Revenues & Volume, By Feedstock Type, 2022 - 2032F |
6.1.3 Hungary Bio Ethanol Market Revenues & Volume, By Sugarcane, 2022 - 2032F |
6.1.4 Hungary Bio Ethanol Market Revenues & Volume, By Corn, 2022 - 2032F |
6.1.5 Hungary Bio Ethanol Market Revenues & Volume, By Cellulosic Biomass, 2022 - 2032F |
6.2 Hungary Bio Ethanol Market, By Application |
6.2.1 Overview and Analysis |
6.2.2 Hungary Bio Ethanol Market Revenues & Volume, By Fuel, 2022 - 2032F |
6.2.3 Hungary Bio Ethanol Market Revenues & Volume, By Power Generation, 2022 - 2032F |
6.2.4 Hungary Bio Ethanol Market Revenues & Volume, By Industrial Processes, 2022 - 2032F |
6.3 Hungary Bio Ethanol Market, By End User |
6.3.1 Overview and Analysis |
6.3.2 Hungary Bio Ethanol Market Revenues & Volume, By Automotive, 2022 - 2032F |
6.3.3 Hungary Bio Ethanol Market Revenues & Volume, By Energy Producers, 2022 - 2032F |
6.3.4 Hungary Bio Ethanol Market Revenues & Volume, By Industrial, 2022 - 2032F |
6.4 Hungary Bio Ethanol Market, By Technology |
6.4.1 Overview and Analysis |
6.4.2 Hungary Bio Ethanol Market Revenues & Volume, By Fermentation, 2022 - 2032F |
6.4.3 Hungary Bio Ethanol Market Revenues & Volume, By Distillation, 2022 - 2032F |
6.4.4 Hungary Bio Ethanol Market Revenues & Volume, By Enzymatic Hydrolysis, 2022 - 2032F |
6.5 Hungary Bio Ethanol Market, By Sustainability Factor |
6.5.1 Overview and Analysis |
6.5.2 Hungary Bio Ethanol Market Revenues & Volume, By Renewable, 2022 - 2032F |
6.5.3 Hungary Bio Ethanol Market Revenues & Volume, By Low Emissions, 2022 - 2032F |
6.5.4 Hungary Bio Ethanol Market Revenues & Volume, By Sustainable, 2022 - 2032F |
7 Hungary Bio Ethanol Market Import-Export Trade Statistics |
7.1 Hungary Bio Ethanol Market Export to Major Countries |
7.2 Hungary Bio Ethanol Market Imports from Major Countries |
8 Hungary Bio Ethanol Market Key Performance Indicators |
8.1 Percentage of agricultural land dedicated to bioethanol feedstock cultivation |
8.2 Number of bioethanol production facilities in Hungary |
8.3 Amount of CO2 emissions reduced by the use of bioethanol in the transportation sector |
9 Hungary Bio Ethanol Market - Opportunity Assessment |
9.1 Hungary Bio Ethanol Market Opportunity Assessment, By Feedstock Type, 2022 & 2032F |
9.2 Hungary Bio Ethanol Market Opportunity Assessment, By Application, 2022 & 2032F |
9.3 Hungary Bio Ethanol Market Opportunity Assessment, By End User, 2022 & 2032F |
9.4 Hungary Bio Ethanol Market Opportunity Assessment, By Technology, 2022 & 2032F |
9.5 Hungary Bio Ethanol Market Opportunity Assessment, By Sustainability Factor, 2022 & 2032F |
10 Hungary Bio Ethanol Market - Competitive Landscape |
10.1 Hungary Bio Ethanol Market Revenue Share, By Companies, 2025 |
10.2 Hungary Bio Ethanol Market Competitive Benchmarking, By Operating and Technical Parameters |
11 Company Profiles |
12 Recommendations |
13 Disclaimer |
Global Go To Market Strategy - 2030
Export potential enables firms to identify high-growth global markets with greater confidence by combining advanced trade intelligence with a structured quantitative methodology. The framework analyzes emerging demand trends and country-level import patterns while integrating macroeconomic and trade datasets such as GDP and population forecasts, bilateral import–export flows, tariff structures, elasticity differentials between developed and developing economies, geographic distance, and import demand projections. Using weighted trade values from 2020–2024 as the base period to project country-to-country export potential for 2030, these inputs are operationalized through calculated drivers such as gravity model parameters, tariff impact factors, and projected GDP per-capita growth. Through an analysis of hidden potentials, demand hotspots, and market conditions that are most favorable to success, this method enables firms to focus on target countries, maximize returns, and global expansion with data, backed by accuracy.
By factoring in the projected importer demand gap that is currently unmet and could be potential opportunity, it identifies the potential for the Exporter (Country) among 190 countries, against the general trade analysis, which identifies the biggest importer or exporter.
To discover high-growth global markets and optimize your business strategy:
Click Here
Pricing
- Single User License$ 1,995
- Department License$ 2,400
- Site License$ 3,120
- Global License$ 3,795

Leadership Perspectives from Industry Events
Search
Thought Leadership and Analyst Meet


Our Clients
6WResearch In News
- India Air Conditioner Market Set for Strong Rebound in 2026 After Weather-Led Correction and GST-Driven Recovery: 6Wresearch
- ADAS in India: How Automatic Emergency Braking, Blind Spot Detection & Driver Monitoring are Transforming Road Safety
- Doha a strategic location for EV manufacturing hub: IPA Qatar
- Demand for luxury TVs surging in the GCC, says Samsung
- Empowering Growth: The Thriving Journey of Bangladesh’s Cable Industry
- Demand for luxury TVs surging in the GCC, says Samsung
Latest Reports
- Poland Fire Protection Systems Market (2026-2032)
- Cape Verde Portable Hand-Thrown Extinguisher Market (2026-2032)
- Canada Portable Hand-Thrown Extinguisher Market (2026-2032)
- Cameroon Portable Hand-Thrown Extinguisher Market (2026-2032)
- Burundi Portable Hand-Thrown Extinguisher Market (2026-2032)
- Burkina Faso Portable Hand-Thrown Extinguisher Market (2026-2032)
- Bulgaria Portable Hand-Thrown Extinguisher Market (2026-2032)
- Brunei Portable Hand-Thrown Extinguisher Market (2026-2032)
- Botswana Portable Hand-Thrown Extinguisher Market (2026-2032)
- Bosnia and Herzegovina Portable Hand-Thrown Extinguisher Market (2026-2032)
Industry Events and Analyst Meet

HIMTEX 2026

India Refining Summit 2026

India EV Show 2026

EV tech India Expo 2026

Auto Tech Asia 2026
Whitepaper
- Middle East & Africa Commercial Security Market Click here to view more.
- Middle East & Africa Fire Safety Systems & Equipment Market Click here to view more.
- GCC Drone Market Click here to view more.
- Middle East Lighting Fixture Market Click here to view more.
- GCC Physical & Perimeter Security Market Click here to view more.