Hungary Black Board Market (2026-2032) Outlook | Analysis, Trends, Forecast, Value, Industry, Share, Size, Companies, Growth, Revenue
Market Forecast By Product Type (Wall-mounted Board, Mobile Board, Others), By Application (Schools, Office, Family, Others) And Competitive Landscape
| Product Code: ETC315139 | Publication Date: Aug 2022 | Updated Date: Apr 2026 | Product Type: Market Research Report | |
| Publisher: 6Wresearch | Author: Ravi Bhandari | No. of Pages: 75 | No. of Figures: 35 | No. of Tables: 20 |
Hungary Black Board Market Size (2020-2030)
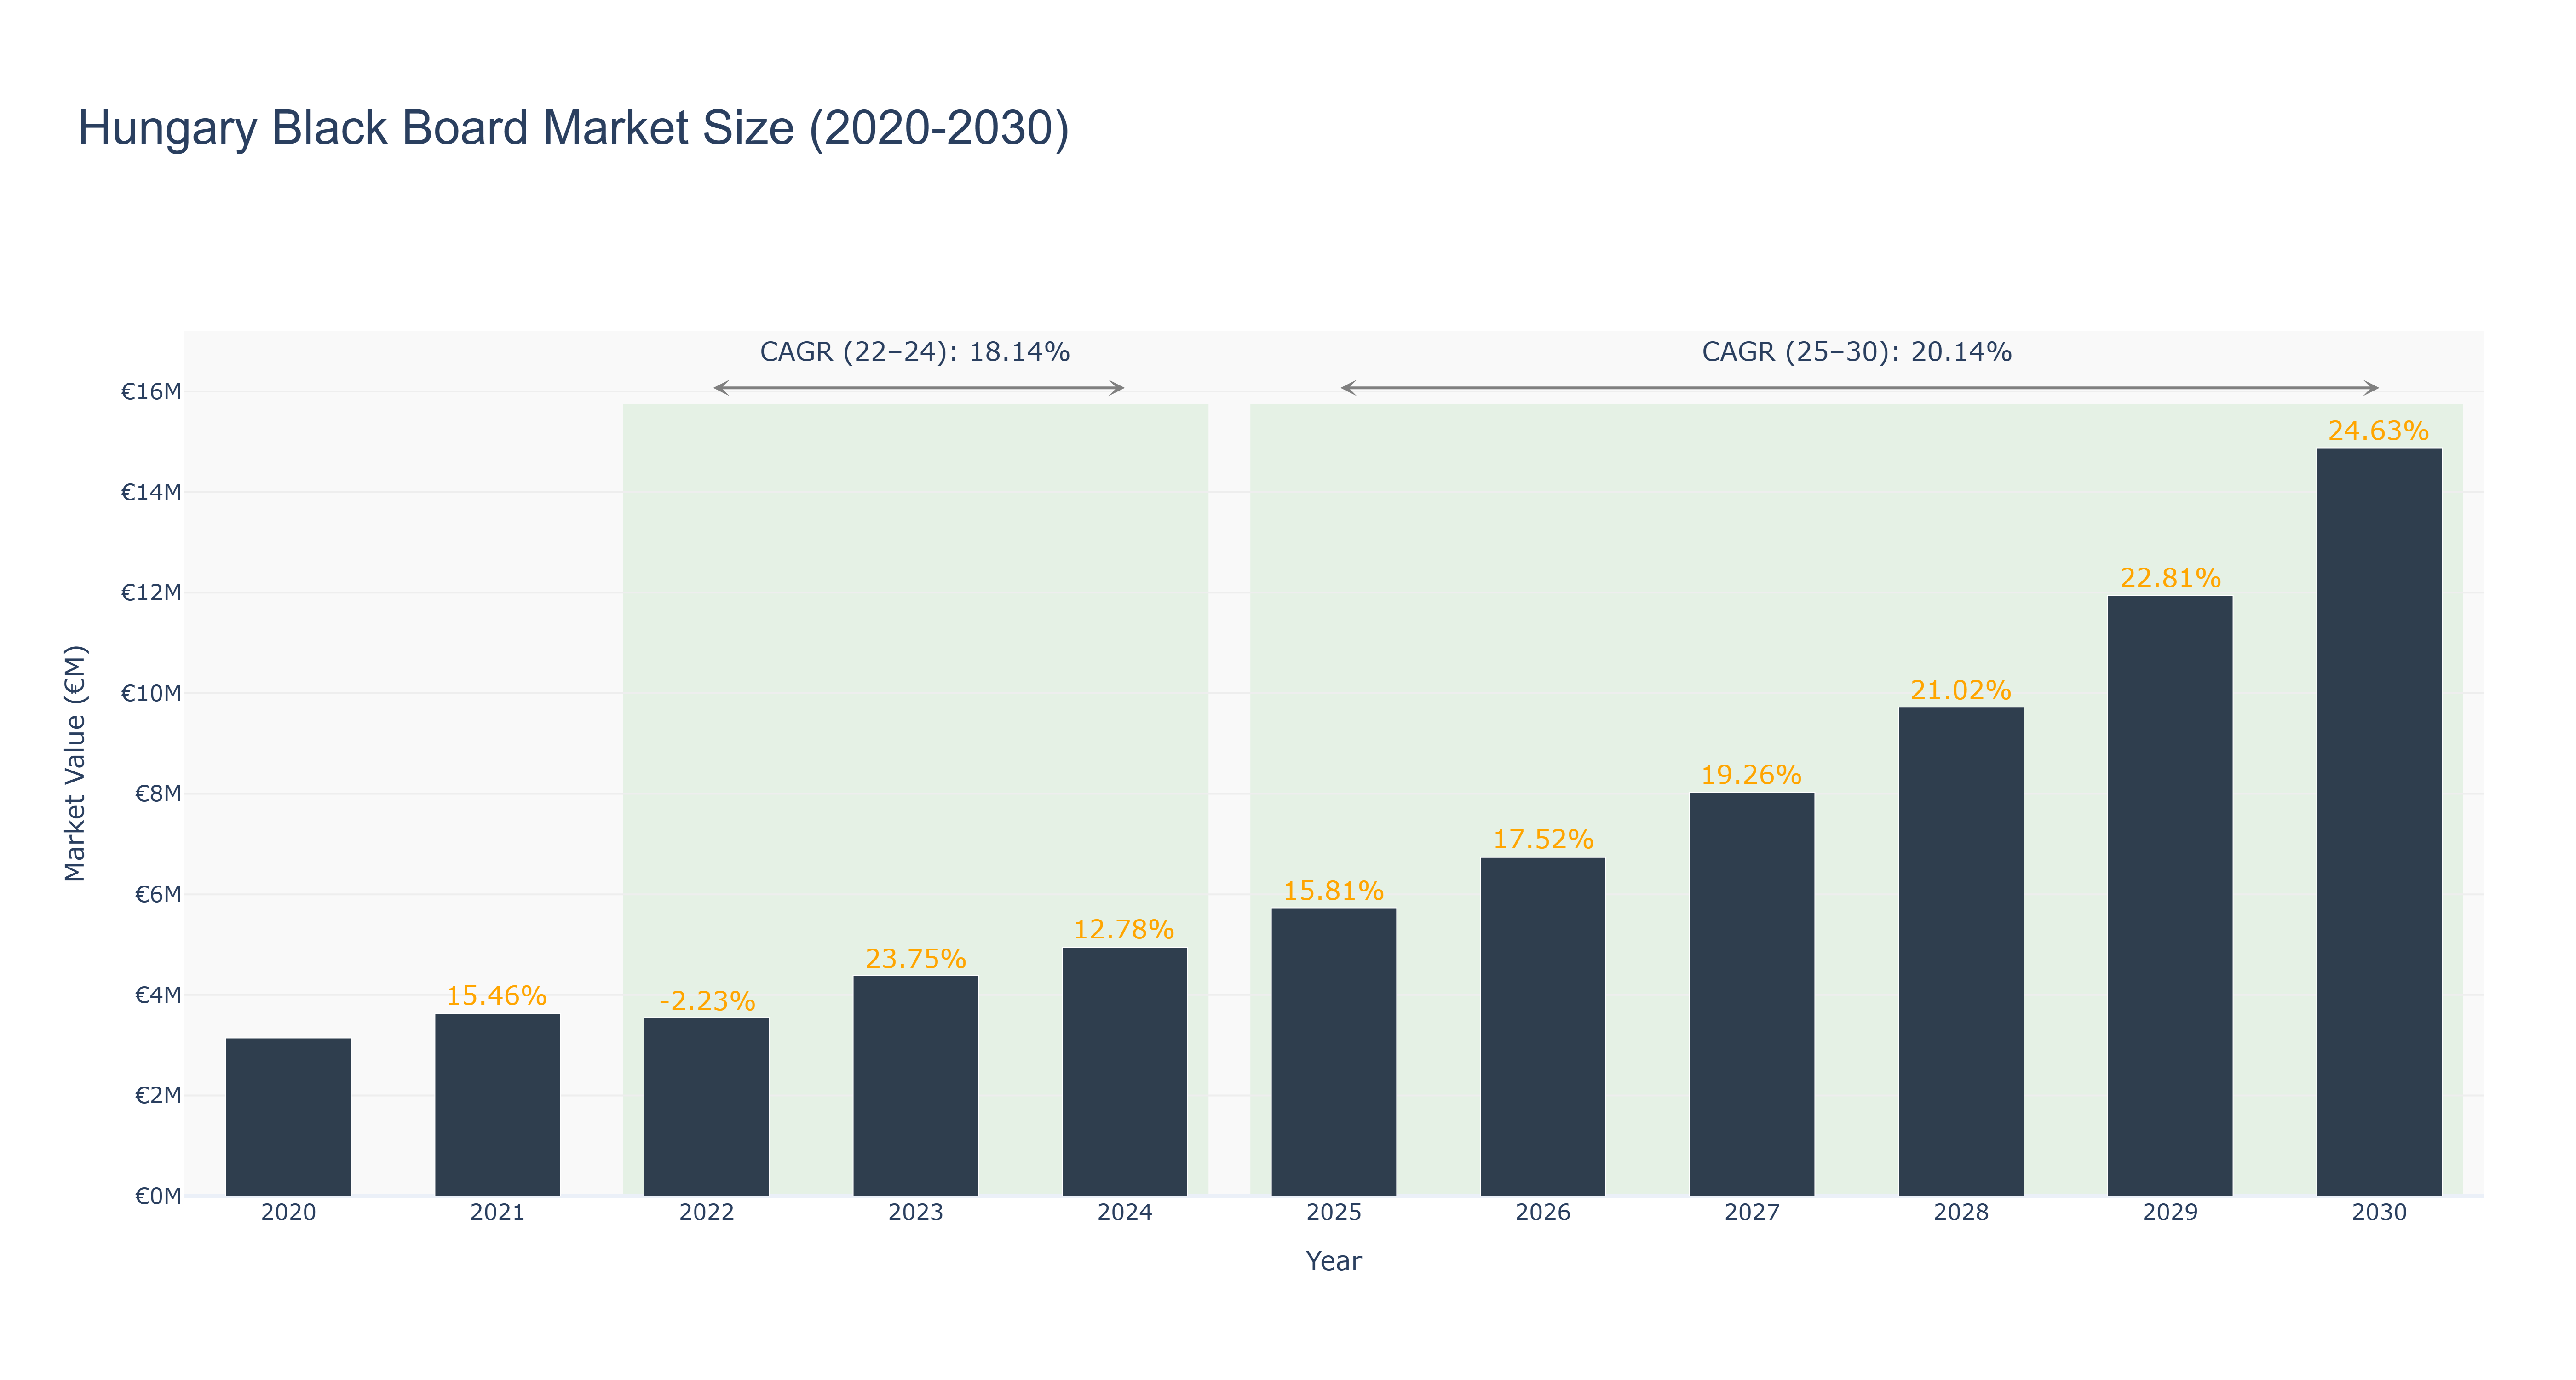
The Hungary Black Board Market exhibited a notable increase in size, peaking at €4.95 million in 2024, following a varied growth trajectory from €3.14 million in 2020. The actual market experienced a decline of 2.23% in 2022, yet rebounded strongly to achieve a growth of 23.75% in 2023, driven by the resurgence in educational investments and a shift towards more interactive learning environments. The Compound Annual Growth Rate (CAGR) for the actual period from 2022 to 2024 stands at 18.14%. Looking ahead, the forecasted period from 2025 to 2030 indicates robust growth, with projected market sizes reaching €14.88 million by 2030 and a CAGR of 20.14%. This growth is anticipated to be fueled by advancements in educational technology and increasing demand for innovative classroom solutions, positioning Hungary's market for continued expansion amid evolving educational paradigms.
Hungary Black Board Market: Production & Trade Performance (2019-2025)
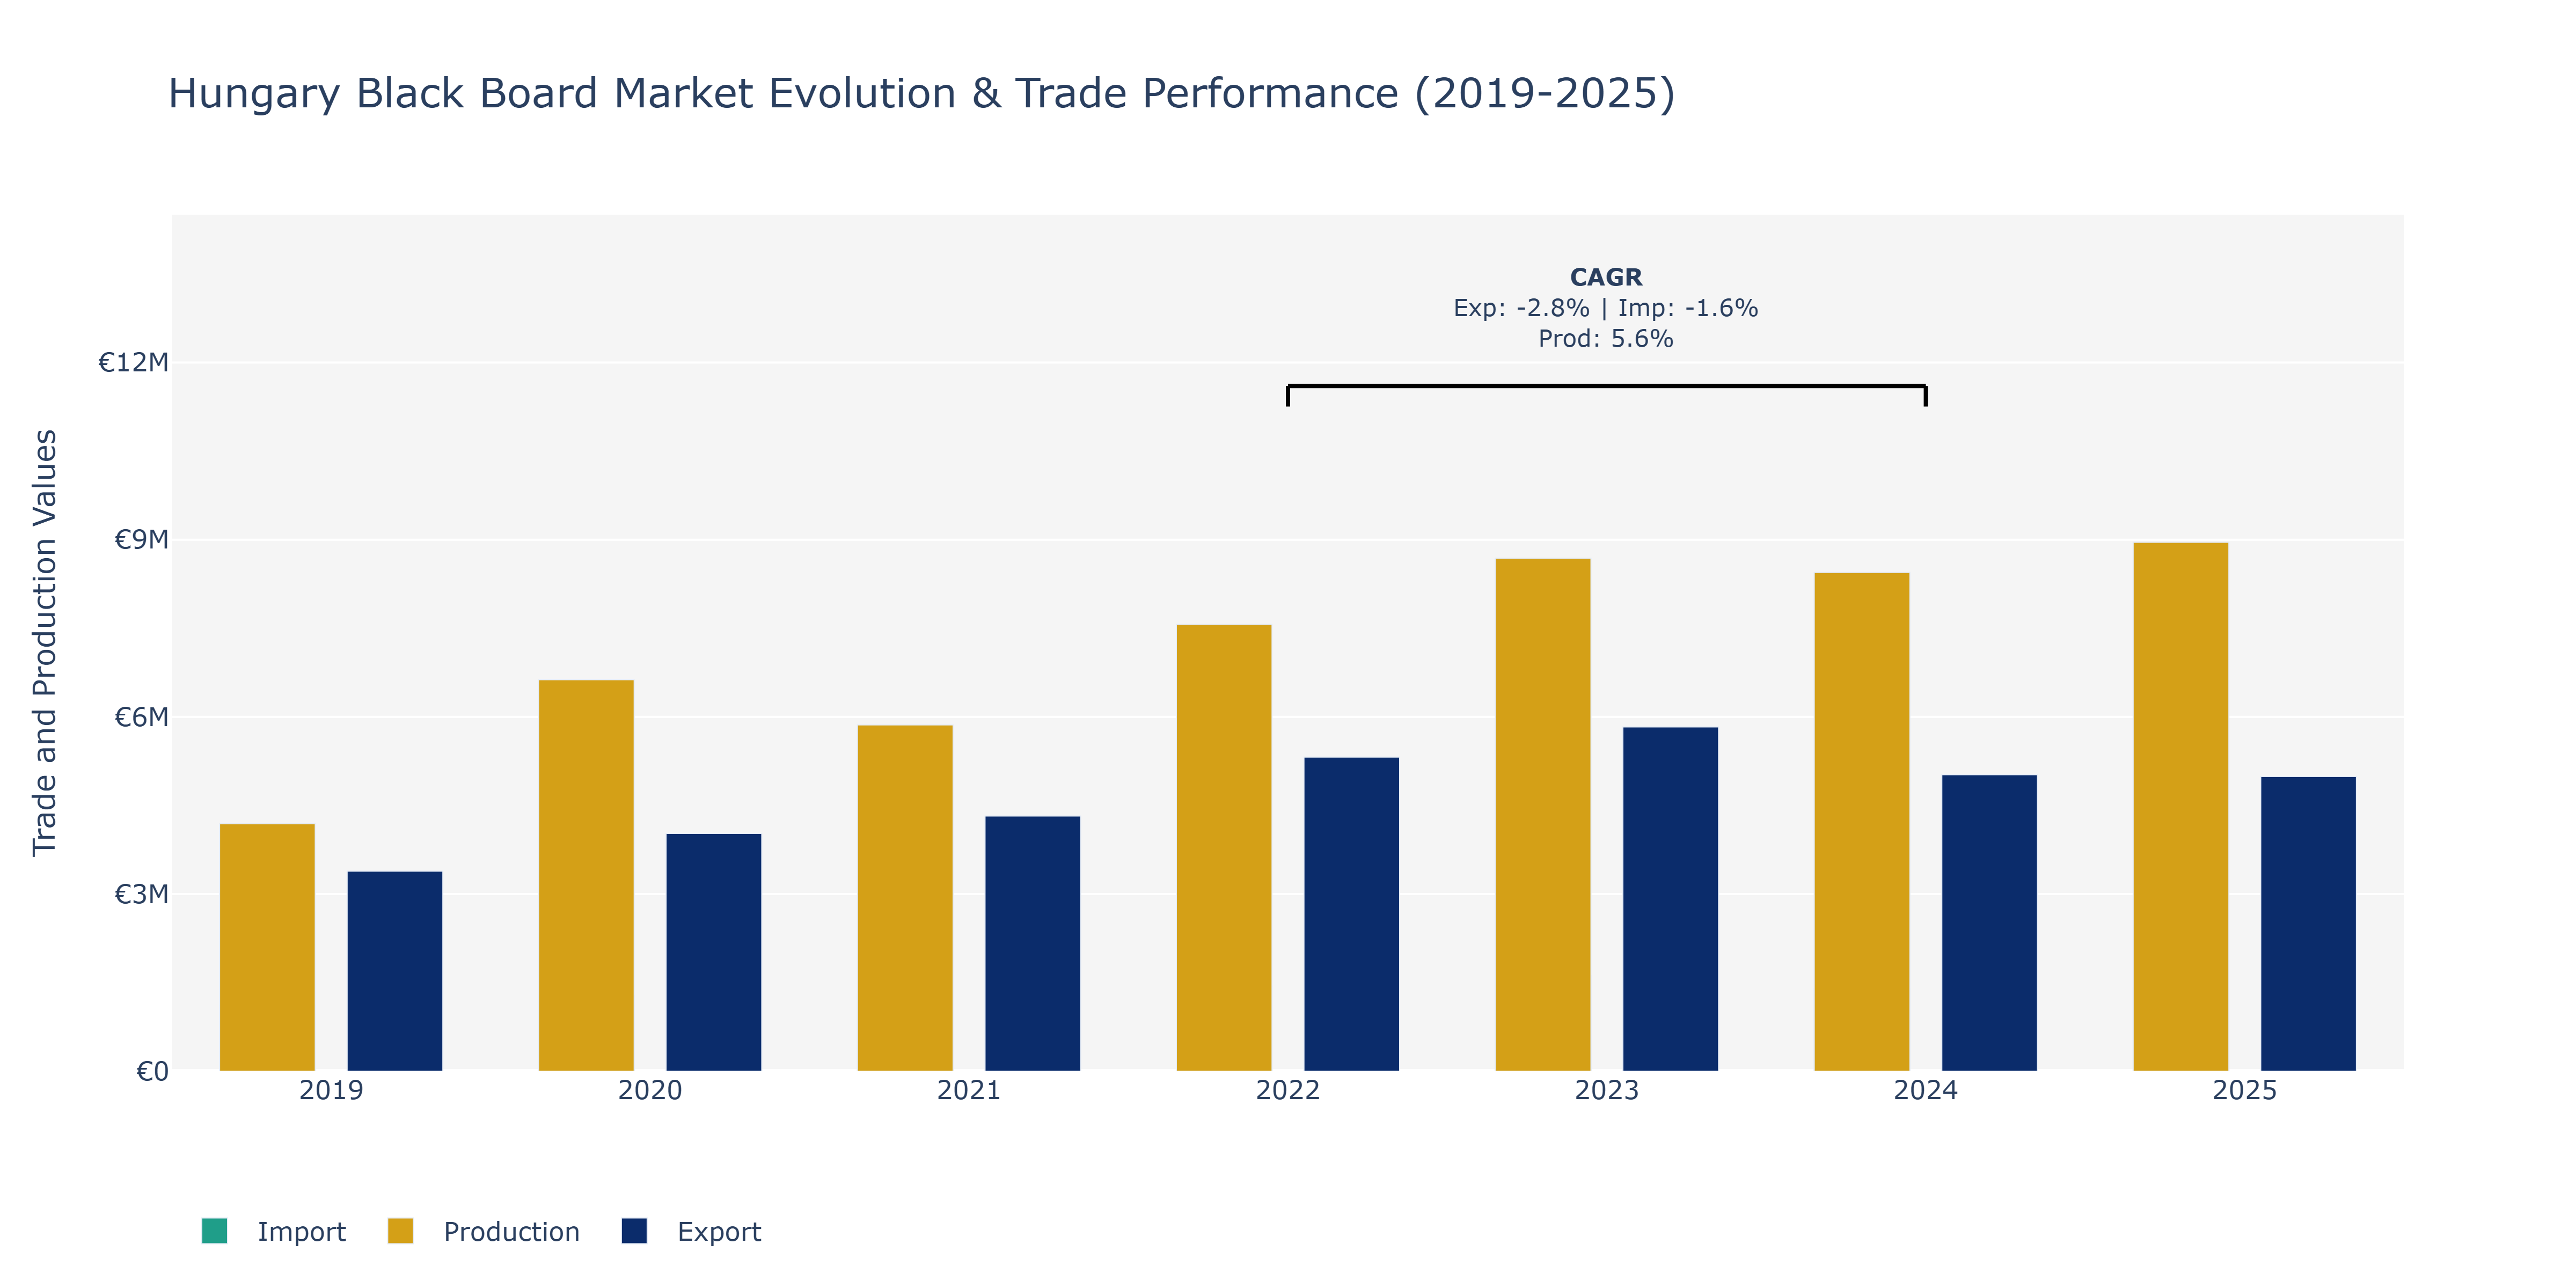
Between 2019 and 2025, Hungary's Black Board Market saw notable shifts in key metrics. Exports displayed a fluctuating pattern, reaching a peak of €5.83 million in 2023 before slightly declining in 2024 and 2025. This rise can be attributed to increased global demand for black boards and Hungary's competitive pricing strategies. Imports also experienced growth, with a steady increase from €1.12 million in 2019 to €1.62 million in 2023, indicating a demand for raw materials or specialized components. Production demonstrated a consistent uptrend, hitting €8.69 million in 2023, showcasing Hungary's manufacturing capabilities and efficiency. The slight decline in production in 2024 and 2025 may be due to supply chain disruptions or changes in consumer preferences. These trends align with the market's CAGR, emphasizing the need for market players to adapt to evolving demands and external factors to maintain competitiveness in the global black board industry.
Key Highlights of the Report:
- Hungary Black Board Market Outlook
- Market Size of Hungary Black Board Market, 2025
- Forecast of Hungary Black Board Market, 2032
- Historical Data and Forecast of Hungary Black Board Revenues & Volume for the Period 2022-2032F
- Hungary Black Board Market Trend Evolution
- Hungary Black Board Market Drivers and Challenges
- Hungary Black Board Price Trends
- Hungary Black Board Porter's Five Forces
- Hungary Black Board Industry Life Cycle
- Historical Data and Forecast of Hungary Black Board Market Revenues & Volume By Product Type for the Period 2022-2032F
- Historical Data and Forecast of Hungary Black Board Market Revenues & Volume By Wall-mounted Board for the Period 2022-2032F
- Historical Data and Forecast of Hungary Black Board Market Revenues & Volume By Mobile Board for the Period 2022-2032F
- Historical Data and Forecast of Hungary Black Board Market Revenues & Volume By Others for the Period 2022-2032F
- Historical Data and Forecast of Hungary Black Board Market Revenues & Volume By Application for the Period 2022-2032F
- Historical Data and Forecast of Hungary Black Board Market Revenues & Volume By Schools for the Period 2022-2032F
- Historical Data and Forecast of Hungary Black Board Market Revenues & Volume By Office for the Period 2022-2032F
- Historical Data and Forecast of Hungary Black Board Market Revenues & Volume By Family for the Period 2022-2032F
- Historical Data and Forecast of Hungary Black Board Market Revenues & Volume By Others for the Period 2022-2032F
- Hungary Black Board Import Export Trade Statistics
- Market Opportunity Assessment By Product Type
- Market Opportunity Assessment By Application
- Hungary Black Board Top Companies Market Share
- Hungary Black Board Competitive Benchmarking By Technical and Operational Parameters
- Hungary Black Board Company Profiles
- Hungary Black Board Key Strategic Recommendations
Frequently Asked Questions About the Market Study (FAQs):
6Wresearch actively monitors the Hungary Black Board Market and publishes its comprehensive annual report, highlighting emerging trends, growth drivers, revenue analysis, and forecast outlook. Our insights help businesses to make data-backed strategic decisions with ongoing market dynamics. Our analysts track relevent industries related to the Hungary Black Board Market, allowing our clients with actionable intelligence and reliable forecasts tailored to emerging regional needs.
Yes, we provide customisation as per your requirements. To learn more, feel free to contact us on sales@6wresearch.com
1 Executive Summary |
2 Introduction |
2.1 Key Highlights of the Report |
2.2 Report Description |
2.3 Market Scope & Segmentation |
2.4 Research Methodology |
2.5 Assumptions |
3 Hungary Black Board Market Overview |
3.1 Hungary Country Macro Economic Indicators |
3.2 Hungary Black Board Market Revenues & Volume, 2022 & 2032F |
3.3 Hungary Black Board Market - Industry Life Cycle |
3.4 Hungary Black Board Market - Porter's Five Forces |
3.5 Hungary Black Board Market Revenues & Volume Share, By Product Type, 2022 & 2032F |
3.6 Hungary Black Board Market Revenues & Volume Share, By Application, 2022 & 2032F |
4 Hungary Black Board Market Dynamics |
4.1 Impact Analysis |
4.2 Market Drivers |
4.2.1 Growing demand for interactive and digital learning tools in educational institutions |
4.2.2 Increasing adoption of blackboards in corporate training and seminar settings |
4.2.3 Government initiatives promoting the use of traditional teaching aids like blackboards in schools |
4.3 Market Restraints |
4.3.1 Competition from digital whiteboards and other advanced presentation tools |
4.3.2 High initial investment and maintenance costs associated with blackboards |
4.3.3 Limited availability of skilled professionals for blackboard installation and maintenance |
5 Hungary Black Board Market Trends |
6 Hungary Black Board Market, By Types |
6.1 Hungary Black Board Market, By Product Type |
6.1.1 Overview and Analysis |
6.1.2 Hungary Black Board Market Revenues & Volume, By Product Type, 2022 - 2032F |
6.1.3 Hungary Black Board Market Revenues & Volume, By Wall-mounted Board, 2022 - 2032F |
6.1.4 Hungary Black Board Market Revenues & Volume, By Mobile Board, 2022 - 2032F |
6.1.5 Hungary Black Board Market Revenues & Volume, By Others, 2022 - 2032F |
6.2 Hungary Black Board Market, By Application |
6.2.1 Overview and Analysis |
6.2.2 Hungary Black Board Market Revenues & Volume, By Schools, 2022 - 2032F |
6.2.3 Hungary Black Board Market Revenues & Volume, By Office, 2022 - 2032F |
6.2.4 Hungary Black Board Market Revenues & Volume, By Family, 2022 - 2032F |
6.2.5 Hungary Black Board Market Revenues & Volume, By Others, 2022 - 2032F |
7 Hungary Black Board Market Import-Export Trade Statistics |
7.1 Hungary Black Board Market Export to Major Countries |
7.2 Hungary Black Board Market Imports from Major Countries |
8 Hungary Black Board Market Key Performance Indicators |
8.1 Average utilization rate of blackboards in educational institutions |
8.2 Percentage of schools and businesses using blackboards as their primary teaching/training tool |
8.3 Rate of adoption of new blackboard technologies and features |
8.4 Customer satisfaction scores related to the quality and durability of blackboards |
9 Hungary Black Board Market - Opportunity Assessment |
9.1 Hungary Black Board Market Opportunity Assessment, By Product Type, 2022 & 2032F |
9.2 Hungary Black Board Market Opportunity Assessment, By Application, 2022 & 2032F |
10 Hungary Black Board Market - Competitive Landscape |
10.1 Hungary Black Board Market Revenue Share, By Companies, 2025 |
10.2 Hungary Black Board Market Competitive Benchmarking, By Operating and Technical Parameters |
11 Company Profiles |
12 Recommendations |
13 Disclaimer |
Global Go To Market Strategy - 2030
Export potential enables firms to identify high-growth global markets with greater confidence by combining advanced trade intelligence with a structured quantitative methodology. The framework analyzes emerging demand trends and country-level import patterns while integrating macroeconomic and trade datasets such as GDP and population forecasts, bilateral import–export flows, tariff structures, elasticity differentials between developed and developing economies, geographic distance, and import demand projections. Using weighted trade values from 2020–2024 as the base period to project country-to-country export potential for 2030, these inputs are operationalized through calculated drivers such as gravity model parameters, tariff impact factors, and projected GDP per-capita growth. Through an analysis of hidden potentials, demand hotspots, and market conditions that are most favorable to success, this method enables firms to focus on target countries, maximize returns, and global expansion with data, backed by accuracy.
By factoring in the projected importer demand gap that is currently unmet and could be potential opportunity, it identifies the potential for the Exporter (Country) among 190 countries, against the general trade analysis, which identifies the biggest importer or exporter.
To discover high-growth global markets and optimize your business strategy:
Click Here
Pricing
- Single User License$ 1,995
- Department License$ 2,400
- Site License$ 3,120
- Global License$ 3,795

Leadership Perspectives from Industry Events
Search
Thought Leadership and Analyst Meet


Our Clients
6WResearch In News
- India Air Conditioner Market Set for Strong Rebound in 2026 After Weather-Led Correction and GST-Driven Recovery: 6Wresearch
- ADAS in India: How Automatic Emergency Braking, Blind Spot Detection & Driver Monitoring are Transforming Road Safety
- Doha a strategic location for EV manufacturing hub: IPA Qatar
- Demand for luxury TVs surging in the GCC, says Samsung
- Empowering Growth: The Thriving Journey of Bangladesh’s Cable Industry
- Demand for luxury TVs surging in the GCC, says Samsung
Latest Reports
- Poland Fire Protection Systems Market (2026-2032)
- Cape Verde Portable Hand-Thrown Extinguisher Market (2026-2032)
- Canada Portable Hand-Thrown Extinguisher Market (2026-2032)
- Cameroon Portable Hand-Thrown Extinguisher Market (2026-2032)
- Burundi Portable Hand-Thrown Extinguisher Market (2026-2032)
- Burkina Faso Portable Hand-Thrown Extinguisher Market (2026-2032)
- Bulgaria Portable Hand-Thrown Extinguisher Market (2026-2032)
- Brunei Portable Hand-Thrown Extinguisher Market (2026-2032)
- Botswana Portable Hand-Thrown Extinguisher Market (2026-2032)
- Bosnia and Herzegovina Portable Hand-Thrown Extinguisher Market (2026-2032)
Industry Events and Analyst Meet

HIMTEX 2026

India Refining Summit 2026

India EV Show 2026

EV tech India Expo 2026

Auto Tech Asia 2026
Whitepaper
- Middle East & Africa Commercial Security Market Click here to view more.
- Middle East & Africa Fire Safety Systems & Equipment Market Click here to view more.
- GCC Drone Market Click here to view more.
- Middle East Lighting Fixture Market Click here to view more.
- GCC Physical & Perimeter Security Market Click here to view more.