Hungary Chemical Packaging Market (2026-2032) | Share, Value, Size, Outlook, Industry, Companies, Forecast, Revenue, Growth, Trends & Analysis
Market Forecast By Product Types (Sacks, Drums, FIBC, Other), By Applications (Pharmaceutical Factory, Laboratory, Chemical Plant, Others) And Competitive Landscape
| Product Code: ETC006879 | Publication Date: Sep 2020 | Updated Date: Jun 2026 | Product Type: Report | |
| Publisher: 6Wresearch | Author: Ravi Bhandari | No. of Pages: 70 | No. of Figures: 35 | No. of Tables: 5 |
Hungary Chemical Packaging Market Summary
The hungary chemical packaging market was estimated at USD 220 Million in 2025 and is projected to reach USD 297 Million by 2032, growing at a CAGR of 4.8% from 2026 to 2032.
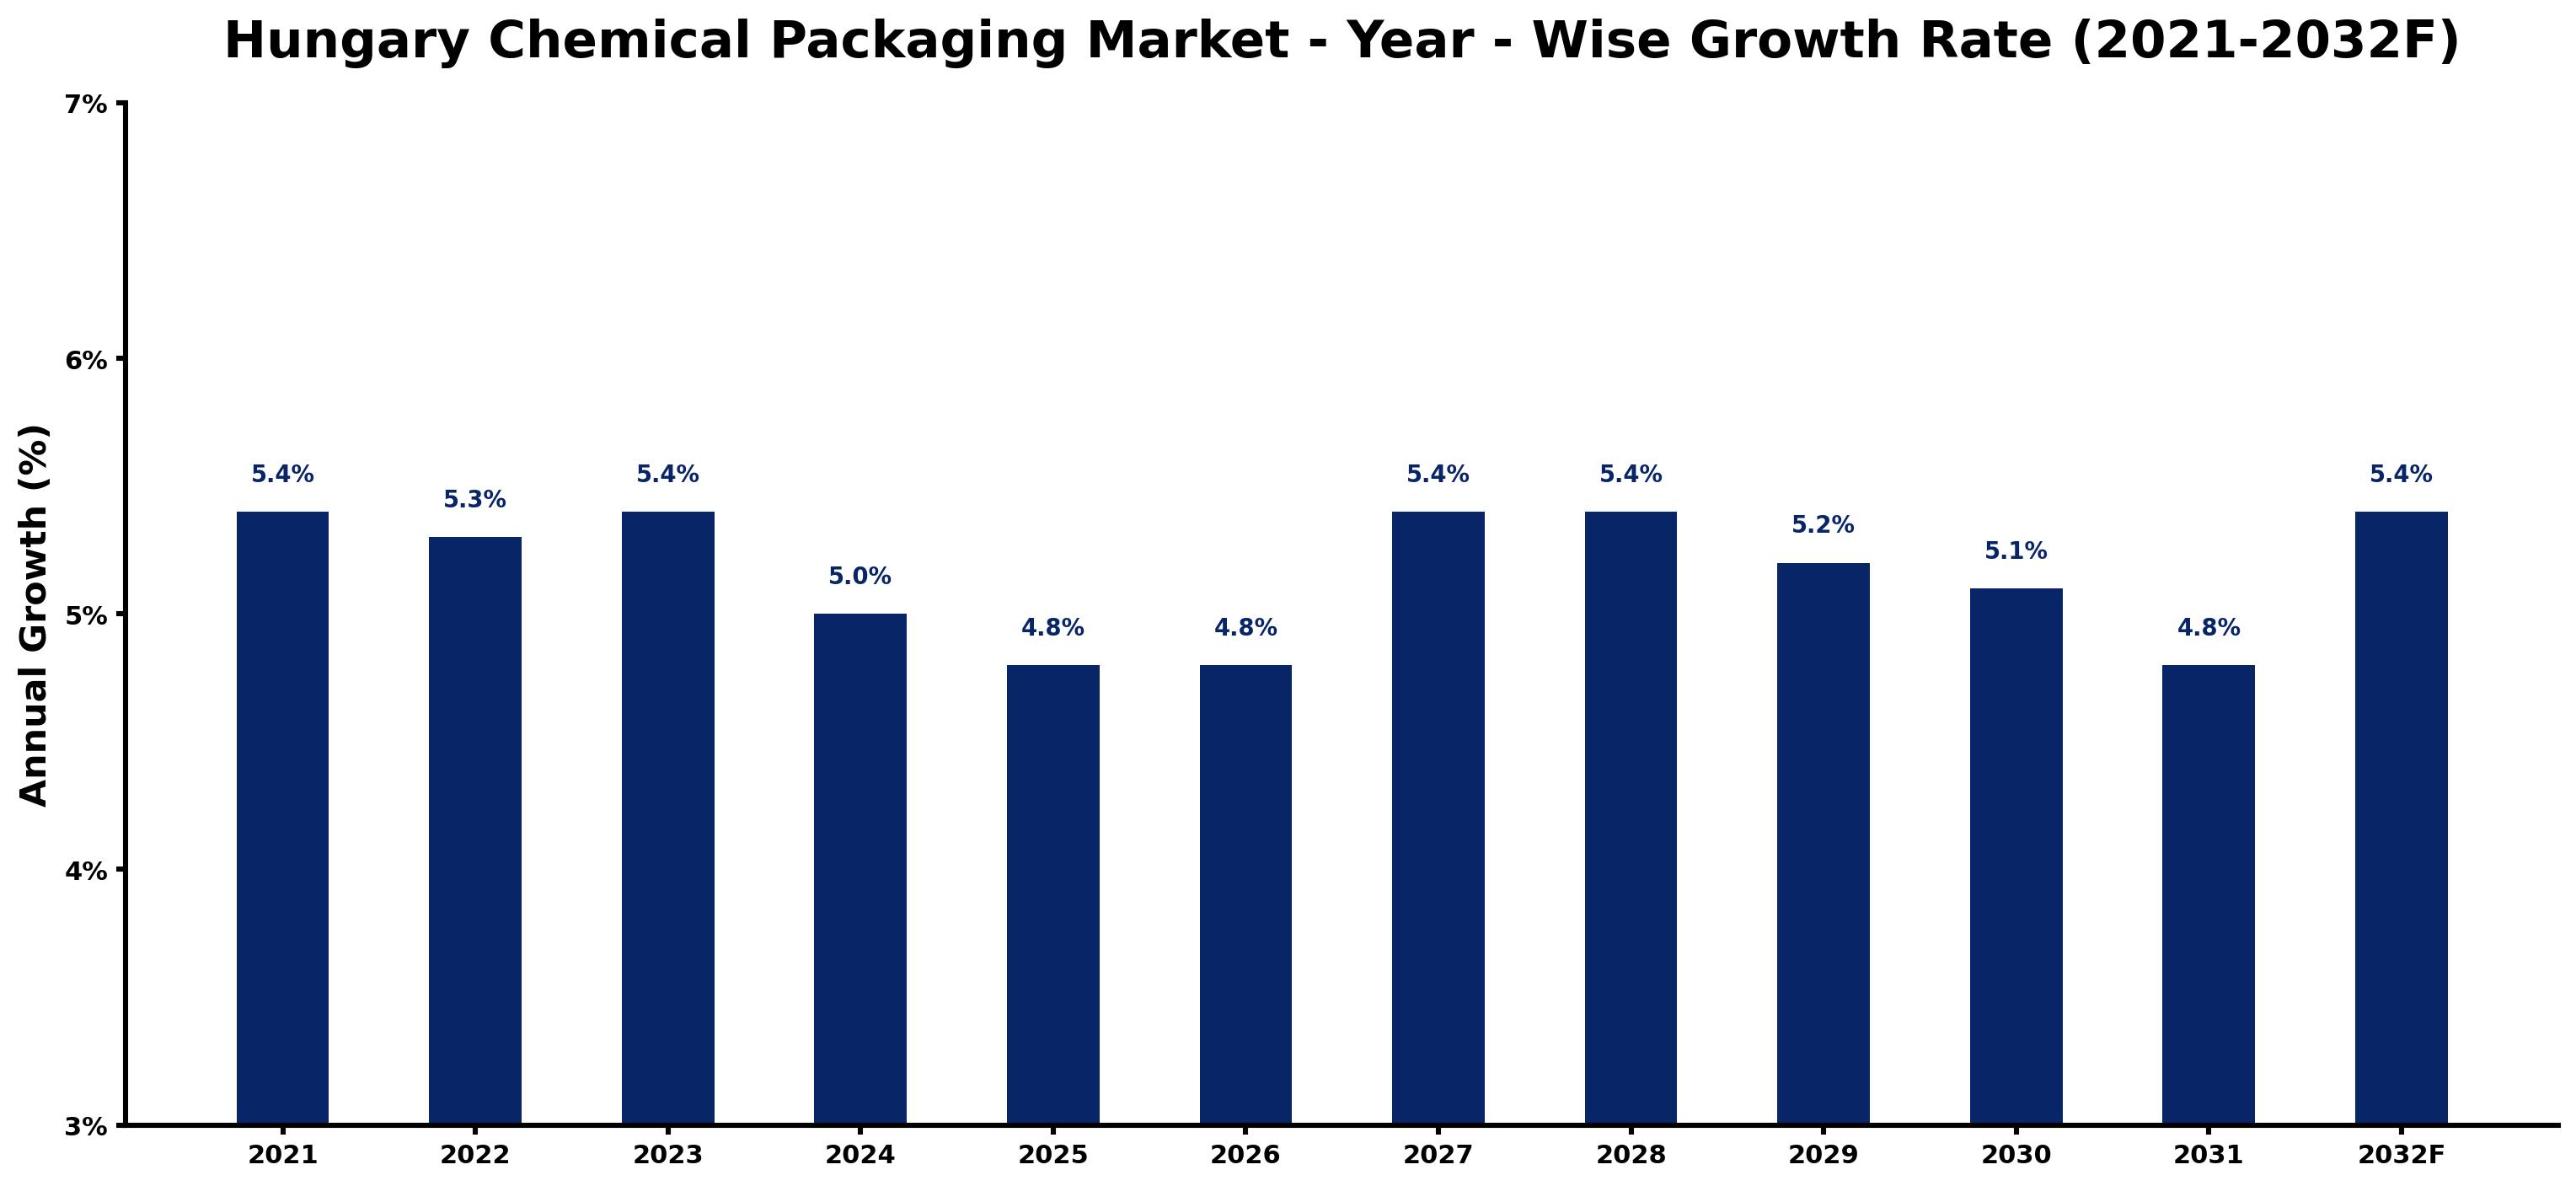
Hungary Chemical Packaging Market Growth Rate Analysis (2021-2032)
The Hungary Chemical Packaging market has shown resilience with a stable growth rate, peaking at 5.4% in both 2021 and 2023, reflecting robust demand from the pharmaceutical and agricultural sectors. However, growth is projected to taper to 4.8% by 2025 due to increased cost pressures and shifting consumer preferences towards sustainable packaging solutions. Investments in digitalization and eco-friendly materials are expected to revitalize the market beyond 2027, with a return to 5.4% growth in subsequent years. Policy support for energy transition initiatives further bolsters the market's adaptability to changing industrial standards, ensuring that the sector remains competitive amidst evolving consumer demands and technological advancements.
Hungary Chemical Packaging Market Year-wise Growth Rate and Key Drivers
This graph highlights how the Hungary Chemical Packaging Market has steadily grown over the past five years, supported by major growth factors.
The table below presents the year wise growth rates along with the key drivers influencing the market
| Year | Growth Rate | Major Drivers |
| 2021 | 5.4% | The chemical sector's recovery initiated after pandemic disruptions fostered packaging innovations. |
| 2022 | 5.3% | Sustainability commitments from major brands emphasized eco-friendly packaging solutions. |
| 2023 | 5.4% | Local manufacturing expansion reduced import dependency, enhancing packaging supply chains locally. |
| 2024 | 5.0% | Emerging technologies in chemical packaging increased efficiency and reduced production costs significantly. |
| 2025 | 4.8% | Increased consumer awareness of environmental issues reshaped packaging design priorities across industries. |
| 2026 | 4.8% | E-commerce growth necessitated robust packaging solutions tailored for diverse transportation needs. |
| 2027 | 5.4% | Investments in advanced materials offered better durability and performance in chemical packaging. |
| 2028 | 5.4% | Competitive pressure among manufacturers spurred rapid innovation in biodegradable packaging options. |
| 2029 | 5.2% | The shift towards circular economy principles influenced packaging recycling initiatives significantly. |
| 2030 | 5.1% | Technological integration in production lines improved operational productivity and reduced waste. |
| 2031 | 4.8% | Growing demand for specialty chemicals prompted customized packaging solutions across different sectors. |
| 2032 | 5.4% | Collaborations between chemical and packaging firms maximized resource efficiency and minimized costs. |
Note - Market size estimations and growth projections presented in this report are based on 6Wresearch's advanced forecasting approach, validated with industry datasets as of June 2026.
Hungary Chemical Packaging Market Synopsis
The Hungary Chemical Packaging Market is projected to reach 4.8% and witness significant growth during the forecast period (2026-2032). This market encompasses the packaging requirements for a variety of chemical products, including agrochemicals, specialty chemicals, and industrial chemicals. The role of packaging in preserving the safety, integrity, and regulatory compliance of these products during their lifecycle is paramount. Current trends indicate a shift towards sustainable packaging materials, the enforcement of stringent regulations, and advancements in packaging technology, which are collectively shaping the market landscape.
Hungary Chemical Packaging Market Growth Drivers
The growth of the Hungary Chemical Packaging Market is predominantly fueled by several key drivers:
- Stringent regulations governing the safe transport and storage of chemicals significantly bolster the demand for specialized packaging solutions. Compliance with these regulations ensures the safe handling of hazardous materials, which is critical in mitigating risks.
- The increasing focus on sustainability is driving manufacturers to seek eco-friendly packaging alternatives. The adoption of biodegradable and recyclable materials is becoming essential in addressing environmental concerns associated with traditional packaging methods.
- Technological advancements in packaging design and manufacturing processes allow for the development of lighter, more efficient packaging solutions. These innovations not only reduce costs but also enhance the safety and longevity of chemical products during transit.
- Growth in end-use sectors such as agriculture, pharmaceuticals, and industrial applications is spurring demand for chemical packaging. Each of these sectors requires tailored packaging solutions to meet specific safety and compliance requirements.
- The ongoing globalization of supply chains necessitates robust packaging solutions that can withstand long-distance transportation. Manufacturers are thus motivated to enhance packaging capabilities to ensure product integrity during longer shipping times.
Hungary Chemical Packaging Market Challenges and Restraints
Despite its growth potential, the Hungary Chemical Packaging Market faces several challenges that could hinder progress:
- Sustainability concerns drive the need for compliance with evolving regulatory standards, which can impose significant costs on manufacturers. Investment in advanced, eco-friendly packaging solutions may not always be financially viable for all companies.
- The complexity of ensuring that packaging solutions meet both safety and environmental standards creates a daunting challenge for producers. Balancing these requirements often results in increased production times and costs.
- Market participants are also faced with the challenge of keeping up with technological advancements. Failing to adopt new technologies can lead to competitive disadvantages and loss of market share.
- As the market evolves, consumer awareness and expectations regarding packaging materials are shifting. Companies must remain agile and responsive to these trends to maintain customer loyalty.
- In addition, logistical challenges related to distribution and storage of chemical products can affect the reliability of supply chains, making it crucial for packaging solutions to be both resilient and adaptable.
Hungary Chemical Packaging Market Government Investment and Initiatives
The Hungarian government actively promotes the chemical packaging sector through various investment initiatives and regulatory measures aimed at enhancing product safety and environmental sustainability. Key aspects of government involvement include:
- Implementation of stringent guidelines for packaging materials that prioritize safety, encouraging manufacturers to innovate and comply with best practices.
- Investment in infrastructure development that supports efficient transportation and storage for chemical products, facilitating better logistics and enhancing market access.
- Financial incentives and subsidies for companies adopting eco-friendly packaging solutions, thereby promoting sustainability within the sector.
- Awareness campaigns aimed at educating manufacturers about the significance of compliance with environmental regulations and the benefits of sustainable packaging.
- Collaboration with industry stakeholders to develop standards that align with international norms, helping Hungarian manufacturers compete on a global scale.
Hungary Chemical Packaging Market Latest Developments (May 2025 - June 2026)
Recent developments within the Hungary Chemical Packaging Market from May 2025 to June 2026 indicate a progressive shift towards sustainability and compliance. The government has intensified efforts to enforce regulations focused on reducing plastic waste and promoting the use of biodegradable materials, thereby pushing manufacturers to adapt their packaging methodologies. Additionally, innovations in smart packaging technology have gained traction, enabling better tracking and monitoring of chemicals throughout the supply chain. Manufacturers are increasingly investing in research and development to enhance packaging efficiency while mitigating environmental impact. Concurrently, industry forums have emerged to facilitate dialogue between stakeholders, focusing on challenges and opportunities within the chemical packaging sector.
Hungary Chemical Packaging Market - Key Attractiveness of the Report
- 10 Years of Market Numbers
- Historical Data Starting from 2022 to 2025
- Base Year: 2025
- Forecast Data until 2032
- Key Performance Indicators Impacting the Market
- Major Upcoming Developments and Projects
Key Highlights of the Report:
- Hungary Chemical Packaging Market Outlook
- Market Size of Hungary Chemical Packaging Market, 2025
- Forecast of Hungary Chemical Packaging Market, 2032
- Historical Data and Forecast of Hungary Chemical Packaging Revenues & Volume for the Period 2022-2032F
- Hungary Chemical Packaging Market Trend Evolution
- Hungary Chemical Packaging Market Drivers and Challenges
- Hungary Chemical Packaging Price Trends
- Hungary Chemical Packaging Porter's Five Forces
- Hungary Chemical Packaging Industry Life Cycle
- Historical Data and Forecast of Hungary Chemical Packaging Market Revenues & Volume By Product Types for the Period 2022-2032F
- Historical Data and Forecast of Hungary Chemical Packaging Market Revenues & Volume By Sacks for the Period 2022-2032F
- Historical Data and Forecast of Hungary Chemical Packaging Market Revenues & Volume By Drums for the Period 2022-2032F
- Historical Data and Forecast of Hungary Chemical Packaging Market Revenues & Volume By FIBC for the Period 2022-2032F
- Historical Data and Forecast of Hungary Chemical Packaging Market Revenues & Volume By Other for the Period 2022-2032F
- Historical Data and Forecast of Hungary Chemical Packaging Market Revenues & Volume By Applications for the Period 2022-2032F
- Historical Data and Forecast of Hungary Chemical Packaging Market Revenues & Volume By Pharmaceutical Factory? for the Period 2022-2032F
- Historical Data and Forecast of Hungary Chemical Packaging Market Revenues & Volume By Laboratory for the Period 2022-2032F
- Historical Data and Forecast of Hungary Chemical Packaging Market Revenues & Volume By Chemical Plant? for the Period 2022-2032F
- Historical Data and Forecast of Hungary Chemical Packaging Market Revenues & Volume By Others for the Period 2022-2032F
- Hungary Chemical Packaging Import Export Trade Statistics
- Market Opportunity Assessment By Product Types
- Market Opportunity Assessment By Applications
- Hungary Chemical Packaging Top Companies Market Share
- Hungary Chemical Packaging Competitive Benchmarking By Technical and Operational Parameters
- Hungary Chemical Packaging Company Profiles
- Hungary Chemical Packaging Key Strategic Recommendations
Frequently Asked Questions About the Market Study (FAQs):
The market is primarily driven by stringent regulations, a focus on sustainability, and advancements in packaging technology.
Manufacturers face challenges related to sustainability compliance, production costs, and the need to innovate in response to market demands.
The government supports the market through regulations, infrastructure investments, and incentives for sustainable practices.
Current trends include the adoption of eco-friendly packaging materials, smart packaging technologies, and increased regulatory compliance.
6Wresearch actively monitors the Hungary Chemical Packaging Market and publishes its comprehensive annual report, highlighting emerging trends, growth drivers, revenue analysis, and forecast outlook. Our insights help businesses to make data-backed strategic decisions with ongoing market dynamics. Our analysts track relevent industries related to the Hungary Chemical Packaging Market, allowing our clients with actionable intelligence and reliable forecasts tailored to emerging regional needs.
Yes, we provide customisation as per your requirements. To learn more, feel free to contact us on sales@6wresearch.com
1 Executive Summary |
2 Introduction |
2.1 Key Highlights of the Report |
2.2 Report Description |
2.3 Market Scope & Segmentation |
2.4 Research Methodology |
2.5 Assumptions |
3 Hungary Chemical Packaging Market Overview |
3.1 Hungary Country Macro Economic Indicators |
3.2 Hungary Chemical Packaging Market Revenues & Volume, 2022 & 2032F |
3.3 Hungary Chemical Packaging Market - Industry Life Cycle |
3.4 Hungary Chemical Packaging Market - Porter's Five Forces |
3.5 Hungary Chemical Packaging Market Revenues & Volume Share, By Product Types, 2022 & 2032F |
3.6 Hungary Chemical Packaging Market Revenues & Volume Share, By Applications, 2022 & 2032F |
4 Hungary Chemical Packaging Market Dynamics |
4.1 Impact Analysis |
4.2 Market Drivers |
4.3 Market Restraints |
5 Hungary Chemical Packaging Market Trends |
6 Hungary Chemical Packaging Market, By Types |
6.1 Hungary Chemical Packaging Market, By Product Types |
6.1.1 Overview and Analysis |
6.1.2 Hungary Chemical Packaging Market Revenues & Volume, By Product Types, 2022-2032F |
6.1.3 Hungary Chemical Packaging Market Revenues & Volume, By Sacks, 2022-2032F |
6.1.4 Hungary Chemical Packaging Market Revenues & Volume, By Drums, 2022-2032F |
6.1.5 Hungary Chemical Packaging Market Revenues & Volume, By FIBC, 2022-2032F |
6.1.6 Hungary Chemical Packaging Market Revenues & Volume, By Other, 2022-2032F |
6.2 Hungary Chemical Packaging Market, By Applications |
6.2.1 Overview and Analysis |
6.2.2 Hungary Chemical Packaging Market Revenues & Volume, By Pharmaceutical Factory , 2022-2032F |
6.2.3 Hungary Chemical Packaging Market Revenues & Volume, By Laboratory, 2022-2032F |
6.2.4 Hungary Chemical Packaging Market Revenues & Volume, By Chemical Plant , 2022-2032F |
6.2.5 Hungary Chemical Packaging Market Revenues & Volume, By Others, 2022-2032F |
7 Hungary Chemical Packaging Market Import-Export Trade Statistics |
7.1 Hungary Chemical Packaging Market Export to Major Countries |
7.2 Hungary Chemical Packaging Market Imports from Major Countries |
8 Hungary Chemical Packaging Market Key Performance Indicators |
9 Hungary Chemical Packaging Market - Opportunity Assessment |
9.1 Hungary Chemical Packaging Market Opportunity Assessment, By Product Types, 2022 & 2032F |
9.2 Hungary Chemical Packaging Market Opportunity Assessment, By Applications, 2022 & 2032F |
10 Hungary Chemical Packaging Market - Competitive Landscape |
10.1 Hungary Chemical Packaging Market Revenue Share, By Companies, 2025 |
10.2 Hungary Chemical Packaging Market Competitive Benchmarking, By Operating and Technical Parameters |
11 Company Profiles |
12 Recommendations |
13 Disclaimer |
Global Go To Market Strategy - 2030
Export potential enables firms to identify high-growth global markets with greater confidence by combining advanced trade intelligence with a structured quantitative methodology. The framework analyzes emerging demand trends and country-level import patterns while integrating macroeconomic and trade datasets such as GDP and population forecasts, bilateral import–export flows, tariff structures, elasticity differentials between developed and developing economies, geographic distance, and import demand projections. Using weighted trade values from 2020–2024 as the base period to project country-to-country export potential for 2030, these inputs are operationalized through calculated drivers such as gravity model parameters, tariff impact factors, and projected GDP per-capita growth. Through an analysis of hidden potentials, demand hotspots, and market conditions that are most favorable to success, this method enables firms to focus on target countries, maximize returns, and global expansion with data, backed by accuracy.
By factoring in the projected importer demand gap that is currently unmet and could be potential opportunity, it identifies the potential for the Exporter (Country) among 190 countries, against the general trade analysis, which identifies the biggest importer or exporter.
To discover high-growth global markets and optimize your business strategy:
Click Here
Pricing
- Single User License$ 1,995
- Department License$ 2,400
- Site License$ 3,120
- Global License$ 3,795

Leadership Perspectives from Industry Events
Search
Thought Leadership and Analyst Meet


Our Clients
6WResearch In News
- India Air Conditioner Market Set for Strong Rebound in 2026 After Weather-Led Correction and GST-Driven Recovery: 6Wresearch
- ADAS in India: How Automatic Emergency Braking, Blind Spot Detection & Driver Monitoring are Transforming Road Safety
- Doha a strategic location for EV manufacturing hub: IPA Qatar
- Demand for luxury TVs surging in the GCC, says Samsung
- Empowering Growth: The Thriving Journey of Bangladesh’s Cable Industry
- Demand for luxury TVs surging in the GCC, says Samsung
Latest Reports
- Poland Fire Protection Systems Market (2026-2032)
- Cape Verde Portable Hand-Thrown Extinguisher Market (2026-2032)
- Canada Portable Hand-Thrown Extinguisher Market (2026-2032)
- Cameroon Portable Hand-Thrown Extinguisher Market (2026-2032)
- Burundi Portable Hand-Thrown Extinguisher Market (2026-2032)
- Burkina Faso Portable Hand-Thrown Extinguisher Market (2026-2032)
- Bulgaria Portable Hand-Thrown Extinguisher Market (2026-2032)
- Brunei Portable Hand-Thrown Extinguisher Market (2026-2032)
- Botswana Portable Hand-Thrown Extinguisher Market (2026-2032)
- Bosnia and Herzegovina Portable Hand-Thrown Extinguisher Market (2026-2032)
Industry Events and Analyst Meet

HIMTEX 2026

India Refining Summit 2026

India EV Show 2026

EV tech India Expo 2026

Auto Tech Asia 2026
Whitepaper
- Middle East & Africa Commercial Security Market Click here to view more.
- Middle East & Africa Fire Safety Systems & Equipment Market Click here to view more.
- GCC Drone Market Click here to view more.
- Middle East Lighting Fixture Market Click here to view more.
- GCC Physical & Perimeter Security Market Click here to view more.