Hungary Permanent Magnet Market (2026-2032) | Competitive Landscape, Trends, Industry, Companies, Outlook, Analysis, Forecast, Value, Segmentation, Growth, Share, Size & Revenue
Market Forecast By Type (Neodymium Iron Boron Magnets, Ferrite Magnets, Samarium Cobalt Magnets, Alnico Magnets, Others), By End-Use (Consumer Electronics, General Industrial, Automotive, Medical Technology, Environment & Energy, Aerospace & Defense, Others) And Competitive Landscape
| Product Code: ETC7507364 | Publication Date: Sep 2024 | Updated Date: Apr 2026 | Product Type: Market Research Report | |
| Publisher: 6Wresearch | Author: Shubham Padhi | No. of Pages: 75 | No. of Figures: 35 | No. of Tables: 20 |
Hungary Permanent Magnet Market Size (2020-2030)
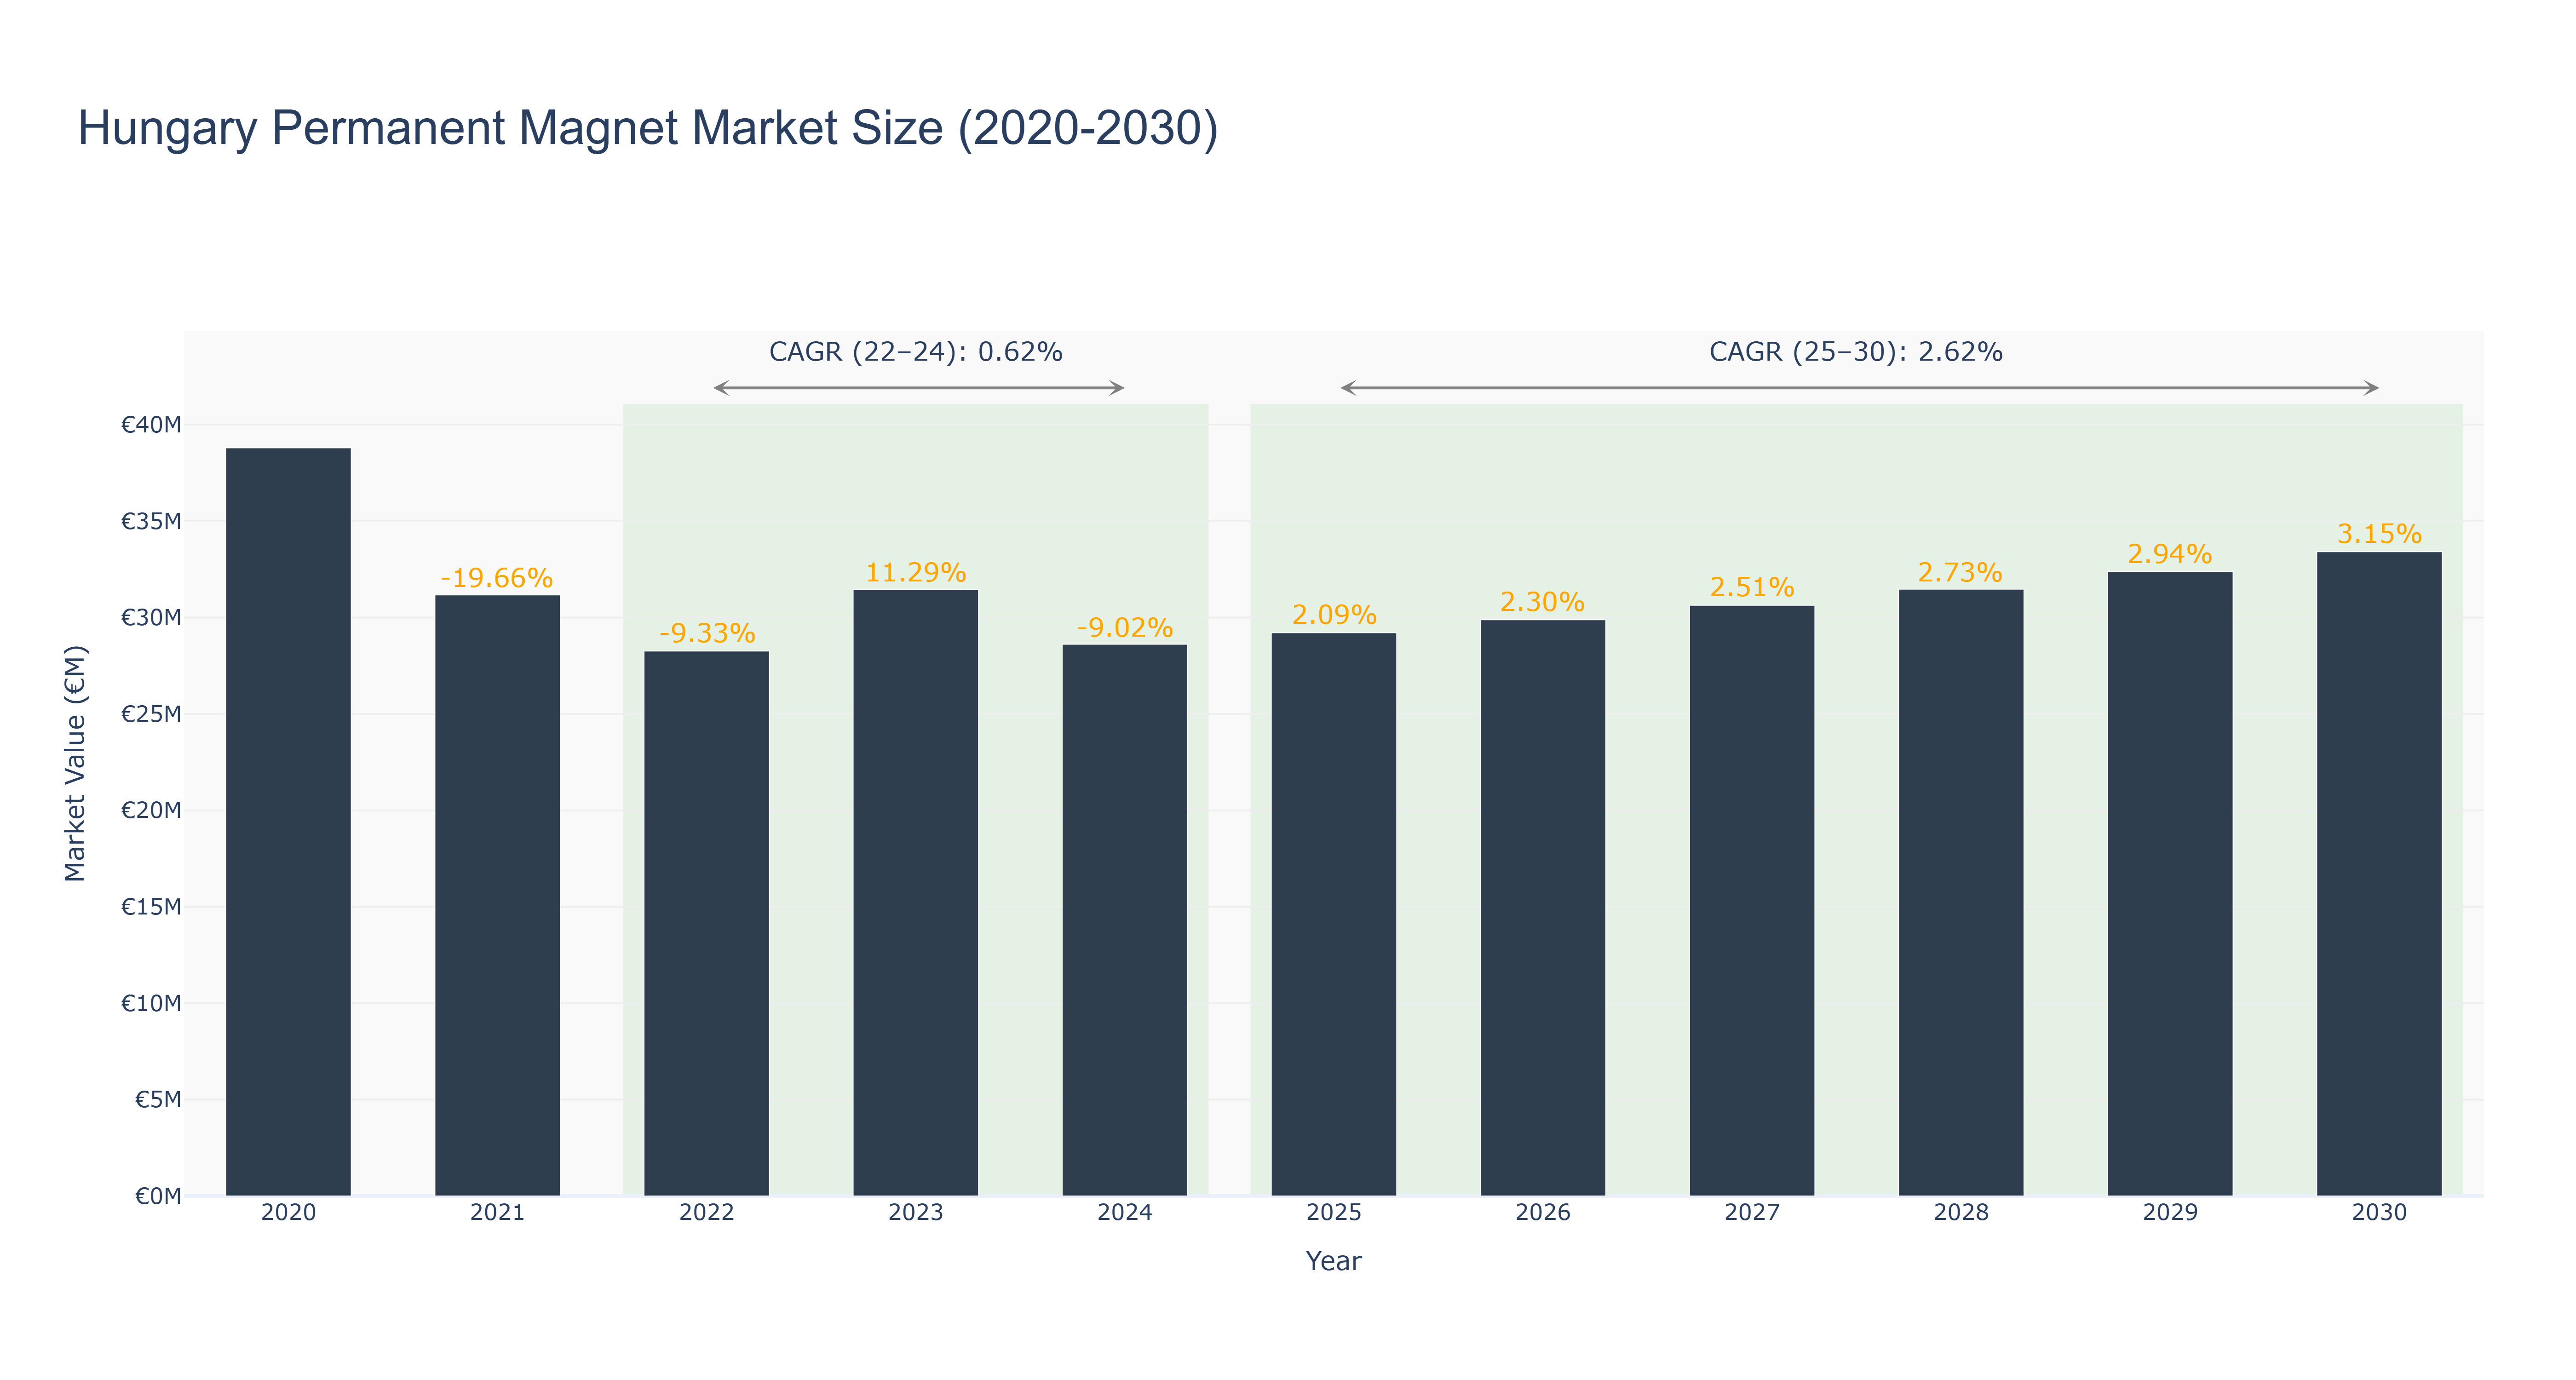
Hungary Permanent Magnet Market has shown a fluctuating trend over the past decade. The peak market size of €38.80 million was recorded in 2020, followed by a decline to €28.26 million in 2022. This downward trend was attributed to external economic factors impacting demand. However, the market has since rebounded with a forecasted growth trajectory, reaching €33.42 million in 2030. The CAGR for 2022-24 was 0.62%, reflecting a slow recovery, while the CAGR for 2025-30 is projected at 2.62%, indicating a more robust growth phase. Industry drivers such as technological advancements in the energy sector and increased focus on sustainability are expected to propel market expansion. Looking ahead, Hungary is set to launch a national initiative promoting renewable energy sources, which is anticipated to further boost the Permanent Magnet Market in the country.
Hungary Permanent Magnet Market: Production & Trade Performance (2019-2025)
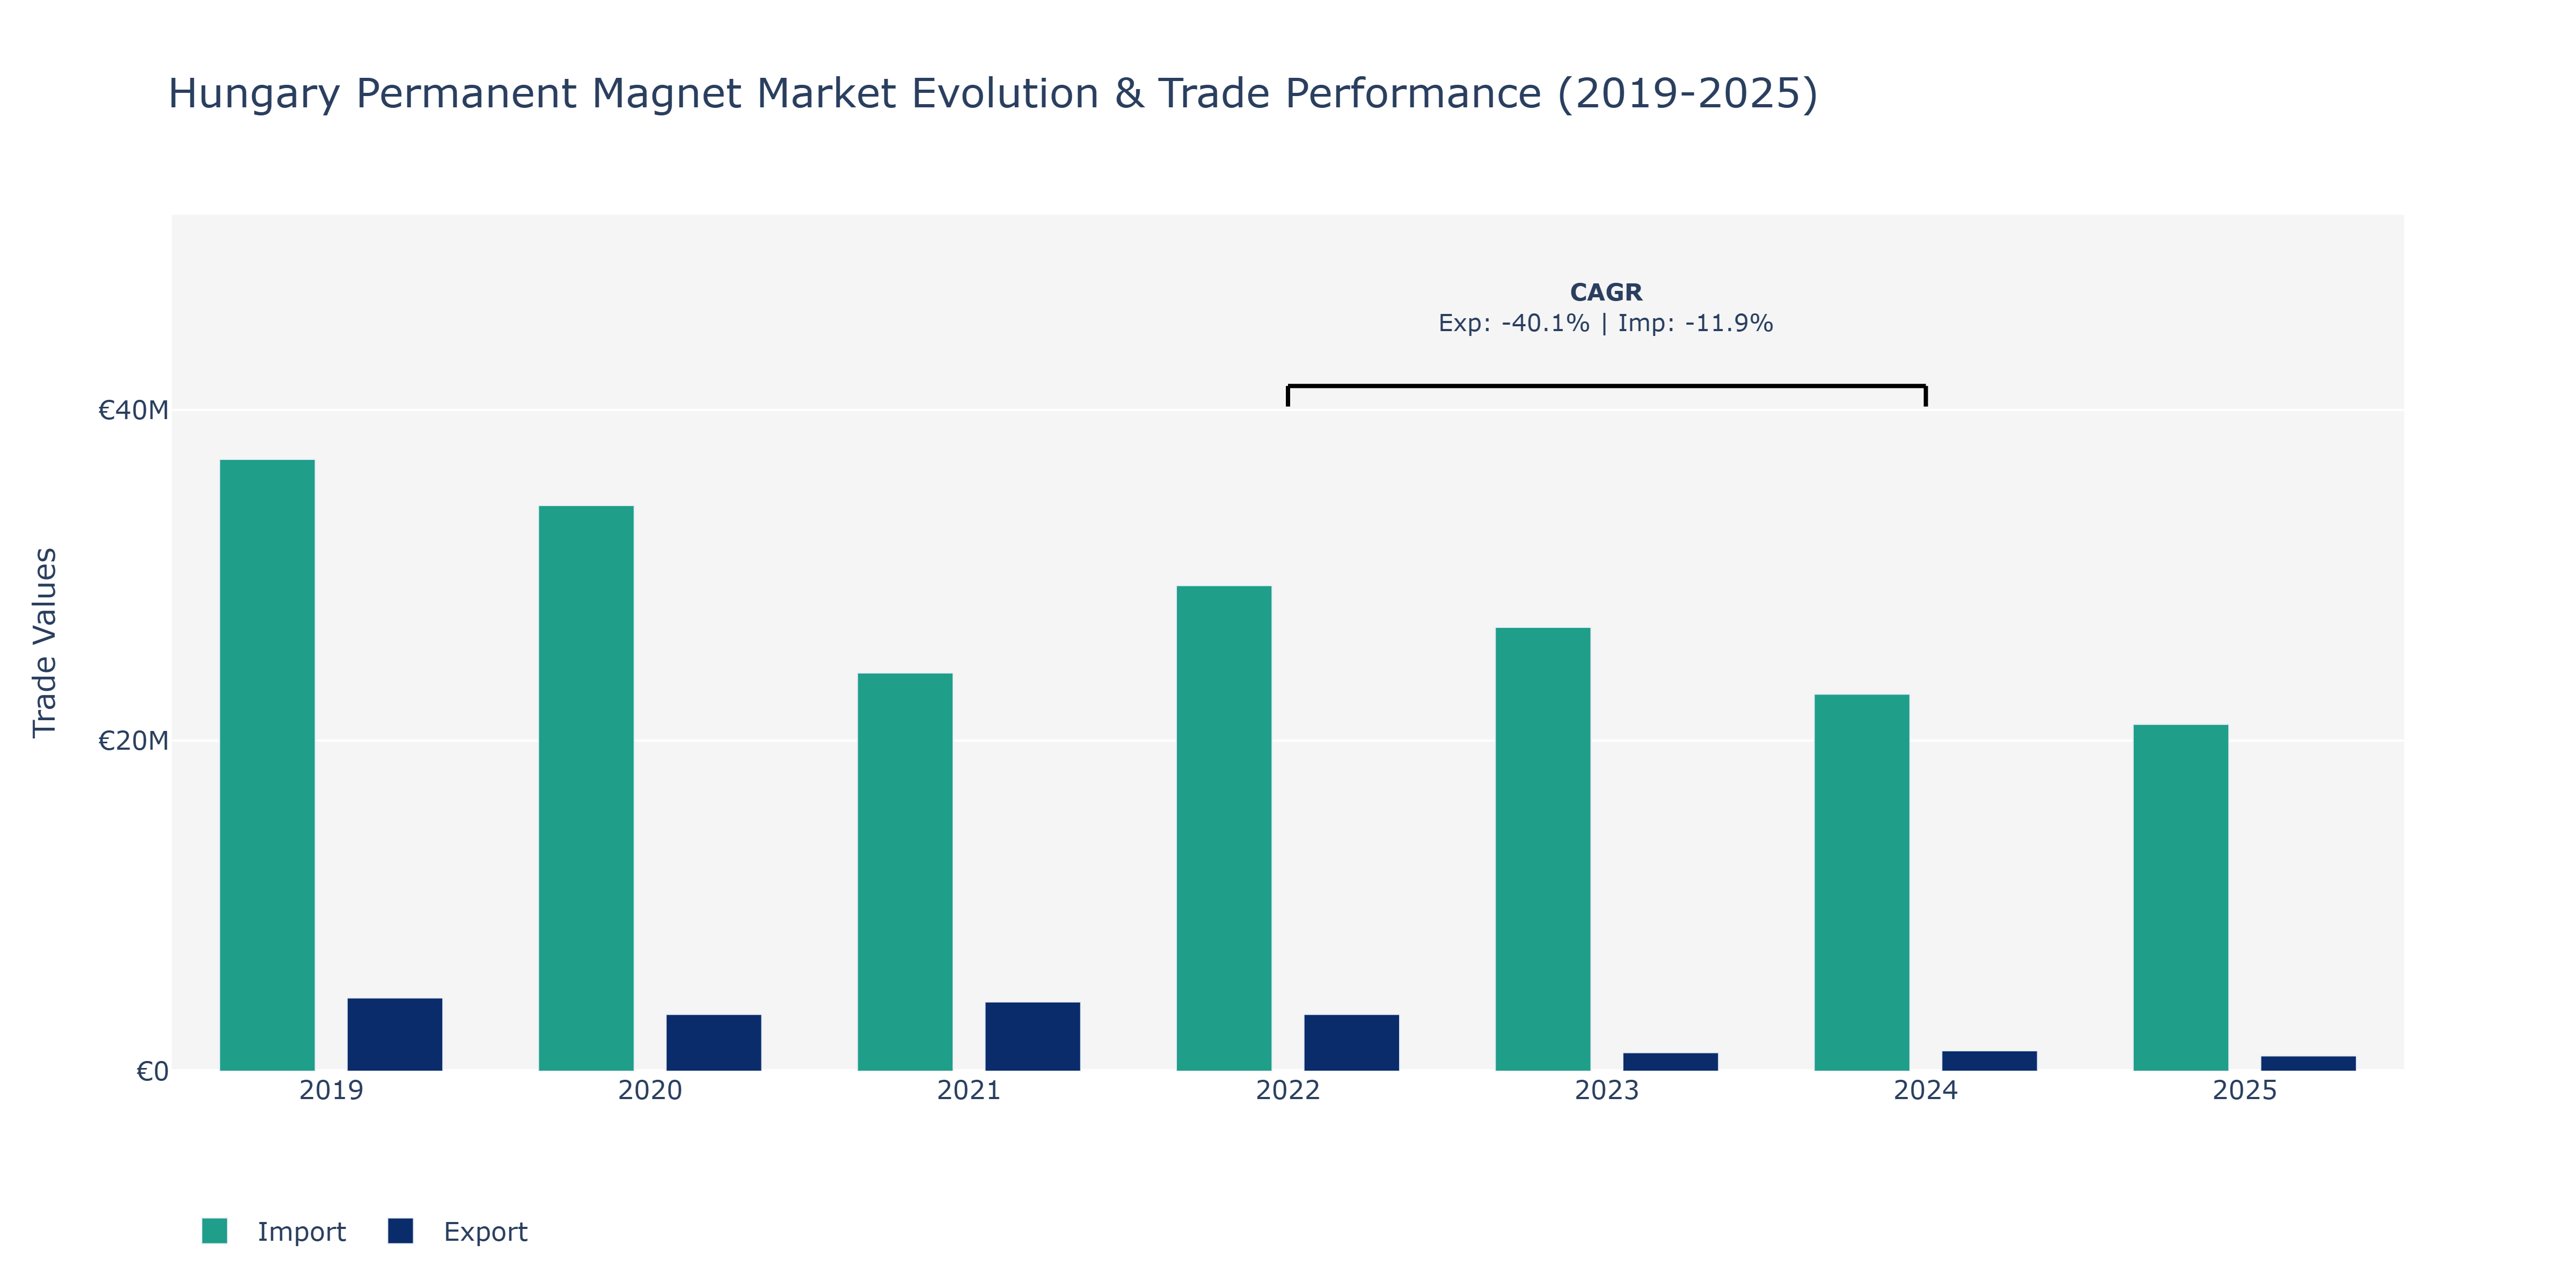
In the Hungary Permanent Magnet Market, exports experienced fluctuations over the years, starting at €4.43 million in 2019, dipping to €3.43 million in 2020, before recovering to €4.19 million in 2021. However, a significant decline was noted in 2023 and 2024 to €1.12 million and €1.23 million, respectively. Imports followed a similar trend, peaking at €37.01 million in 2019, dropping to €34.22 million in 2020, and further decreasing to €24.09 million in 2021. A slight uptick occurred in 2022 before declining again in 2023 and 2024. These fluctuations in exports and imports can be attributed to global economic conditions impacting demand and supply chains, changes in trade policies affecting cross-border transactions, and fluctuations in raw material prices influencing production costs. The decline in exports may also reflect shifts in consumer preferences or shifts in the competitive landscape of the permanent magnet industry.
Key Highlights of the Report:
- Hungary Permanent Magnet Market Outlook
- Market Size of Hungary Permanent Magnet Market, 2025
- Forecast of Hungary Permanent Magnet Market, 2032
- Historical Data and Forecast of Hungary Permanent Magnet Revenues & Volume for the Period 2022-2032F
- Hungary Permanent Magnet Market Trend Evolution
- Hungary Permanent Magnet Market Drivers and Challenges
- Hungary Permanent Magnet Price Trends
- Hungary Permanent Magnet Porter's Five Forces
- Hungary Permanent Magnet Industry Life Cycle
- Historical Data and Forecast of Hungary Permanent Magnet Market Revenues & Volume By Type for the Period 2022-2032F
- Historical Data and Forecast of Hungary Permanent Magnet Market Revenues & Volume By Neodymium Iron Boron Magnets for the Period 2022-2032F
- Historical Data and Forecast of Hungary Permanent Magnet Market Revenues & Volume By Ferrite Magnets for the Period 2022-2032F
- Historical Data and Forecast of Hungary Permanent Magnet Market Revenues & Volume By Samarium Cobalt Magnets for the Period 2022-2032F
- Historical Data and Forecast of Hungary Permanent Magnet Market Revenues & Volume By Alnico Magnets for the Period 2022-2032F
- Historical Data and Forecast of Hungary Permanent Magnet Market Revenues & Volume By Others for the Period 2022-2032F
- Historical Data and Forecast of Hungary Permanent Magnet Market Revenues & Volume By End-Use for the Period 2022-2032F
- Historical Data and Forecast of Hungary Permanent Magnet Market Revenues & Volume By Consumer Electronics for the Period 2022-2032F
- Historical Data and Forecast of Hungary Permanent Magnet Market Revenues & Volume By General Industrial for the Period 2022-2032F
- Historical Data and Forecast of Hungary Permanent Magnet Market Revenues & Volume By Automotive for the Period 2022-2032F
- Historical Data and Forecast of Hungary Permanent Magnet Market Revenues & Volume By Medical Technology for the Period 2022-2032F
- Historical Data and Forecast of Hungary Permanent Magnet Market Revenues & Volume By Environment & Energy for the Period 2022-2032F
- Historical Data and Forecast of Hungary Permanent Magnet Market Revenues & Volume By Aerospace & Defense for the Period 2022-2032F
- Historical Data and Forecast of Hungary Permanent Magnet Market Revenues & Volume By Others for the Period 2022-2032F
- Hungary Permanent Magnet Import Export Trade Statistics
- Market Opportunity Assessment By Type
- Market Opportunity Assessment By End-Use
- Hungary Permanent Magnet Top Companies Market Share
- Hungary Permanent Magnet Competitive Benchmarking By Technical and Operational Parameters
- Hungary Permanent Magnet Company Profiles
- Hungary Permanent Magnet Key Strategic Recommendations
Frequently Asked Questions About the Market Study (FAQs):
6Wresearch actively monitors the Hungary Permanent Magnet Market and publishes its comprehensive annual report, highlighting emerging trends, growth drivers, revenue analysis, and forecast outlook. Our insights help businesses to make data-backed strategic decisions with ongoing market dynamics. Our analysts track relevent industries related to the Hungary Permanent Magnet Market, allowing our clients with actionable intelligence and reliable forecasts tailored to emerging regional needs.
Yes, we provide customisation as per your requirements. To learn more, feel free to contact us on sales@6wresearch.com
1 Executive Summary |
2 Introduction |
2.1 Key Highlights of the Report |
2.2 Report Description |
2.3 Market Scope & Segmentation |
2.4 Research Methodology |
2.5 Assumptions |
3 Hungary Permanent Magnet Market Overview |
3.1 Hungary Country Macro Economic Indicators |
3.2 Hungary Permanent Magnet Market Revenues & Volume, 2022 & 2032F |
3.3 Hungary Permanent Magnet Market - Industry Life Cycle |
3.4 Hungary Permanent Magnet Market - Porter's Five Forces |
3.5 Hungary Permanent Magnet Market Revenues & Volume Share, By Type, 2022 & 2032F |
3.6 Hungary Permanent Magnet Market Revenues & Volume Share, By End-Use, 2022 & 2032F |
4 Hungary Permanent Magnet Market Dynamics |
4.1 Impact Analysis |
4.2 Market Drivers |
4.2.1 Increasing demand for permanent magnets in automotive and electronics industries |
4.2.2 Technological advancements leading to improved efficiency and performance of permanent magnets |
4.2.3 Growing focus on renewable energy sources driving the demand for permanent magnets in wind turbines and electric vehicles |
4.3 Market Restraints |
4.3.1 Fluctuating prices of raw materials used in permanent magnet production |
4.3.2 Intense competition from manufacturers in other countries |
4.3.3 Regulatory challenges related to environmental impact and waste management in permanent magnet production |
5 Hungary Permanent Magnet Market Trends |
6 Hungary Permanent Magnet Market, By Types |
6.1 Hungary Permanent Magnet Market, By Type |
6.1.1 Overview and Analysis |
6.1.2 Hungary Permanent Magnet Market Revenues & Volume, By Type, 2022-2032F |
6.1.3 Hungary Permanent Magnet Market Revenues & Volume, By Neodymium Iron Boron Magnets, 2022-2032F |
6.1.4 Hungary Permanent Magnet Market Revenues & Volume, By Ferrite Magnets, 2022-2032F |
6.1.5 Hungary Permanent Magnet Market Revenues & Volume, By Samarium Cobalt Magnets, 2022-2032F |
6.1.6 Hungary Permanent Magnet Market Revenues & Volume, By Alnico Magnets, 2022-2032F |
6.1.7 Hungary Permanent Magnet Market Revenues & Volume, By Others, 2022-2032F |
6.2 Hungary Permanent Magnet Market, By End-Use |
6.2.1 Overview and Analysis |
6.2.2 Hungary Permanent Magnet Market Revenues & Volume, By Consumer Electronics, 2022-2032F |
6.2.3 Hungary Permanent Magnet Market Revenues & Volume, By General Industrial, 2022-2032F |
6.2.4 Hungary Permanent Magnet Market Revenues & Volume, By Automotive, 2022-2032F |
6.2.5 Hungary Permanent Magnet Market Revenues & Volume, By Medical Technology, 2022-2032F |
6.2.6 Hungary Permanent Magnet Market Revenues & Volume, By Environment & Energy, 2022-2032F |
6.2.7 Hungary Permanent Magnet Market Revenues & Volume, By Aerospace & Defense, 2022-2032F |
7 Hungary Permanent Magnet Market Import-Export Trade Statistics |
7.1 Hungary Permanent Magnet Market Export to Major Countries |
7.2 Hungary Permanent Magnet Market Imports from Major Countries |
8 Hungary Permanent Magnet Market Key Performance Indicators |
8.1 Average selling price of permanent magnets in Hungary |
8.2 Percentage of permanent magnets sourced from domestic suppliers |
8.3 Number of patents filed for new permanent magnet technologies in Hungary |
9 Hungary Permanent Magnet Market - Opportunity Assessment |
9.1 Hungary Permanent Magnet Market Opportunity Assessment, By Type, 2022 & 2032F |
9.2 Hungary Permanent Magnet Market Opportunity Assessment, By End-Use, 2022 & 2032F |
10 Hungary Permanent Magnet Market - Competitive Landscape |
10.1 Hungary Permanent Magnet Market Revenue Share, By Companies, 2025 |
10.2 Hungary Permanent Magnet Market Competitive Benchmarking, By Operating and Technical Parameters |
11 Company Profiles |
12 Recommendations |
13 Disclaimer |
Global Go To Market Strategy - 2030
Export potential enables firms to identify high-growth global markets with greater confidence by combining advanced trade intelligence with a structured quantitative methodology. The framework analyzes emerging demand trends and country-level import patterns while integrating macroeconomic and trade datasets such as GDP and population forecasts, bilateral import–export flows, tariff structures, elasticity differentials between developed and developing economies, geographic distance, and import demand projections. Using weighted trade values from 2020–2024 as the base period to project country-to-country export potential for 2030, these inputs are operationalized through calculated drivers such as gravity model parameters, tariff impact factors, and projected GDP per-capita growth. Through an analysis of hidden potentials, demand hotspots, and market conditions that are most favorable to success, this method enables firms to focus on target countries, maximize returns, and global expansion with data, backed by accuracy.
By factoring in the projected importer demand gap that is currently unmet and could be potential opportunity, it identifies the potential for the Exporter (Country) among 190 countries, against the general trade analysis, which identifies the biggest importer or exporter.
To discover high-growth global markets and optimize your business strategy:
Click Here
Pricing
- Single User License$ 1,995
- Department License$ 2,400
- Site License$ 3,120
- Global License$ 3,795

Leadership Perspectives from Industry Events
Search
Thought Leadership and Analyst Meet


Our Clients
6WResearch In News
- India Air Conditioner Market Set for Strong Rebound in 2026 After Weather-Led Correction and GST-Driven Recovery: 6Wresearch
- ADAS in India: How Automatic Emergency Braking, Blind Spot Detection & Driver Monitoring are Transforming Road Safety
- Doha a strategic location for EV manufacturing hub: IPA Qatar
- Demand for luxury TVs surging in the GCC, says Samsung
- Empowering Growth: The Thriving Journey of Bangladesh’s Cable Industry
- Demand for luxury TVs surging in the GCC, says Samsung
Latest Reports
- Poland Fire Protection Systems Market (2026-2032)
- Cape Verde Portable Hand-Thrown Extinguisher Market (2026-2032)
- Canada Portable Hand-Thrown Extinguisher Market (2026-2032)
- Cameroon Portable Hand-Thrown Extinguisher Market (2026-2032)
- Burundi Portable Hand-Thrown Extinguisher Market (2026-2032)
- Burkina Faso Portable Hand-Thrown Extinguisher Market (2026-2032)
- Bulgaria Portable Hand-Thrown Extinguisher Market (2026-2032)
- Brunei Portable Hand-Thrown Extinguisher Market (2026-2032)
- Botswana Portable Hand-Thrown Extinguisher Market (2026-2032)
- Bosnia and Herzegovina Portable Hand-Thrown Extinguisher Market (2026-2032)
Industry Events and Analyst Meet

HIMTEX 2026

India Refining Summit 2026

India EV Show 2026

EV tech India Expo 2026

Auto Tech Asia 2026
Whitepaper
- Middle East & Africa Commercial Security Market Click here to view more.
- Middle East & Africa Fire Safety Systems & Equipment Market Click here to view more.
- GCC Drone Market Click here to view more.
- Middle East Lighting Fixture Market Click here to view more.
- GCC Physical & Perimeter Security Market Click here to view more.