Hungary Tanning Agents Market (2026-2032) Outlook | Size, Trends, Analysis, Value, Forecast, Companies, Growth, Revenue, Industry & Share
Market Forecast By Type (Inorganic Materials, Aldehyde Tanning Agents, Vegetable Tanning Agents, Other Types), By Application (Leather tanning, Sun Tanning and Personal Care Products, Other Applications) And Competitive Landscape
| Product Code: ETC279739 | Publication Date: Aug 2022 | Updated Date: Apr 2026 | Product Type: Market Research Report | |
| Publisher: 6Wresearch | Author: Ravi Bhandari | No. of Pages: 75 | No. of Figures: 35 | No. of Tables: 20 |
Hungary Tanning Agents Market Size (2020-2030)
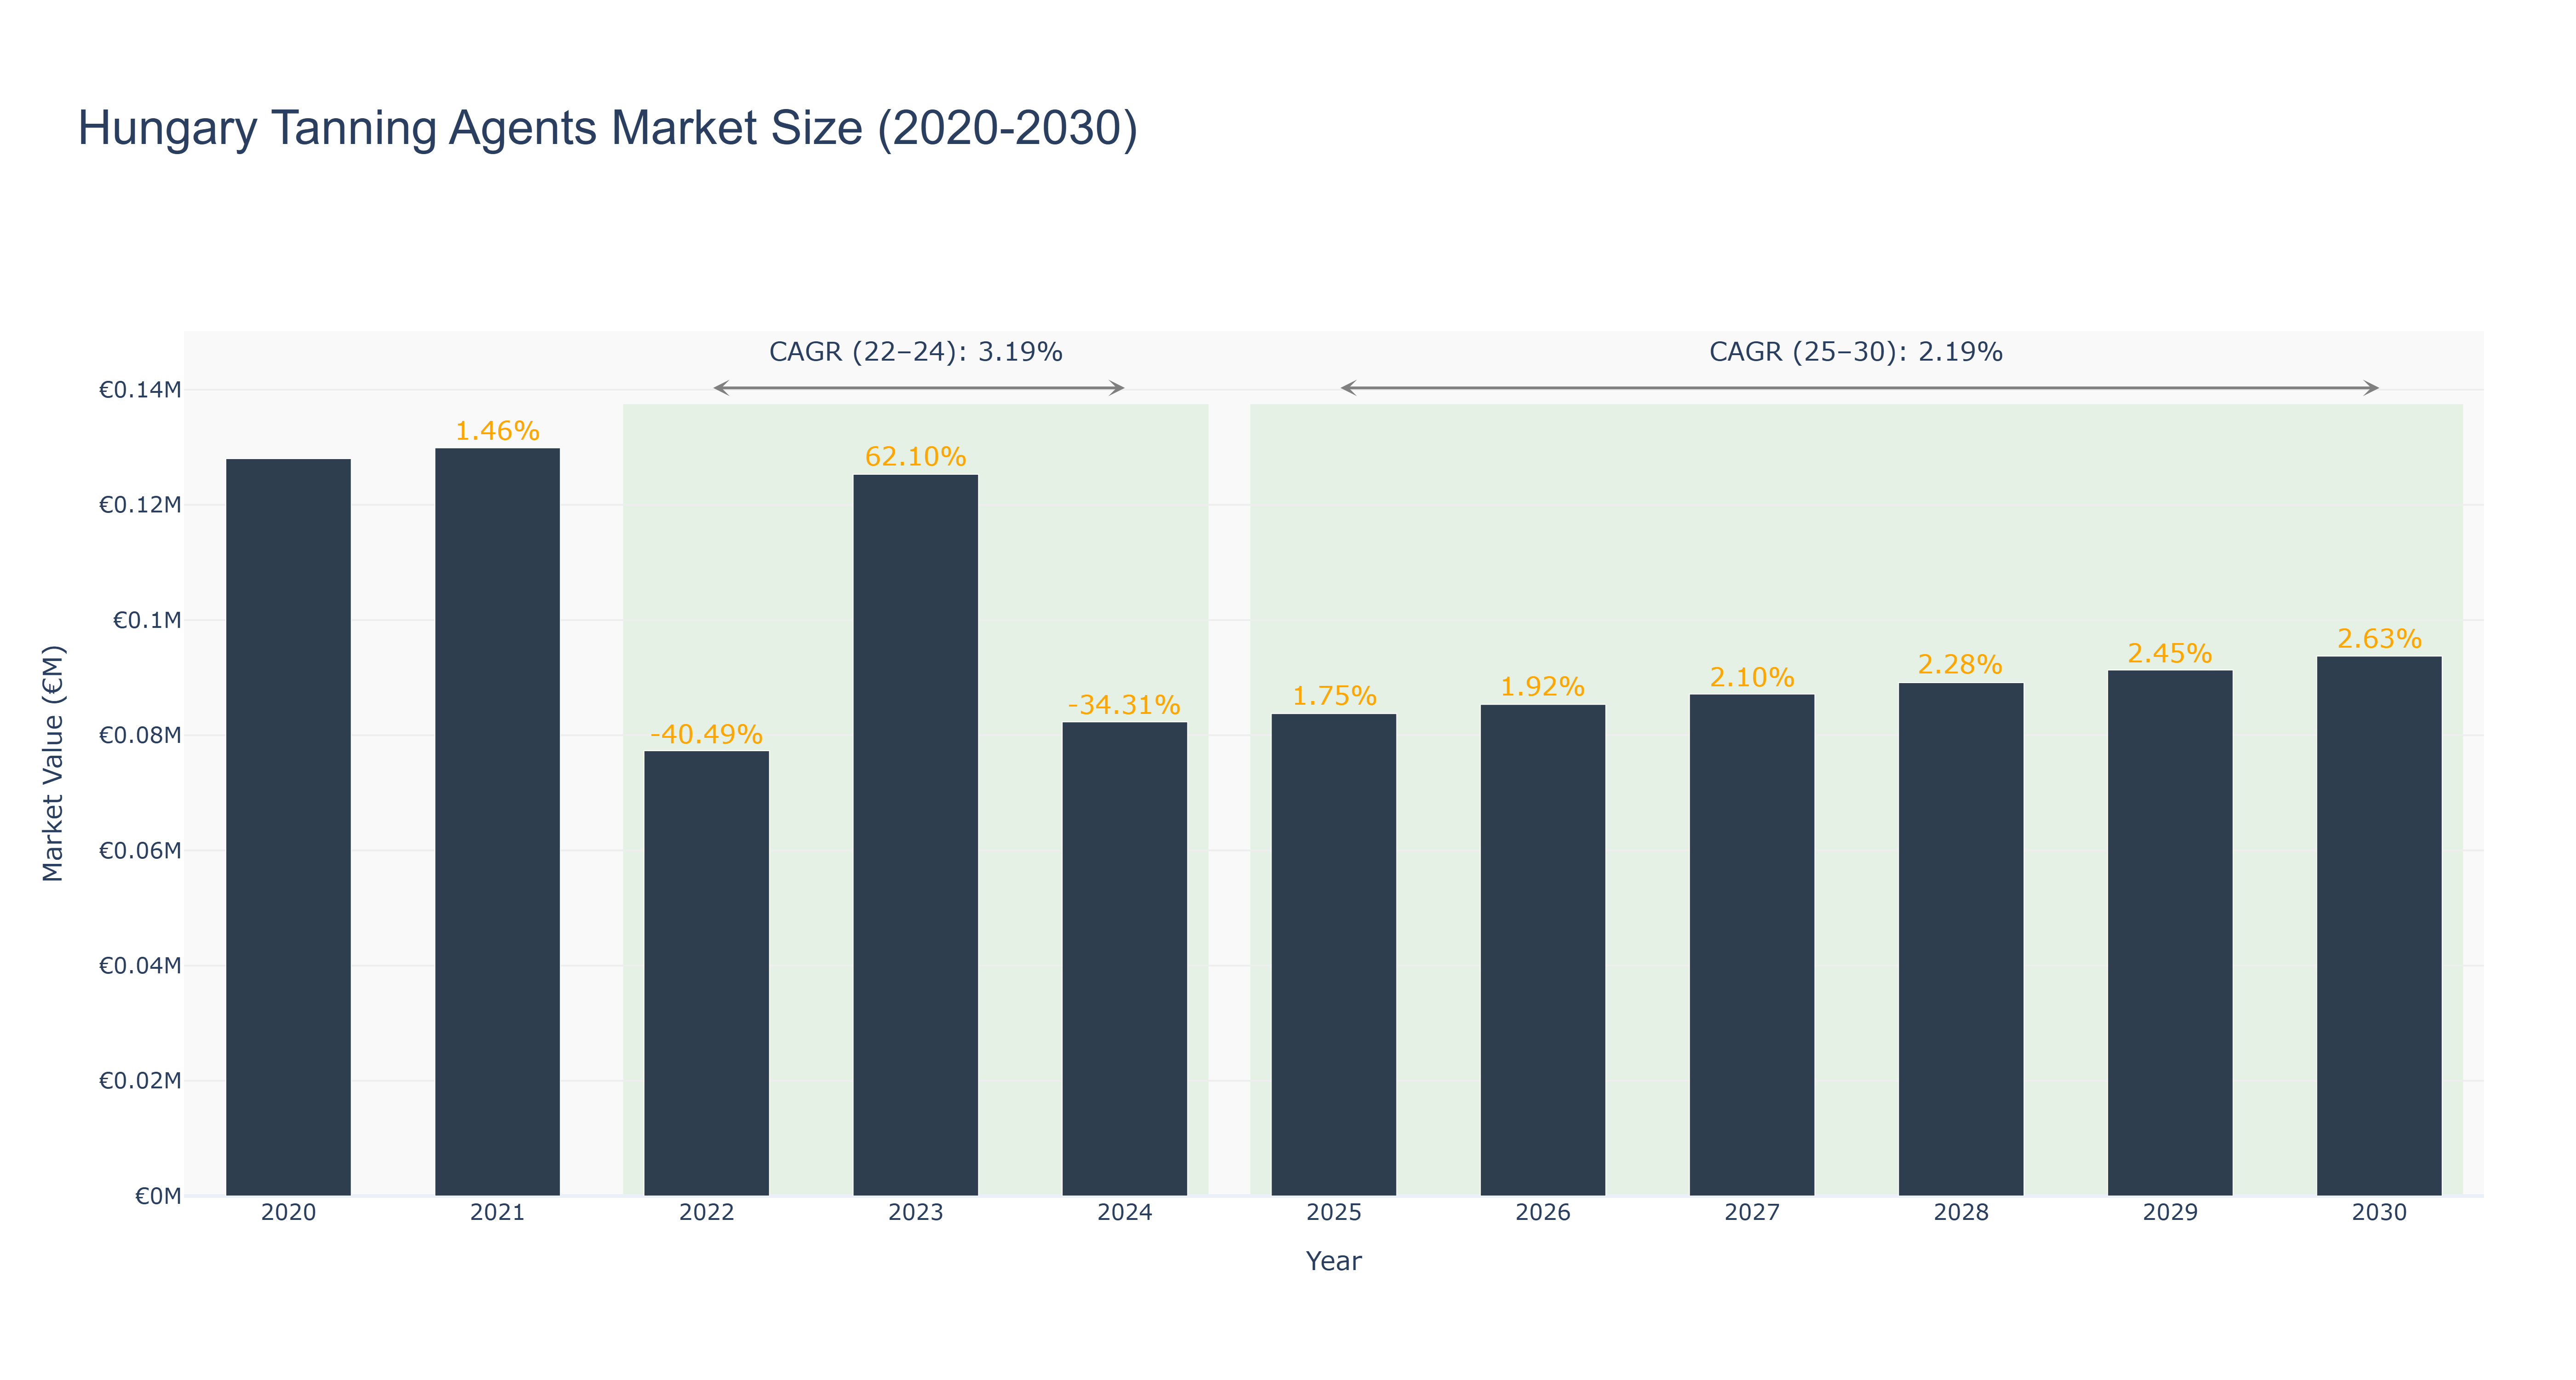
Hungary Tanning Agents Market has shown a fluctuating trend in recent years. The peak market size of €0.13 million was observed in 2021, followed by a decline to €0.08 million in 2022, attributed to a significant negative growth rate of -40.49%. However, the market rebounded in 2023 with a notable growth of 62.10%. From 2025 to 2030, the market is forecasted to maintain a steady growth trajectory with a Compound Annual Growth Rate (CAGR) of 2.18%. The recent increase in market size in 2026 by 1.92% is indicative of the market's resilience and potential for sustained growth. Industry drivers such as increasing demand for organic tanning agents and technological advancements are expected to fuel market expansion. In the near future, Hungary is set to introduce sustainable tanning practices to align with global environmental standards, fostering further growth in the tanning agents market.
Hungary Tanning Agents Market: Production & Trade Performance (2019-2025)
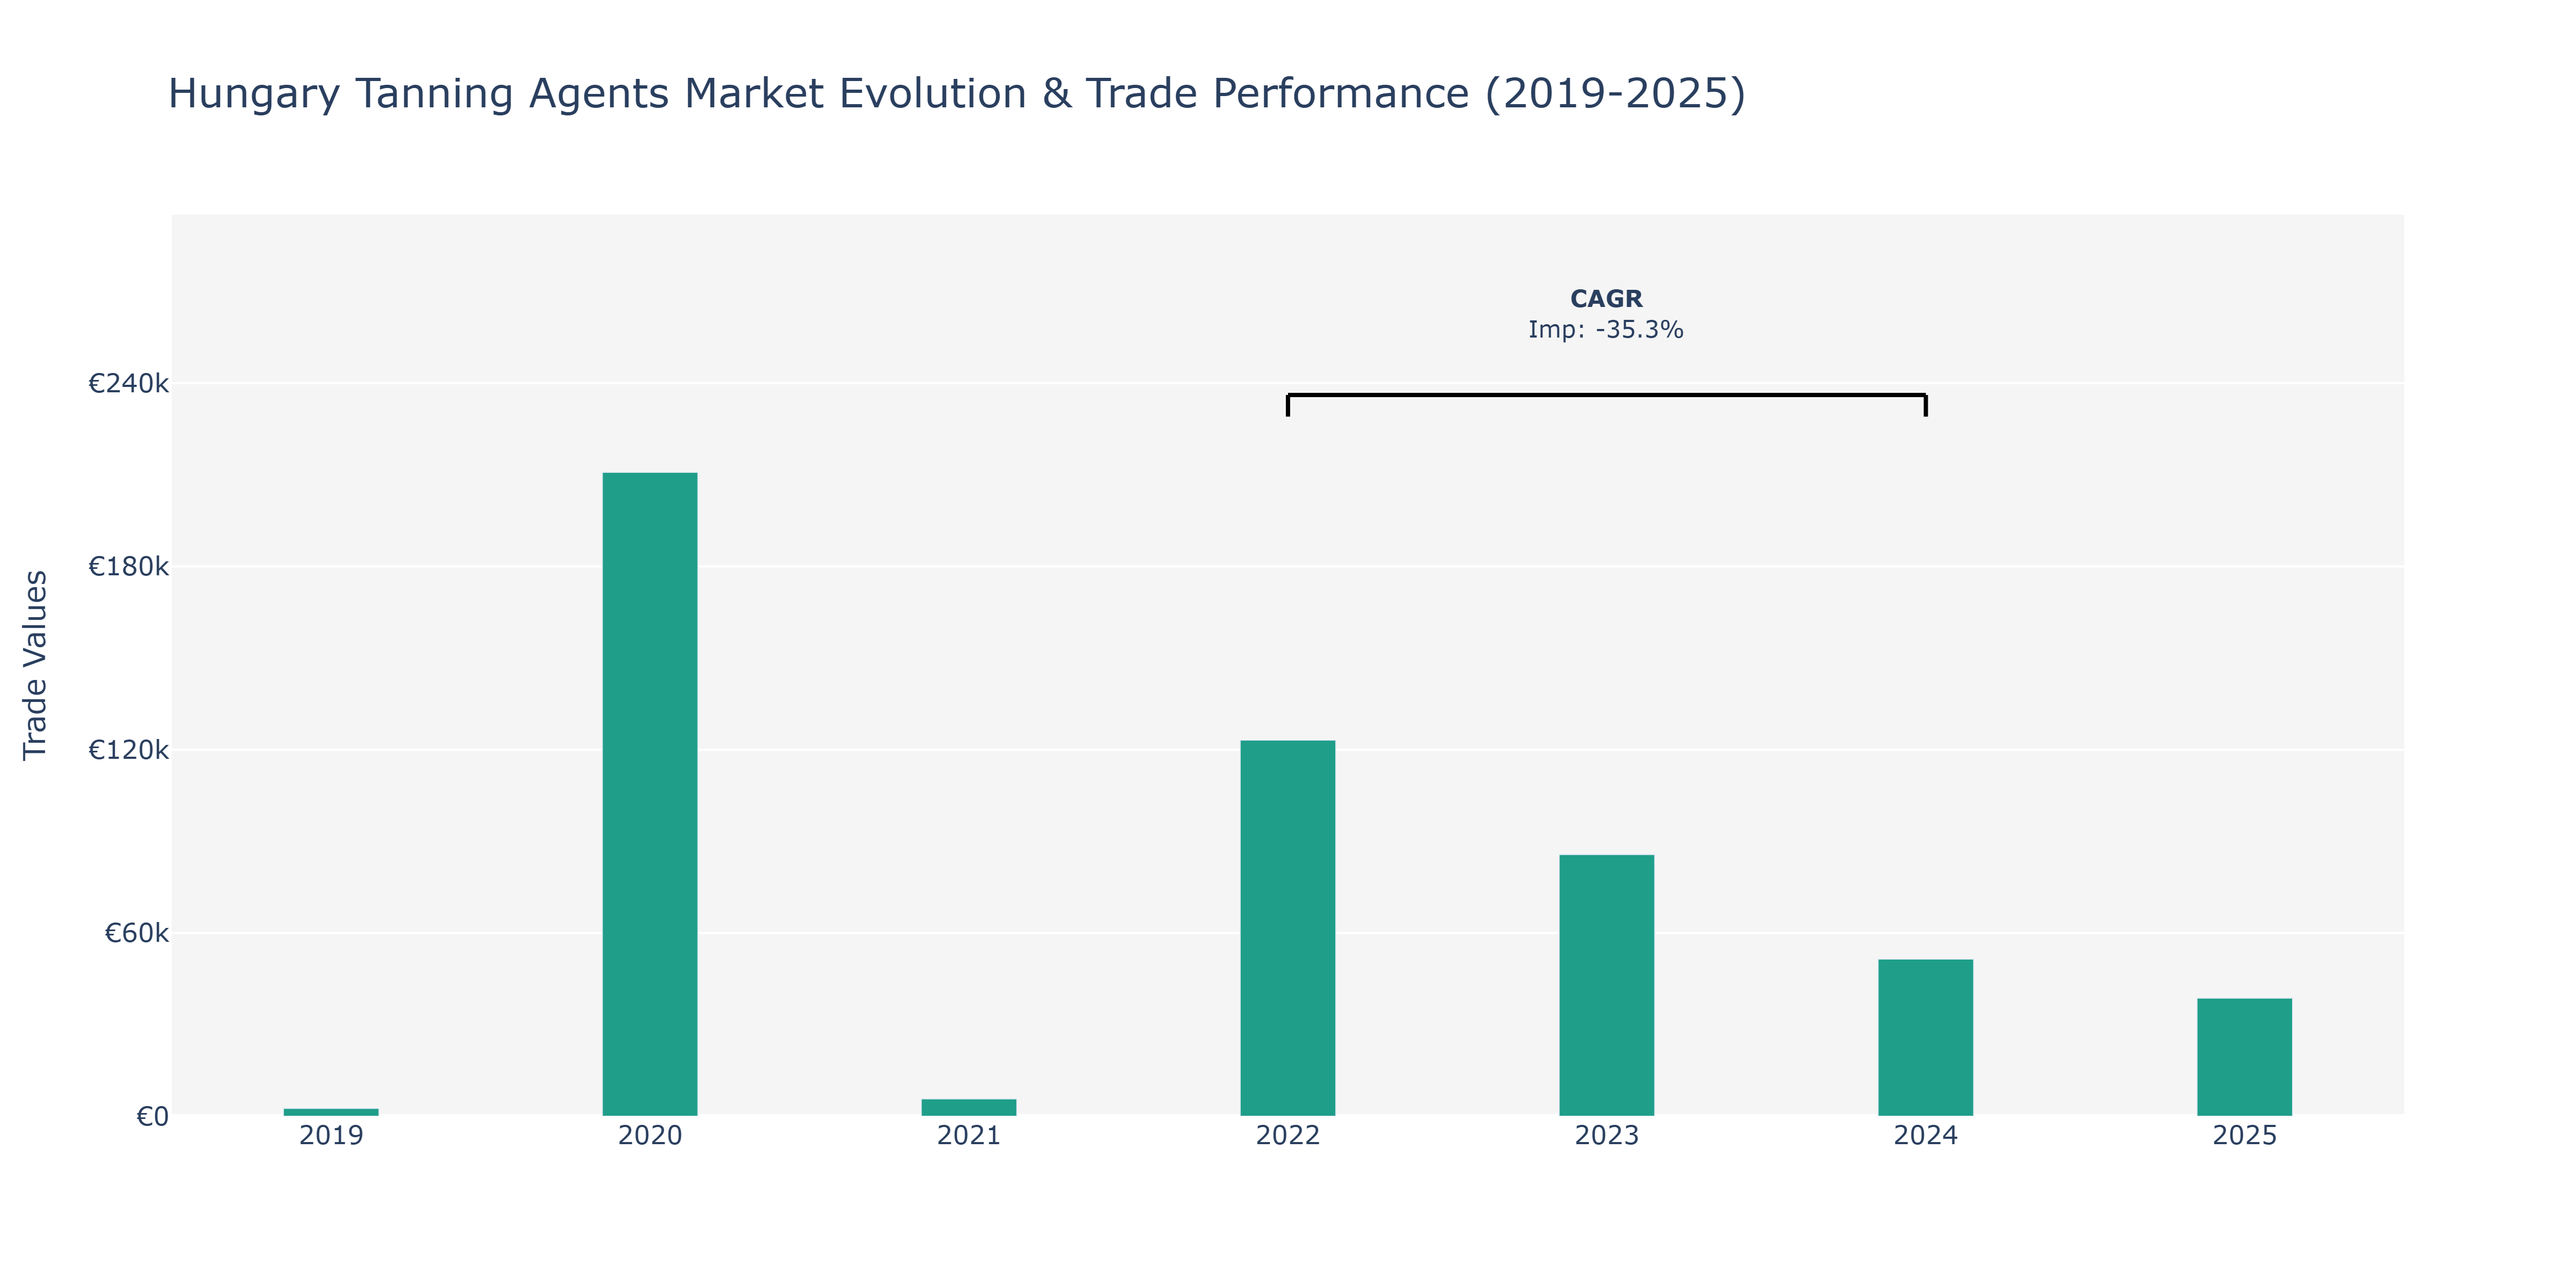
In the Hungary Tanning Agents Market, Imports experienced notable fluctuations over the years. In 2019, imports stood at €2.57 thousand, sharply increasing to €210.81 thousand in 2020, marking a significant surge likely attributed to changing market dynamics or increased demand. Subsequently, imports decreased to €5.69 thousand in 2021, possibly due to supply chain disruptions or regulatory changes impacting trade. The following year, imports saw a substantial decline to €123.15 thousand in 2022, which could be influenced by global economic conditions or shifts in consumer preferences. In 2023 and 2024, imports further decreased to €85.7 thousand and €51.48 thousand, respectively, potentially reflecting ongoing market adjustments or trade policy modifications. By 2025, imports amounted to €38.7 thousand, indicating a continuing downward trend possibly driven by evolving industry standards or technological advancements. The negative CAGR of -35.34% between 2022 and 2024 underscores the market's volatility and the need for stakeholders to adapt to changing market conditions through strategic planning and innovation initiatives.
Key Highlights of the Report:
- Hungary Tanning Agents Market Outlook
- Market Size of Hungary Tanning Agents Market, 2025
- Forecast of Hungary Tanning Agents Market, 2032
- Historical Data and Forecast of Hungary Tanning Agents Revenues & Volume for the Period 2022-2032F
- Hungary Tanning Agents Market Trend Evolution
- Hungary Tanning Agents Market Drivers and Challenges
- Hungary Tanning Agents Price Trends
- Hungary Tanning Agents Porter's Five Forces
- Hungary Tanning Agents Industry Life Cycle
- Historical Data and Forecast of Hungary Tanning Agents Market Revenues & Volume By Type for the Period 2022-2032F
- Historical Data and Forecast of Hungary Tanning Agents Market Revenues & Volume By Inorganic Materials for the Period 2022-2032F
- Historical Data and Forecast of Hungary Tanning Agents Market Revenues & Volume By Aldehyde Tanning Agents for the Period 2022-2032F
- Historical Data and Forecast of Hungary Tanning Agents Market Revenues & Volume By Vegetable Tanning Agents for the Period 2022-2032F
- Historical Data and Forecast of Hungary Tanning Agents Market Revenues & Volume By Other Types for the Period 2022-2032F
- Historical Data and Forecast of Hungary Tanning Agents Market Revenues & Volume By Application for the Period 2022-2032F
- Historical Data and Forecast of Hungary Tanning Agents Market Revenues & Volume By Leather tanning for the Period 2022-2032F
- Historical Data and Forecast of Hungary Tanning Agents Market Revenues & Volume By Sun Tanning and Personal Care Products for the Period 2022-2032F
- Historical Data and Forecast of Hungary Tanning Agents Market Revenues & Volume By Other Applications for the Period 2022-2032F
- Hungary Tanning Agents Import Export Trade Statistics
- Market Opportunity Assessment By Type
- Market Opportunity Assessment By Application
- Hungary Tanning Agents Top Companies Market Share
- Hungary Tanning Agents Competitive Benchmarking By Technical and Operational Parameters
- Hungary Tanning Agents Company Profiles
- Hungary Tanning Agents Key Strategic Recommendations
Frequently Asked Questions About the Market Study (FAQs):
6Wresearch actively monitors the Hungary Tanning Agents Market and publishes its comprehensive annual report, highlighting emerging trends, growth drivers, revenue analysis, and forecast outlook. Our insights help businesses to make data-backed strategic decisions with ongoing market dynamics. Our analysts track relevent industries related to the Hungary Tanning Agents Market, allowing our clients with actionable intelligence and reliable forecasts tailored to emerging regional needs.
Yes, we provide customisation as per your requirements. To learn more, feel free to contact us on sales@6wresearch.com
1 Executive Summary |
2 Introduction |
2.1 Key Highlights of the Report |
2.2 Report Description |
2.3 Market Scope & Segmentation |
2.4 Research Methodology |
2.5 Assumptions |
3 Hungary Tanning Agents Market Overview |
3.1 Hungary Country Macro Economic Indicators |
3.2 Hungary Tanning Agents Market Revenues & Volume, 2022 & 2032F |
3.3 Hungary Tanning Agents Market - Industry Life Cycle |
3.4 Hungary Tanning Agents Market - Porter's Five Forces |
3.5 Hungary Tanning Agents Market Revenues & Volume Share, By Type, 2022 & 2032F |
3.6 Hungary Tanning Agents Market Revenues & Volume Share, By Application, 2022 & 2032F |
4 Hungary Tanning Agents Market Dynamics |
4.1 Impact Analysis |
4.2 Market Drivers |
4.2.1 Increasing demand for leather products in various industries |
4.2.2 Growing awareness about sustainable and eco-friendly tanning agents |
4.2.3 Technological advancements in tanning processes |
4.3 Market Restraints |
4.3.1 Fluctuating raw material prices |
4.3.2 Stringent environmental regulations regarding tanning processes |
4.3.3 Competition from synthetic tanning alternatives |
5 Hungary Tanning Agents Market Trends |
6 Hungary Tanning Agents Market, By Types |
6.1 Hungary Tanning Agents Market, By Type |
6.1.1 Overview and Analysis |
6.1.2 Hungary Tanning Agents Market Revenues & Volume, By Type, 2022 - 2032F |
6.1.3 Hungary Tanning Agents Market Revenues & Volume, By Inorganic Materials, 2022 - 2032F |
6.1.4 Hungary Tanning Agents Market Revenues & Volume, By Aldehyde Tanning Agents, 2022 - 2032F |
6.1.5 Hungary Tanning Agents Market Revenues & Volume, By Vegetable Tanning Agents, 2022 - 2032F |
6.1.6 Hungary Tanning Agents Market Revenues & Volume, By Other Types, 2022 - 2032F |
6.2 Hungary Tanning Agents Market, By Application |
6.2.1 Overview and Analysis |
6.2.2 Hungary Tanning Agents Market Revenues & Volume, By Leather tanning, 2022 - 2032F |
6.2.3 Hungary Tanning Agents Market Revenues & Volume, By Sun Tanning and Personal Care Products, 2022 - 2032F |
6.2.4 Hungary Tanning Agents Market Revenues & Volume, By Other Applications, 2022 - 2032F |
7 Hungary Tanning Agents Market Import-Export Trade Statistics |
7.1 Hungary Tanning Agents Market Export to Major Countries |
7.2 Hungary Tanning Agents Market Imports from Major Countries |
8 Hungary Tanning Agents Market Key Performance Indicators |
8.1 Adoption rate of eco-friendly tanning agents in the Hungarian market |
8.2 Investment in research and development for tanning agent innovations |
8.3 Compliance with environmental standards and certifications |
8.4 Consumer perception and preference towards leather products processed with eco-friendly tanning agents |
9 Hungary Tanning Agents Market - Opportunity Assessment |
9.1 Hungary Tanning Agents Market Opportunity Assessment, By Type, 2022 & 2032F |
9.2 Hungary Tanning Agents Market Opportunity Assessment, By Application, 2022 & 2032F |
10 Hungary Tanning Agents Market - Competitive Landscape |
10.1 Hungary Tanning Agents Market Revenue Share, By Companies, 2025 |
10.2 Hungary Tanning Agents Market Competitive Benchmarking, By Operating and Technical Parameters |
11 Company Profiles |
12 Recommendations |
13 Disclaimer |
Global Go To Market Strategy - 2030
Export potential enables firms to identify high-growth global markets with greater confidence by combining advanced trade intelligence with a structured quantitative methodology. The framework analyzes emerging demand trends and country-level import patterns while integrating macroeconomic and trade datasets such as GDP and population forecasts, bilateral import–export flows, tariff structures, elasticity differentials between developed and developing economies, geographic distance, and import demand projections. Using weighted trade values from 2020–2024 as the base period to project country-to-country export potential for 2030, these inputs are operationalized through calculated drivers such as gravity model parameters, tariff impact factors, and projected GDP per-capita growth. Through an analysis of hidden potentials, demand hotspots, and market conditions that are most favorable to success, this method enables firms to focus on target countries, maximize returns, and global expansion with data, backed by accuracy.
By factoring in the projected importer demand gap that is currently unmet and could be potential opportunity, it identifies the potential for the Exporter (Country) among 190 countries, against the general trade analysis, which identifies the biggest importer or exporter.
To discover high-growth global markets and optimize your business strategy:
Click Here
Pricing
- Single User License$ 1,995
- Department License$ 2,400
- Site License$ 3,120
- Global License$ 3,795

Leadership Perspectives from Industry Events
Search
Thought Leadership and Analyst Meet


Our Clients
6WResearch In News
- India Air Conditioner Market Set for Strong Rebound in 2026 After Weather-Led Correction and GST-Driven Recovery: 6Wresearch
- ADAS in India: How Automatic Emergency Braking, Blind Spot Detection & Driver Monitoring are Transforming Road Safety
- Doha a strategic location for EV manufacturing hub: IPA Qatar
- Demand for luxury TVs surging in the GCC, says Samsung
- Empowering Growth: The Thriving Journey of Bangladesh’s Cable Industry
- Demand for luxury TVs surging in the GCC, says Samsung
Latest Reports
- Poland Fire Protection Systems Market (2026-2032)
- Cape Verde Portable Hand-Thrown Extinguisher Market (2026-2032)
- Canada Portable Hand-Thrown Extinguisher Market (2026-2032)
- Cameroon Portable Hand-Thrown Extinguisher Market (2026-2032)
- Burundi Portable Hand-Thrown Extinguisher Market (2026-2032)
- Burkina Faso Portable Hand-Thrown Extinguisher Market (2026-2032)
- Bulgaria Portable Hand-Thrown Extinguisher Market (2026-2032)
- Brunei Portable Hand-Thrown Extinguisher Market (2026-2032)
- Botswana Portable Hand-Thrown Extinguisher Market (2026-2032)
- Bosnia and Herzegovina Portable Hand-Thrown Extinguisher Market (2026-2032)
Industry Events and Analyst Meet

HIMTEX 2026

India Refining Summit 2026

India EV Show 2026

EV tech India Expo 2026

Auto Tech Asia 2026
Whitepaper
- Middle East & Africa Commercial Security Market Click here to view more.
- Middle East & Africa Fire Safety Systems & Equipment Market Click here to view more.
- GCC Drone Market Click here to view more.
- Middle East Lighting Fixture Market Click here to view more.
- GCC Physical & Perimeter Security Market Click here to view more.