India Smart Aerial Mapping for Farms Market Size & Growth Rate
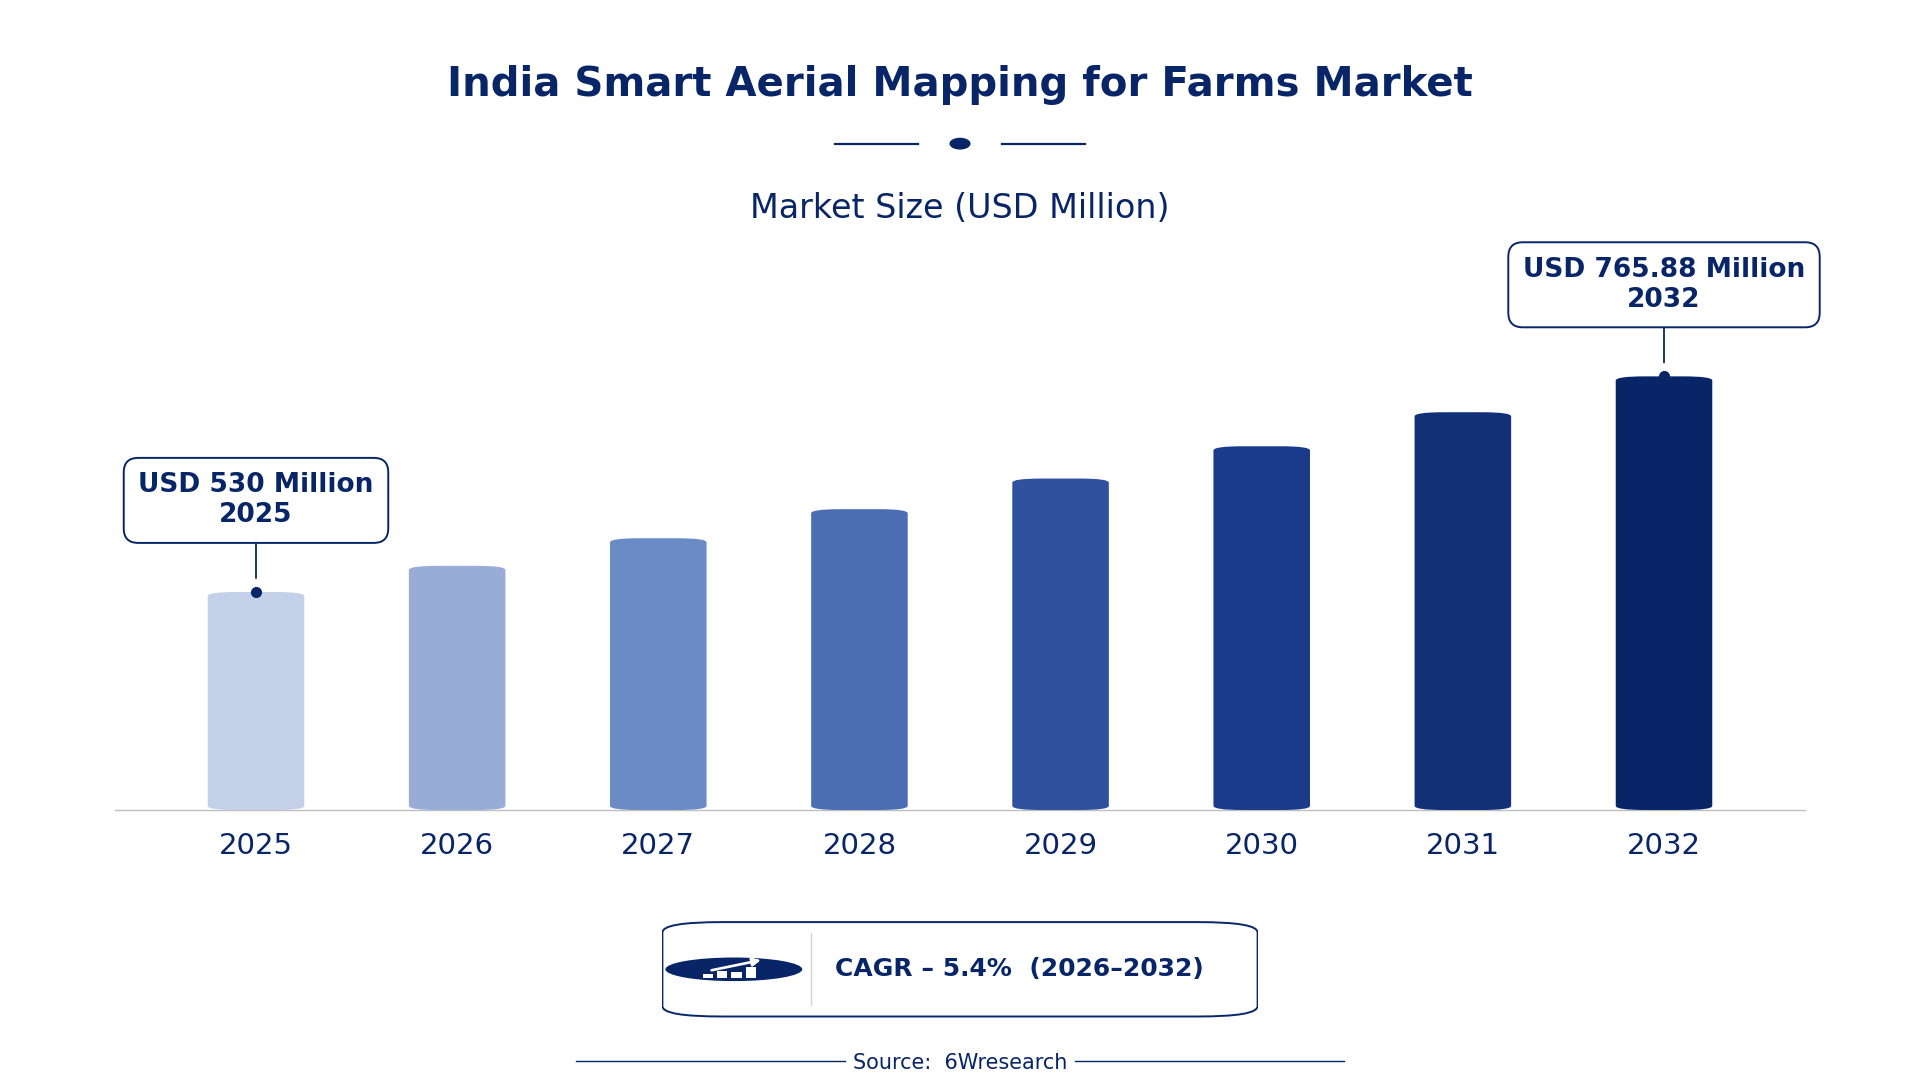
According to 6Wresearch internal database and industry insights, the India Smart Aerial Mapping for Farms Market was valued at USD 530.0 million in 2025 and is projected to reach USD 765.88 million by 2032, growing at a CAGR of approximately 5.4% during 2026–2032.
India Smart Aerial Mapping for Farms Market Highlights
| Report Metric | Details |
| Report Name | India Smart Aerial Mapping for Farms Market |
| Market Size 2025 | USD 530.0 million |
| Market Size 2032 | USD 765.88 million |
| Absolute Growth 2025–2032 | USD 235.88 million |
| CAGR 2026–2032 | 5.4% |
| Peak Annual Growth | 7.4% in 2032 |
| Forecast Period | 2026–2032 |
| Historical Data | 2022–2025 |
| Base Year | 2025 |
| Leading Mapping Type, 2025 | Multispectral Mapping (39% share) |
| Leading Technology Used, 2025 | Drone + NDVI Sensors (44% share) |
| Leading Output Provided, 2025 | Crop Health Maps (45% share) |
| Leading End User, 2025 | Precision Farming Firms (44% share) |
| Fastest-Growing Technology Used | High-Res Cameras (7.6% CAGR) |
| Fastest-Growing Output Provided | Soil Moisture/Heat Stress (7.5% CAGR) |
| Fastest-Growing End User | Agri-Tech Startups (7.3% CAGR) |
| Growing Sector | Precision Farming |
| Key End Users | Precision Farming Firms, Agri-Tech Startups, Agricultural Surveyors |
India Smart Aerial Mapping for Farms Market Year-wise Growth Rate and Key Drivers (2022–2032)
This graph illustrates the annual growth rates of the market from 2022 to 2032, highlighting a steady upward trajectory and projected market expansion over the forecast period.
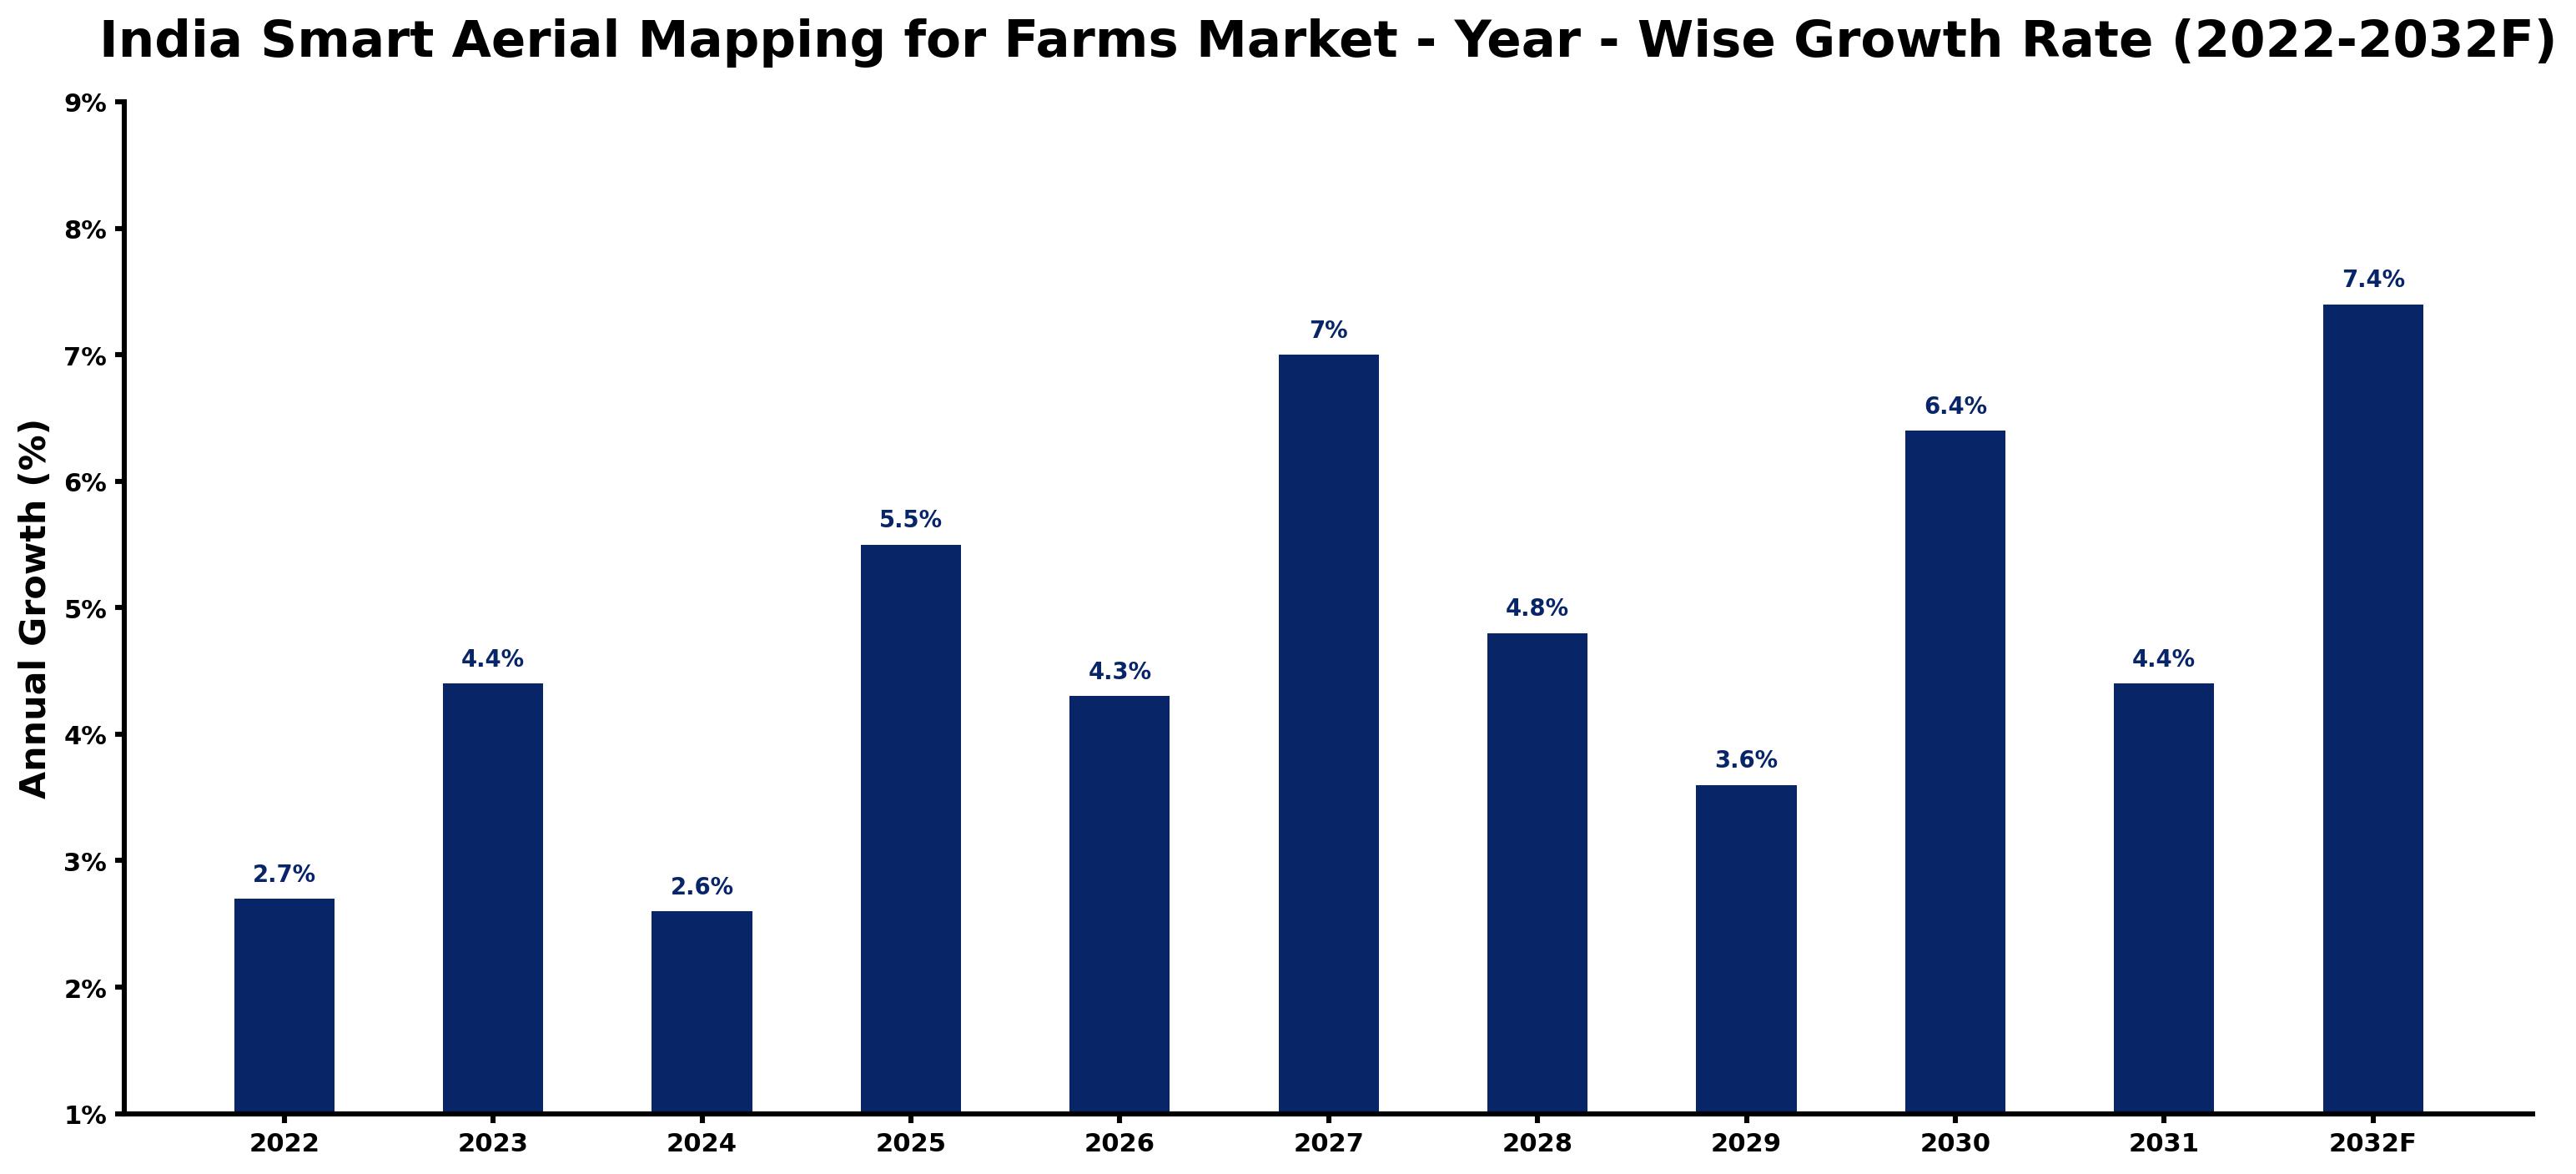
The table below sets out the estimated growth rate for each year and the main factor behind it.
| Year | Estimated Annual Growth (%) | Market Rationale |
| 2022 | 2.7 | The market showed steady growth as precision farming began to gain traction among farmers through initiatives like the Digital Agriculture Mission. |
| 2023 | 4.4 | Increased adoption of aerial mapping technologies by large farms accelerated market growth, driven by the National Drone Policy 2021. |
| 2024 | 2.6 | Growth slowed as some farms faced challenges in integrating new technologies effectively, particularly in rural areas. |
| 2025 | 5.5 | The market experienced a peak due to heightened demand for crop health assessments from precision farming firms. |
| 2026 | 4.3 | A slight slowdown occurred as market participants adjusted to new regulatory frameworks established by the government. |
| 2027 | 7.0 | Growth picked up again as interest in precision farming solutions surged among agri-tech startups focusing on innovation. |
| 2028 | 4.8 | Market growth slowed again as competition intensified among technology providers in the aerial mapping sector. |
| 2029 | 3.6 | The market continued to grow, driven by ongoing demand for soil moisture assessments supported by the Soil Health Card Scheme. |
| 2030 | 6.4 | A renewed interest in precision agriculture led to faster growth as new technologies emerged within the sector. |
| 2031 | 4.4 | Growth slowed as the market matured and competition increased among service providers in precision farming. |
| 2032 | 7.4 | The market peaked with strong demand for advanced aerial mapping solutions as over 40% of large farms adopted these technologies. |
Note: Market size estimations and growth projections presented in this report are based on 6Wresearch's proprietary forecasting methodology, utilizing the latest available industry data, government publications, and primary research inputs.
India Smart Aerial Mapping for Farms Market Synopsis
The India Smart Aerial Mapping for Farms market includes advanced drone technology that captures detailed agricultural imagery and data, primarily assisting in crop health assessment and soil condition monitoring. This market is growing due to increased demand from precision farming firms and agri-tech startups. Government initiatives, such as the Digital Agriculture Mission launched in 2021, are also encouraging technology adoption. The agricultural sector plays a crucial role in the economy, with over 20% of large farms using aerial mapping solutions, propelling further growth.
Market Dynamics Impact Analysis (2026–2032)
| Factor | Type | Impact | Primary Segment Affected |
| Rising adoption of precision farming techniques | Driver | High | Drone + NDVI Sensors |
| Government initiatives promoting technology in agriculture | Driver | High | Multispectral Mapping |
| Growing investment in agri-tech startups | Opportunity | High | Agri-Tech Startups |
| Increasing demand for soil health assessments | Opportunity | High | Soil Moisture/Heat Stress |
| High costs associated with drone technology | Restraint | Medium | Drone + NDVI Sensors |
| Limited awareness among smallholder farmers | Restraint | Medium | Precision Farming Firms |
| Challenges in integrating new technologies | Challenge | High | Multispectral Mapping |
| Intense competition among service providers | Challenge | Medium | Agri-Tech Startups |
Evaluation of Drivers in India Smart Aerial Mapping for Farms Market (2026–2032)
The main growth drivers and the segments they affect most are set out below.
| Drivers | Primary Segment Affected | Why It Matters (Evidence) |
| Increased adoption of NDVI sensors for crop monitoring | Drone + NDVI Sensors | Over 20% of large farms have adopted aerial mapping, improving crop health assessments. |
| Government support for digital agriculture | Multispectral Mapping | The Digital Agriculture Mission aims to promote technology adoption, resulting in increased purchases among farmers. |
| Growing interest in precision agriculture | Precision Farming Firms | The agricultural sector contributes 17-18% to GDP, motivating firms to adopt advanced mapping solutions. |
| Rising awareness of soil health management | Soil Moisture/Heat Stress | The Soil Health Card Scheme encourages farmers to assess soil conditions, boosting demand for mapping. |
| Expansion of precision farming practices | Agri-Tech Startups | Agri-tech startups are increasingly adopting aerial mapping, driving demand for these technologies. |
Approximately 20% of large farms are utilising aerial mapping, which enhances crop health assessments and optimises farming practices. The Digital Agriculture Mission promotes technology adoption, resulting in more purchases among farmers. Interest in precision agriculture is growing, as the agricultural sector contributes significantly to the economy, motivating firms to adopt advanced mapping solutions. The Soil Health Card Scheme encourages farmers to assess soil conditions, further boosting demand for aerial mapping technologies.
Evaluation of Restraints in India Smart Aerial Mapping for Farms Market
The following restraints limit how fast demand can grow.
| Market Restraint | Primary Segment Affected | Why It Matters (Evidence) |
| High costs associated with drone technology | Drone + NDVI Sensors | The initial investment for drone technology can be prohibitive for many smallholder farmers, limiting adoption. |
| Limited awareness among smallholder farmers | Precision Farming Firms | Many smallholders lack knowledge about the benefits of aerial mapping, hindering widespread adoption. |
| Regulatory challenges in drone usage | Multispectral Mapping | Complex regulations can delay the deployment of aerial mapping technologies, affecting market growth. |
| Integration issues with existing farming practices | Agri-Tech Startups | Some farmers struggle to incorporate new technologies into traditional farming methods, slowing progress. |
| Competition among service providers | Soil Moisture/Heat Stress | Intense competition can lead to price wars, affecting profitability for providers in the market. |
India Smart Aerial Mapping for Farms Market Challenges
Buyers and suppliers in the India Smart Aerial Mapping for Farms market encounter rising costs due to advanced drone technology, which can inflate operational expenses by 15% for farmers. Supply chain delays arise as regulatory approvals for drone usage can take several months, hindering timely access to mapping services for producers. A skills gap is apparent, with less than 30% of agricultural workers trained in advanced drone operations, limiting the effectiveness of mapping for many smallholders. Increased competition from agri-tech startups compels established providers to innovate rapidly, affecting pricing strategies and service offerings for buyers.
Trends in the India Smart Aerial Mapping for Farms Market
Four trends stand out in the India Smart Aerial Mapping for Farms Market.
- Shift towards Precision Farming: Precision farming is gaining traction among farmers, especially in Maharashtra and Punjab, with over 20% of large farms adopting aerial mapping technologies to improve productivity.
- Increased Use of NDVI Sensors: The adoption of NDVI sensors is on the rise, reflecting a growing focus on crop health monitoring, with drones equipped with these sensors becoming standard in many farms across India.
- Growth of Agri-Tech Startups: Agri-tech startups are increasingly adopting smart aerial mapping solutions, with funding for these firms rising, reflecting a shift in agricultural practices towards technology-driven approaches.
- Adoption of Soil Health Card Scheme: The Soil Health Card Scheme, launched to help farmers assess soil conditions, is facilitating the integration of aerial mapping technologies in farming practices.
Investment Opportunities in the India Smart Aerial Mapping for Farms Market
Below are the investment opportunities with the strongest case in the India Smart Aerial Mapping for Farms Market.
- Partnerships with Agri-Tech Startups: Forming joint ventures with agri-tech startups can ease market entry, as these firms are increasingly adopting aerial mapping solutions, with over 20% of large farms using them.
- Investment in Precision Farming Technologies: With the agricultural sector contributing 17-18% to GDP, there is a strong opportunity to invest in precision farming technologies that boost productivity and efficiency.
- Supply of NDVI Sensors: Providing NDVI sensors for drone applications can satisfy the growing demand, particularly in states like Maharashtra and Punjab, where adoption is rapidly increasing.
- Expansion into Smallholder Markets: Targeting smallholder farmers with affordable aerial mapping solutions presents a promising opportunity, as over 60% of Indian farmers are smallholders increasingly adopting technology.
Government Initiatives in the India Smart Aerial Mapping for Farms Market
The regulatory framework for aerial mapping in India has evolved in recent years. The National Drone Policy 2021, implemented by the Ministry of Civil Aviation, promotes drone usage in agriculture with streamlined regulations. Additionally, the Digital Agriculture Mission, launched by the Ministry of Agriculture in 2021, focuses on enhancing technology adoption in farming, including aerial mapping solutions. These measures facilitate easier access to technology for farmers and improve overall agricultural productivity. Furthermore, the Pradhan Mantri Kisan Samman Nidhi Yojana, updated in 2022, supports farmers financially, encouraging them to adopt modern agricultural practices.
The Ministry of Agriculture plays a key role in implementing various agricultural initiatives. The National Agricultural Technology Project, initiated in 2020, emphasizes the use of modern technologies like aerial mapping for sustainable agriculture. This project funds research and development in precision agriculture, helping farmers access advanced tools. Furthermore, the Ministry of Agriculture provides guidance and funding for projects that enhance agricultural productivity, aiming to foster innovation and improve the overall efficiency of the agricultural sector.
Future Insight of the India Smart Aerial Mapping for Farms Market
Several forward-looking factors should support the India Smart Aerial Mapping for Farms market in the coming years. The government’s Pradhan Mantri Krishi Sinchai Yojana will improve irrigation efficiency, encouraging the adoption of smart aerial mapping. By 2032, over 40% of large farms are expected to implement these technologies, reflecting a shift towards precision farming. The updated Indian drone policy will enable broader agricultural applications, making it easier for farmers to utilise these tools. Additionally, initiatives from the Indian Council of Agricultural Research will drive advancements in precision agriculture.
Market Segmentation Analysis
Each segment group is reviewed below, with the leader by share and the fastest grower by CAGR.
By Mapping Type – Multispectral Mapping Dominated and Is Expected to Record the Fastest Growth
According to Dhaval Chaurasia, Assistant Manager at 6Wresearch, Multispectral Mapping took a 39% share of mapping type in 2025, more than any other category. Multispectral Mapping commands the largest share as it effectively assesses crop health and soil conditions, making it indispensable for large farms in India. With over 20% of these farms adopting this method, it has established itself as a fundamental component of modern agriculture. Multispectral Mapping is also forecast to expand faster than any other category, at a CAGR of 6.9% over 2026–2032. The rapid growth of Multispectral Mapping is propelled by the increasing adoption of precision farming techniques, particularly in key agricultural states like Maharashtra and Punjab. As more farmers become aware of its benefits, the demand for this mapping type is poised for substantial expansion. Suppliers should focus on enhancing multispectral mapping solutions to align with the rising demands of farmers and the precision agriculture sector.
By Technology Used – Drone + NDVI Sensors Dominated, High-Res Cameras Expected to Grow Fastest
Drone + NDVI Sensors accounted for a 44% market share by technology used in 2025. The combination of Drone and NDVI Sensors leads the market as it is vital for precision farming applications, providing critical data for effective crop monitoring. This technology is extensively used by farmers aiming to optimise yields and enhance their agricultural practices. High-Res Cameras are set to record the highest CAGR in this split, 7.6% over 2026–2032. High-Res Cameras are experiencing significant growth due to their crucial role in capturing detailed images of crops, which are essential for effective monitoring. As agri-tech startups innovate, the demand for high-resolution imagery is expected to rise considerably. Buyers should explore integrating high-resolution camera technology to improve their aerial mapping capabilities and enhance crop management.
By Output Provided – Crop Health Maps Dominated, Soil Moisture/Heat Stress Expected to Grow Fastest
The largest output provided category in 2025 was Crop Health Maps, with a 45% share of total revenue. Crop Health Maps dominate the market as they deliver vital information for farmers to make informed decisions about their crops. This output is increasingly in demand as farmers seek to maximise yield and operational efficiency. Soil Moisture/Heat Stress is projected to grow fastest, at a CAGR of 7.5% during 2026–2032. The demand for Soil Moisture/Heat Stress data is surging, driven by the need for precise irrigation management and effective crop planning. With the Soil Health Card Scheme in place, farmers are more inclined to utilise this data for better resource management. Suppliers must ensure their offerings include comprehensive soil moisture and heat stress outputs to meet the evolving requirements of farmers.
By End User – Precision Farming Firms Dominated, Agri-Tech Startups Expected to Grow Fastest
With a 44% revenue share in 2025, Precision Farming Firms was the largest end user category. Precision Farming Firms hold the largest market share as they are the primary users of aerial mapping technologies, leveraging these tools for enhanced agricultural practices. Their established operations and focus on efficiency consistently drive demand for smart aerial mapping solutions. Over 2026–2032, Agri-Tech Startups are expected to post the fastest growth, at a CAGR of 7.3%. Agri-Tech Startups are the fastest-growing segment, utilising aerial mapping for innovative solutions that address contemporary agricultural challenges. Their agility and commitment to technology adoption position them for rapid growth in this market. Suppliers should target agri-tech startups to cultivate partnerships that can lead to the development of advanced aerial mapping solutions.
Key Attractiveness of the Report
- 10 Years of Market Numbers
- Historical Data Starting from 2022 to 2025
- Base Year 2025
- Forecast Data until 2032
- Key Performance Indicators Impacting the Market
- Major Upcoming Developments and Projects
Key Highlights of the Report:
- India Smart Aerial Mapping for Farms Market Outlook
- Market Size of India Smart Aerial Mapping for Farms Market, 2025
- Forecast of India Smart Aerial Mapping for Farms Market, 2032
- Historical Data and Forecast of India Smart Aerial Mapping for Farms Revenues & Volume for the Period 2022 - 2032F
- India Smart Aerial Mapping for Farms Market Trend Evolution
- India Smart Aerial Mapping for Farms Market Drivers and Challenges
- India Smart Aerial Mapping for Farms Price Trends
- India Smart Aerial Mapping for Farms Porter's Five Forces
- India Smart Aerial Mapping for Farms Industry Life Cycle
- Historical Data and Forecast of India Smart Aerial Mapping for Farms Market Revenues & Volume By Mapping Type for the Period 2022 - 2032F
- Historical Data and Forecast of India Smart Aerial Mapping for Farms Market Revenues & Volume By Multispectral Mapping for the Period 2022 - 2032F
- Historical Data and Forecast of India Smart Aerial Mapping for Farms Market Revenues & Volume By Thermal Mapping for the Period 2022 - 2032F
- Historical Data and Forecast of India Smart Aerial Mapping for Farms Market Revenues & Volume By Lidar-based Mapping for the Period 2022 - 2032F
- Historical Data and Forecast of India Smart Aerial Mapping for Farms Market Revenues & Volume By RGB Imaging for the Period 2022 - 2032F
- Historical Data and Forecast of India Smart Aerial Mapping for Farms Market Revenues & Volume By Technology Used for the Period 2022 - 2032F
- Historical Data and Forecast of India Smart Aerial Mapping for Farms Market Revenues & Volume By Drone + NDVI Sensors for the Period 2022 - 2032F
- Historical Data and Forecast of India Smart Aerial Mapping for Farms Market Revenues & Volume By IR Camera + UAV for the Period 2022 - 2032F
- Historical Data and Forecast of India Smart Aerial Mapping for Farms Market Revenues & Volume By 3D Aerial Models for the Period 2022 - 2032F
- Historical Data and Forecast of India Smart Aerial Mapping for Farms Market Revenues & Volume By High-Res Cameras for the Period 2022 - 2032F
- Historical Data and Forecast of India Smart Aerial Mapping for Farms Market Revenues & Volume By Output Provided for the Period 2022 - 2032F
- Historical Data and Forecast of India Smart Aerial Mapping for Farms Market Revenues & Volume By Crop Health Maps for the Period 2022 - 2032F
- Historical Data and Forecast of India Smart Aerial Mapping for Farms Market Revenues & Volume By Soil Moisture/Heat Stress for the Period 2022 - 2032F
- Historical Data and Forecast of India Smart Aerial Mapping for Farms Market Revenues & Volume By Terrain Profiling for the Period 2022 - 2032F
- Historical Data and Forecast of India Smart Aerial Mapping for Farms Market Revenues & Volume By Real-time Crop View for the Period 2022 - 2032F
- Historical Data and Forecast of India Smart Aerial Mapping for Farms Market Revenues & Volume By End User for the Period 2022 - 2032F
- Historical Data and Forecast of India Smart Aerial Mapping for Farms Market Revenues & Volume By Precision Farming Firms for the Period 2022 - 2032F
- Historical Data and Forecast of India Smart Aerial Mapping for Farms Market Revenues & Volume By Agri-Tech Startups for the Period 2022 - 2032F
- Historical Data and Forecast of India Smart Aerial Mapping for Farms Market Revenues & Volume By Agricultural Surveyors for the Period 2022 - 2032F
- Historical Data and Forecast of India Smart Aerial Mapping for Farms Market Revenues & Volume By Farm Equipment Suppliers for the Period 2022 - 2032F
- India Smart Aerial Mapping for Farms Import Export Trade Statistics
- Market Opportunity Assessment By Mapping Type
- Market Opportunity Assessment By Technology Used
- Market Opportunity Assessment By Output Provided
- Market Opportunity Assessment By End User
- India Smart Aerial Mapping for Farms Top Companies Market Share
- India Smart Aerial Mapping for Farms Competitive Benchmarking By Technical and Operational Parameters
- India Smart Aerial Mapping for Farms Company Profiles
- India Smart Aerial Mapping for Farms Key Strategic Recommendations
Market Covered
Segments analysed in this report are listed below.
By Mapping Type
- Multispectral Mapping
- Thermal Mapping
- Lidar-based Mapping
- RGB Imaging
By Technology Used
- Drone + NDVI Sensors
- IR Camera + UAV
- 3D Aerial Models
- High-Res Cameras
By Output Provided
- Crop Health Maps
- Soil Moisture/Heat Stress
- Terrain Profiling
- Real-time Crop View
By End User
- Precision Farming Firms
- Agri-Tech Startups
- Agricultural Surveyors
- Farm Equipment Suppliers































