China Smart Aerial Mapping for Farms Market Size & Growth Rate
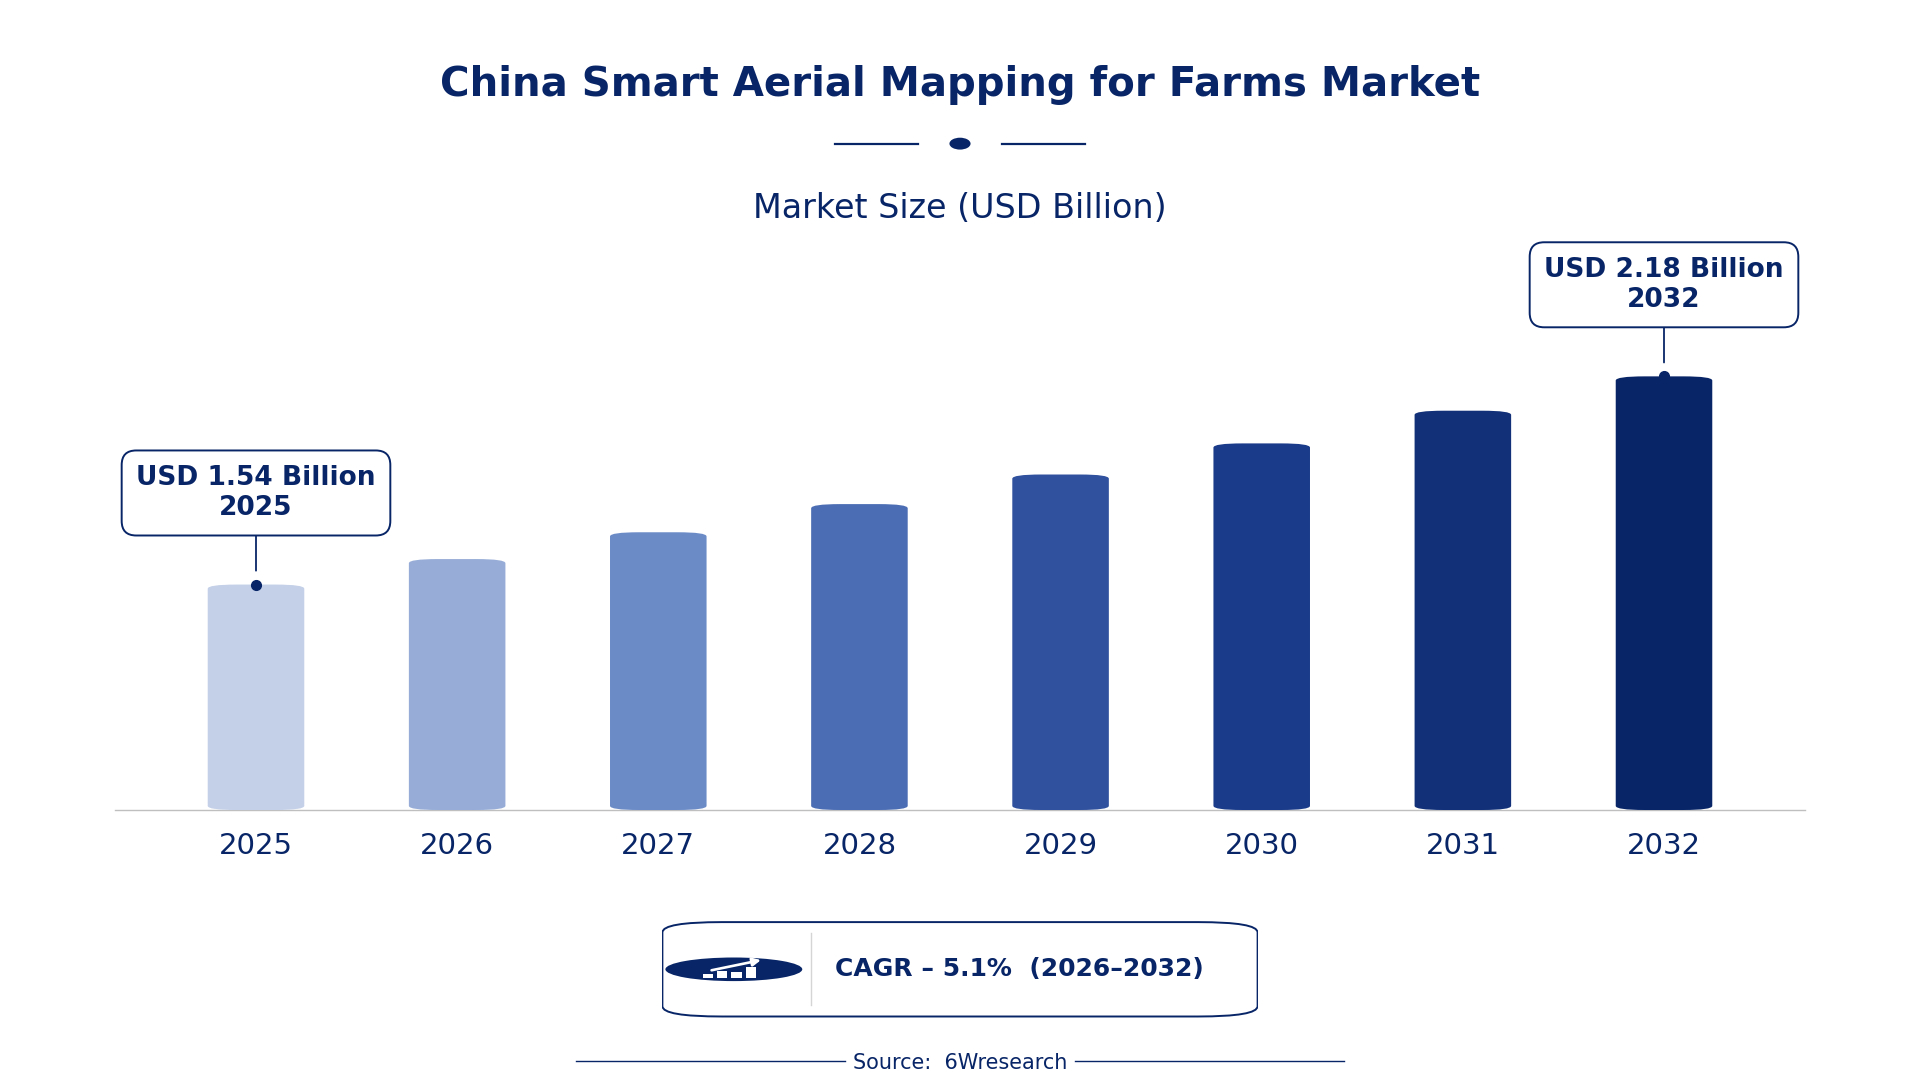
According to 6Wresearch internal database and industry insights, the China Smart Aerial Mapping for Farms Market was valued at USD 1.54 billion in 2025 and is projected to reach USD 2.18 billion by 2032, growing at a CAGR of approximately 5.1% during 2026–2032.
China Smart Aerial Mapping for Farms Market Highlights
| Report Metric | Details |
| Report Name | China Smart Aerial Mapping for Farms Market |
| Market Size 2025 | USD 1.54 billion |
| Market Size 2032 | USD 2.18 billion |
| Absolute Growth 2025–2032 | USD 0.64 billion |
| CAGR 2026–2032 | 5.1% |
| Peak Annual Growth | 7.4% in 2032 |
| Forecast Period | 2026–2032 |
| Historical Data | 2022–2025 |
| Base Year | 2025 |
| Leading Mapping Type, 2025 | Multispectral Mapping (49% share) |
| Leading Technology Used, 2025 | Drone + NDVI Sensors (38% share) |
| Leading Output Provided, 2025 | Crop Health Maps (52% share) |
| Leading End User, 2025 | Precision Farming Firms (38% share) |
| Fastest-Growing Mapping Type | Lidar-based Mapping (7.8% CAGR) |
| Fastest-Growing Technology Used | IR Camera + UAV (7.5% CAGR) |
| Fastest-Growing Output Provided | Soil Moisture/Heat Stress (6.4% CAGR) |
| Fastest-Growing End User | Agri-Tech Startups (6.8% CAGR) |
| Growing Sector | Precision Agriculture |
| Key End Users | Precision Farming Firms, Agri-Tech Startups, Agricultural Surveyors |
China Smart Aerial Mapping for Farms Market Year-wise Growth Rate and Key Drivers (2022–2032)
This graph illustrates the annual growth rates of the market from 2022 to 2032, highlighting a steady upward trajectory and projected market expansion over the forecast period.
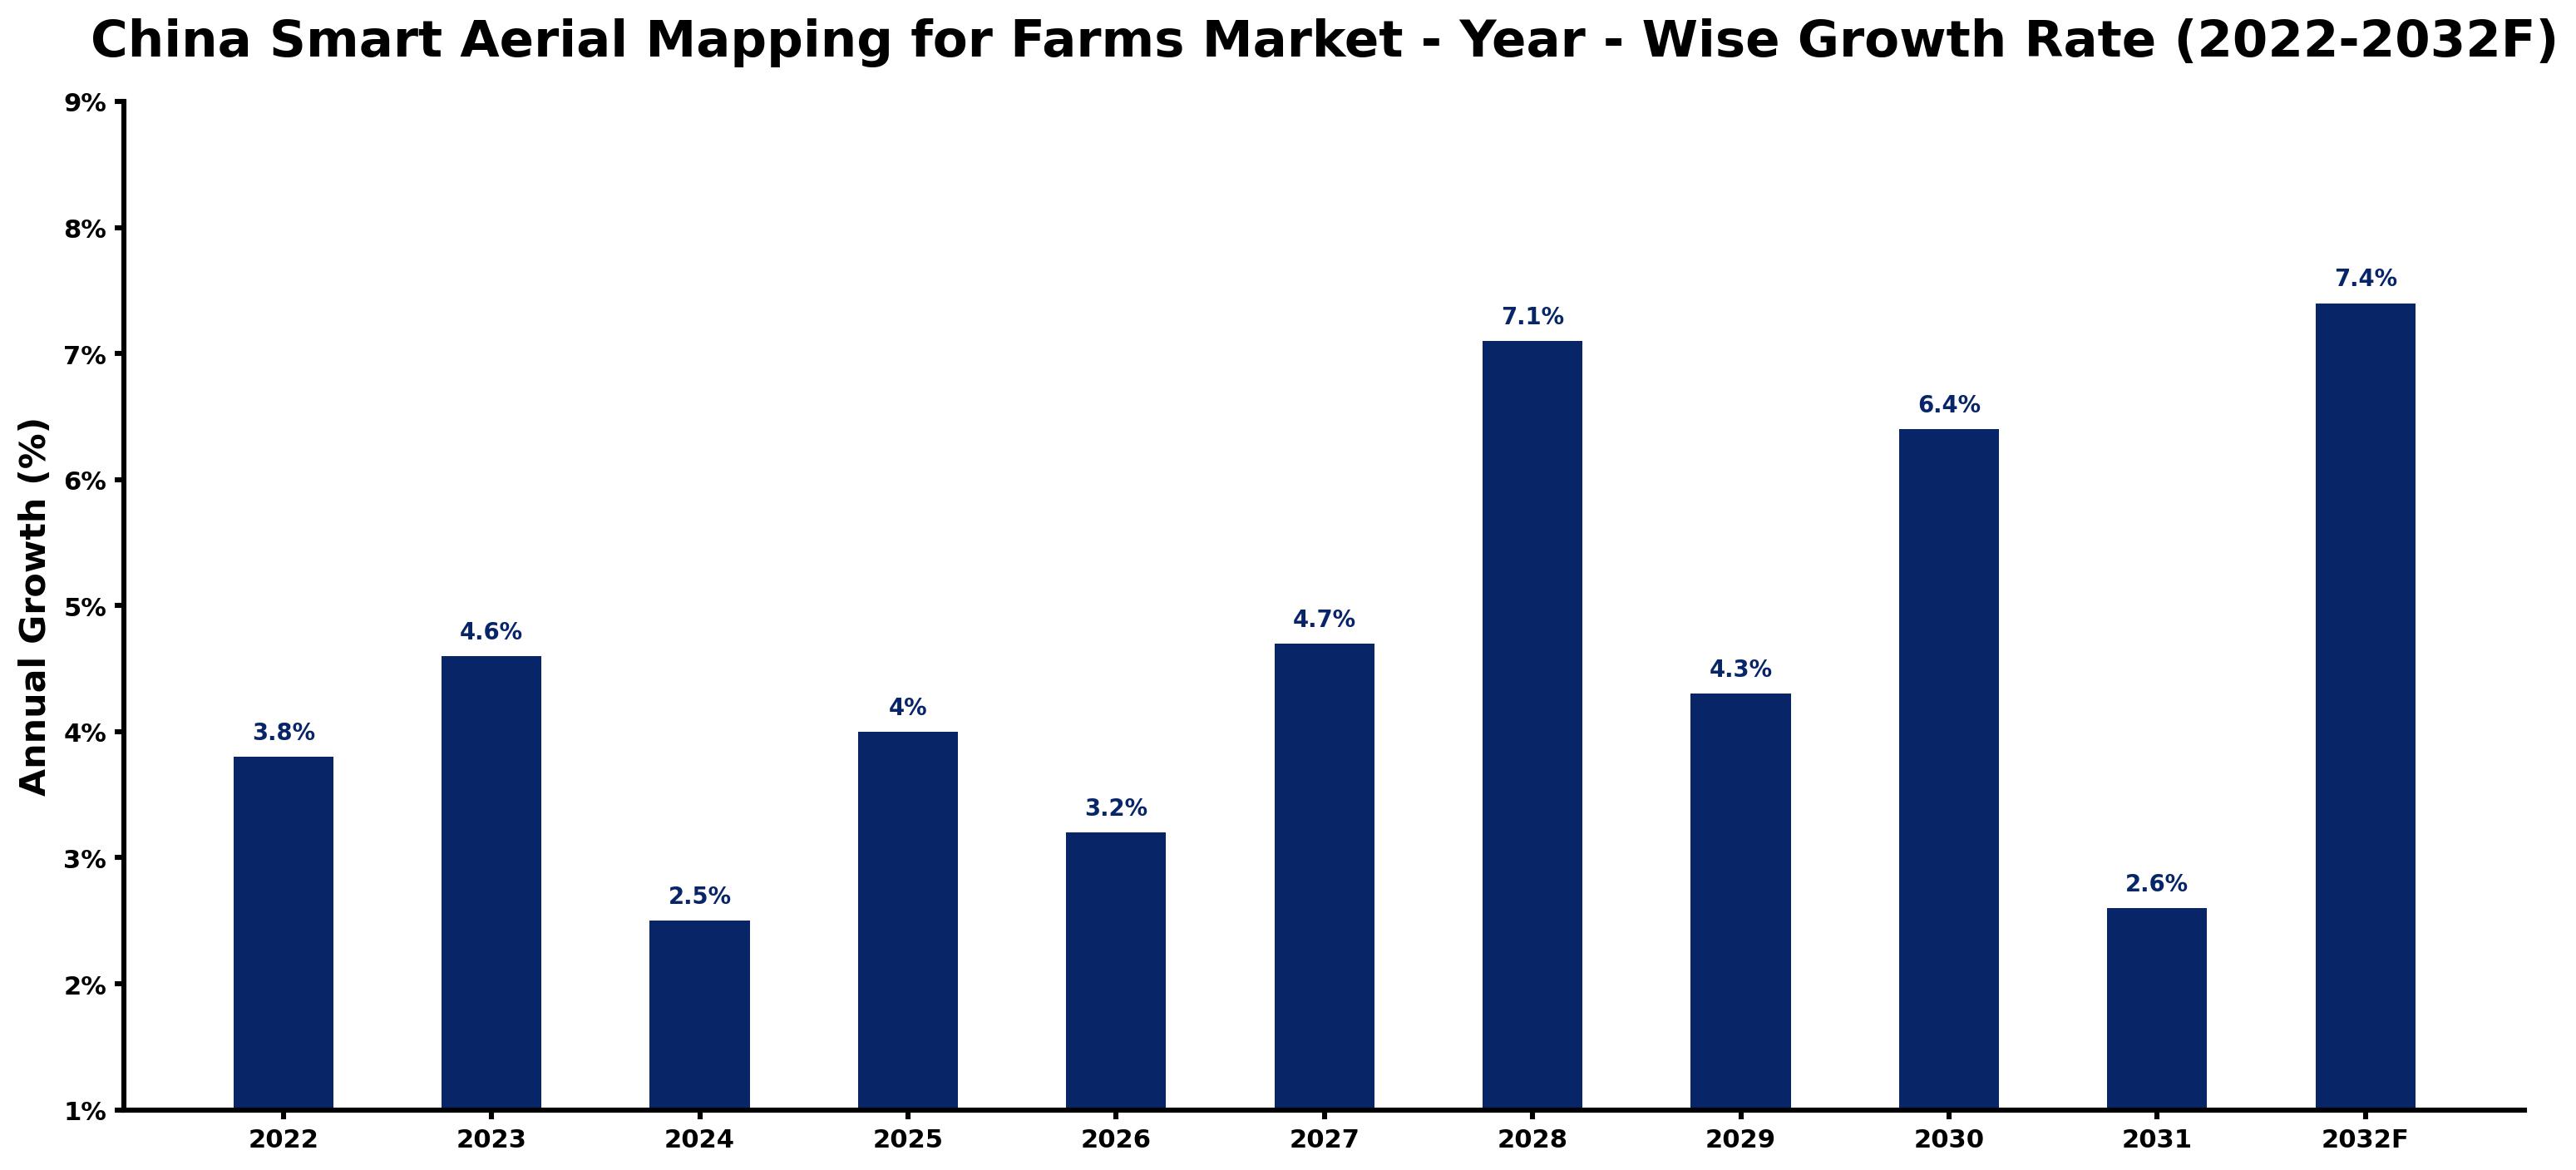
Below, each year's estimated growth is shown next to the factor that most influenced it.
| Year | Estimated Annual Growth (%) | Market Rationale |
| 2022 | 3.8 | The market experienced steady growth due to the launch of the Digital Agriculture Action Plan. |
| 2023 | 4.6 | Demand surged as the installed base of agricultural drones exceeded 300,000 units, boosting technology adoption. |
| 2024 | 2.5 | Growth slowed as the market adjusted to earlier rapid advancements in technology and practices. |
| 2025 | 4.0 | Renewed interest from precision farming firms and agri-tech startups drove market recovery. |
| 2026 | 3.2 | A slowdown occurred as the market faced challenges in scaling technology across diverse farm sizes and types. |
| 2027 | 4.7 | Growth accelerated again as the adoption rate of drones in agriculture reached 10%, increasing mapping efficiency. |
| 2028 | 7.1 | The market experienced growth due to the implementation of the Smart Agriculture Development Plan, promoting tech use. |
| 2029 | 4.3 | Growth slowed as the market began to stabilise after rapid expansion in previous years, reflecting maturity. |
| 2030 | 6.4 | A resurgence in growth was driven by increased investments in precision farming technologies and practices. |
| 2031 | 2.6 | Growth slowed as the market matured and competition intensified among technology providers and solutions. |
| 2032 | 7.4 | The market peaked with a surge in demand for advanced aerial mapping solutions, driven by new technology adoption. |
Note: Market size estimations and growth projections presented in this report are based on 6Wresearch's proprietary forecasting methodology, utilizing the latest available industry data, government publications, and primary research inputs.
China Smart Aerial Mapping for Farms Market Synopsis
Smart Aerial Mapping for Farms in China employs advanced drone technology and sensors to generate detailed agricultural maps. This technology supports monitoring crop health, assessing soil conditions, and optimising farm management practices. The China Smart Aerial Mapping for Farms Market is expanding due to rising demand from precision farming firms and agri-tech startups. The area under precision farming is projected to reach 200 million hectares by 2025, prompting further investment in these technologies. Government initiatives, such as the Smart Agriculture Development Plan, encourage this growth by promoting tech adoption across the sector.
Market Dynamics Impact Analysis (2026–2032)
| Factor | Type | Impact | Primary Segment Affected |
| Increasing adoption of drones in agriculture | Driver | High | Drone + NDVI Sensors |
| Growing number of agri-tech startups | Driver | High | Precision Farming Firms |
| Rising demand for crop health assessment solutions | Opportunity | High | Crop Health Maps |
| Need for efficient mapping solutions due to small farm sizes | Opportunity | Medium | Soil Moisture/Heat Stress |
| High initial investment costs for technology | Restraint | High | Drone + NDVI Sensors |
| Limited awareness among traditional farmers | Restraint | Medium | Precision Farming Firms |
| The Smart Aerial Mapping for Farms market faces high initial costs | Challenge | High | Drone + NDVI Sensors |
| Technological integration challenges in diverse farm sizes | Challenge | Medium | Precision Farming Firms |
Evaluation of Drivers in China Smart Aerial Mapping for Farms Market (2026–2032)
Key forces behind demand, with the segment each one moves most, are listed below.
| Drivers | Primary Segment Affected | Why It Matters (Evidence) |
| Increased investment in precision farming technologies | Drone + NDVI Sensors | The area under precision farming is projected to reach 200 million hectares by 2025, prompting more purchases of aerial mapping solutions. |
| Growing interest from agri-tech startups | Precision Farming Firms | Over 1,000 agri-tech startups in China are leveraging aerial mapping technologies to enhance productivity. |
| Government support for smart agriculture initiatives | Crop Health Maps | The Ministry of Agriculture's Smart Agriculture Development Plan aims for a 50% increase in smart farming by 2025, boosting demand. |
| Rising need for efficient farm management solutions | Soil Moisture/Heat Stress | The average farm size in China is 0.6 hectares, necessitating efficient mapping solutions for effective management. |
| Surge in drone usage for agricultural applications | Drone + NDVI Sensors | The installed base of agricultural drones exceeded 300,000 units in 2022, increasing demand for mapping technologies. |
The area under precision farming is projected to reach 200 million hectares by 2025, prompting more purchases of aerial mapping solutions. The Smart Agriculture Development Plan aims for a 50% increase in smart farming by 2025, boosting demand for crop health mapping solutions. The installed base of agricultural drones exceeded 300,000 units in 2022, which increases the need for advanced mapping technologies. Overall, these factors drive demand for effective solutions in the agricultural sector.
Evaluation of Restraints in China Smart Aerial Mapping for Farms Market
The table below lists the restraints and the evidence behind each.
| Market Restraint | Primary Segment Affected | Why It Matters (Evidence) |
| High initial investment costs for technology adoption | Drone + NDVI Sensors | The average age of farmers in China is around 57, making it difficult for them to invest in new technologies. |
| Limited awareness among traditional farmers about aerial mapping benefits | Precision Farming Firms | Many farmers still rely on conventional methods, delaying the adoption of advanced mapping solutions. |
| Challenges in integrating technology across diverse farm sizes | Soil Moisture/Heat Stress | The average farm size of 0.6 hectares complicates the implementation of standardised aerial mapping solutions. |
| Regulatory hurdles in drone operations | Crop Health Maps | Guidelines from the National Standard for Agricultural Remote Sensing can slow down innovation and adoption. |
| Dependence on weather conditions for drone operations | Drone + NDVI Sensors | Adverse weather can limit the operational capacity of drones, affecting mapping schedules and effectiveness. |
China Smart Aerial Mapping for Farms Market Challenges
The China Smart Aerial Mapping for Farms market encounters high supply chain costs, as producers face a 15% rise in expenses due to limited local drone manufacturing. This dependence on imports delays project timelines for farmers, who may wait up to six months for essential equipment. On the technology side, the average age of farmers is around 57, which hinders the adoption of modern mapping solutions necessary for efficient farm management. Additionally, fierce competition among over 1,000 agri-tech startups leads to price wars that squeeze profit margins for suppliers and inflate costs for buyers, complicating market conditions.
Trends in the China Smart Aerial Mapping for Farms Market
Four trends stand out in the China Smart Aerial Mapping for Farms Market.
- Shift towards Multispectral Mapping: The Yangtze River Delta is increasingly adopting multispectral mapping techniques for crop health assessment. In 2022, this approach accounted for 49% of the mapping market, reflecting a shift towards advanced data collection methods.
- Agri-Tech Startups Leading Innovation: Agri-tech startups in China are prioritising smart aerial mapping technologies to enhance productivity. With over 1,000 startups focusing on precision farming, the market is experiencing a 40% increase in the use of NDVI sensors for mapping.
- Increased Government Support for Smart Farming: In 2023, the Ministry of Agriculture launched the Smart Agriculture Development Plan, aiming for a 50% increase in smart farming by 2025. This initiative is expected to drive further investments in aerial mapping technologies.
- Growing Demand for Real-time Crop Monitoring: Precision farming firms are increasingly seeking real-time crop monitoring solutions. The adoption rate of drones in agriculture is estimated at 10% as of 2023, underscoring the need for immediate data collection.
Investment Opportunities in the China Smart Aerial Mapping for Farms Market
Several openings in the China Smart Aerial Mapping for Farms Market merit attention from investors.
- Precision Farming Firms Seeking Advanced Solutions: Precision farming firms in China are actively looking for advanced aerial mapping solutions to improve crop yields. The agricultural output value reached approximately 1.3 trillion USD in 2022, creating a demand for efficient technologies.
- Agri-Tech Startups Needing Advanced Technologies: Agri-tech startups in regions like the Yangtze River Delta require advanced mapping technologies to optimise their operations. With over 1,000 startups, the market is ripe for new entrants offering these solutions.
- Supply of NDVI Sensors for Improved Mapping: There is a growing need for NDVI sensors to improve aerial mapping capabilities. As the use of NDVI sensors increased by 40% in the last two years, suppliers can tap into this expanding market.
- Investment in Smart Agriculture Technologies: Now is the time to invest in smart agriculture technologies as the government aims to increase adoption by 50% by 2025. Collaborating with local precision farming firms can facilitate market entry.
Government Initiatives in the China Smart Aerial Mapping for Farms Market
In 2022, the National Development and Reform Commission approved the 'Agricultural Technology Innovation Strategy', which supports advancements in precision farming technologies, including aerial mapping. This strategy aims to improve agricultural productivity through technology integration. Additionally, the 'Digital Agriculture Action Plan' was introduced in 2021 to promote the integration of digital technologies in farming practices. This plan has laid a foundation for the adoption of smart aerial mapping solutions across China, benefiting producers and buyers alike. The 'Smart Agriculture Development Plan' launched in 2023 aims for a 50% increase in smart farming by 2025, further promoting the adoption of these technologies.
The Ministry of Agriculture oversees the implementation of various schemes, including the 'Smart Agriculture Development Plan', which aims to increase the adoption of smart farming technologies by 50% by 2025. This plan provides funding for technology adoption, benefiting precision farming firms and agri-tech startups. The 'China Agricultural Technology Promotion Program' also supports the integration of aerial mapping technologies in agricultural practices, enhancing efficiency and productivity for farmers. The 'National Standard for Agricultural Remote Sensing' updated in 2021 improves guidelines for aerial mapping, ensuring better data collection and usage.
Future Insight of the China Smart Aerial Mapping for Farms Market
The China Smart Aerial Mapping for Farms market is set to undergo transformative changes by 2032, driven by the government's 'Smart Agriculture Development Plan' aimed at increasing tech adoption by 50%. This initiative will improve training programs for farmers, facilitating their use of advanced mapping technologies. The installed base of agricultural drones is projected to exceed 600,000 units, significantly enhancing mapping capabilities across approximately 120 million hectares of arable land. Advances in NDVI sensor technology will further refine crop health assessments, optimising farm management practices.
Market Segmentation Analysis
The analysis below covers each segmentation, its leading category in 2025 and its fastest-growing category through 2032.
By Mapping Type – Multispectral Mapping Dominated, Lidar-based Mapping Expected to Grow Fastest
According to Dhaval Chaurasia, Assistant Manager at 6Wresearch, Multispectral Mapping took a 49% share of mapping type in 2025, more than any other category. Multispectral Mapping holds the largest share as it provides essential data for crop health assessment, which is critical for farmers managing extensive areas. This technology is particularly vital in regions like the Yangtze River Delta, where precision agriculture is a priority. Lidar-based Mapping is projected to grow fastest, at a CAGR of 7.8% during 2026–2032. Lidar-based Mapping is experiencing rapid growth due to its ability to enable precise terrain profiling, which is increasingly important with the projected expansion of precision farming areas. Government initiatives aimed at enhancing smart farming practices further drive this segment's growth. Suppliers should prioritise the development of Lidar-based solutions to meet the rising demand for detailed terrain analysis in agriculture.
By Technology Used – Drone + NDVI Sensors Dominated, IR Camera + UAV Expected to Grow Fastest
Drone + NDVI Sensors accounted for a 38% market share by technology used in 2025. The combination of Drone and NDVI Sensors leads the market share, as it is critical for assessing vegetation health and growth, significantly impacting crop yields. This technology is widely adopted among numerous agri-tech startups focusing on precision farming in China. Over 2026–2032, IR Camera + UAV is expected to post the fastest growth, at a CAGR of 7.5%. IR Camera + UAV is the fastest-growing segment because it effectively detects temperature variations in crops, essential for optimising irrigation practices. The recent surge in drone usage for mapping supports this segment's rapid expansion. Buyers should explore integrating IR Camera technology to enhance their mapping capabilities and improve overall crop management.
By Output Provided – Crop Health Maps Dominated, Soil Moisture/Heat Stress Expected to Grow Fastest
Crop Health Maps held a 52% share of the China Smart Aerial Mapping for Farms Market by output provided in 2025. Crop Health Maps command the largest share as they provide essential data for making informed farming decisions, helping farmers manage their crops effectively. This is particularly important given that precision farming firms are the primary users of such outputs. The quickest growth will come from Soil Moisture/Heat Stress, forecast to expand at a CAGR of 6.4% between 2026 and 2032. Soil Moisture/Heat Stress outputs are growing rapidly because they assist in managing irrigation and crop health, which is increasingly critical as the average farm size remains small at approximately 0.6 hectares. This demand aligns with the government's goal to boost smart farming technology adoption. Suppliers must prioritise the development of Soil Moisture/Heat Stress mapping solutions to cater to the urgent needs of farmers.
By End User – Precision Farming Firms Dominated, Agri-Tech Startups Expected to Grow Fastest
With a 38% revenue share in 2025, Precision Farming Firms was the largest end user category. Precision Farming Firms dominate the market share as they are the primary users of aerial mapping technologies, utilising them to boost productivity across large agricultural areas. The significant installed base of agricultural drones, exceeding 300,000 units, reflects the scale of this segment's operations. Agri-Tech Startups are set to record the highest CAGR in this split, 6.8% over 2026–2032. Agri-Tech Startups are the fastest-growing end user group, leveraging aerial mapping for innovative agricultural solutions that address contemporary farming challenges. Their growth is bolstered by government initiatives aimed at increasing the adoption of advanced technologies in agriculture. Suppliers should focus on Agri-Tech Startups to capitalise on their innovative approaches and the increasing demand for advanced mapping technologies.
Key Attractiveness of the Report
- 10 Years of Market Numbers
- Historical Data Starting from 2022 to 2025
- Base Year 2025
- Forecast Data until 2032
- Key Performance Indicators Impacting the Market
- Major Upcoming Developments and Projects
Key Highlights of the Report:
- China Smart Aerial Mapping for Farms Market Outlook
- Market Size of China Smart Aerial Mapping for Farms Market, 2025
- Forecast of China Smart Aerial Mapping for Farms Market, 2032
- Historical Data and Forecast of China Smart Aerial Mapping for Farms Revenues & Volume for the Period 2022 - 2032F
- China Smart Aerial Mapping for Farms Market Trend Evolution
- China Smart Aerial Mapping for Farms Market Drivers and Challenges
- China Smart Aerial Mapping for Farms Price Trends
- China Smart Aerial Mapping for Farms Porter's Five Forces
- China Smart Aerial Mapping for Farms Industry Life Cycle
- Historical Data and Forecast of China Smart Aerial Mapping for Farms Market Revenues & Volume By Mapping Type for the Period 2022 - 2032F
- Historical Data and Forecast of China Smart Aerial Mapping for Farms Market Revenues & Volume By Multispectral Mapping for the Period 2022 - 2032F
- Historical Data and Forecast of China Smart Aerial Mapping for Farms Market Revenues & Volume By Thermal Mapping for the Period 2022 - 2032F
- Historical Data and Forecast of China Smart Aerial Mapping for Farms Market Revenues & Volume By Lidar-based Mapping for the Period 2022 - 2032F
- Historical Data and Forecast of China Smart Aerial Mapping for Farms Market Revenues & Volume By RGB Imaging for the Period 2022 - 2032F
- Historical Data and Forecast of China Smart Aerial Mapping for Farms Market Revenues & Volume By Technology Used for the Period 2022 - 2032F
- Historical Data and Forecast of China Smart Aerial Mapping for Farms Market Revenues & Volume By Drone + NDVI Sensors for the Period 2022 - 2032F
- Historical Data and Forecast of China Smart Aerial Mapping for Farms Market Revenues & Volume By IR Camera + UAV for the Period 2022 - 2032F
- Historical Data and Forecast of China Smart Aerial Mapping for Farms Market Revenues & Volume By 3D Aerial Models for the Period 2022 - 2032F
- Historical Data and Forecast of China Smart Aerial Mapping for Farms Market Revenues & Volume By High-Res Cameras for the Period 2022 - 2032F
- Historical Data and Forecast of China Smart Aerial Mapping for Farms Market Revenues & Volume By Output Provided for the Period 2022 - 2032F
- Historical Data and Forecast of China Smart Aerial Mapping for Farms Market Revenues & Volume By Crop Health Maps for the Period 2022 - 2032F
- Historical Data and Forecast of China Smart Aerial Mapping for Farms Market Revenues & Volume By Soil Moisture/Heat Stress for the Period 2022 - 2032F
- Historical Data and Forecast of China Smart Aerial Mapping for Farms Market Revenues & Volume By Terrain Profiling for the Period 2022 - 2032F
- Historical Data and Forecast of China Smart Aerial Mapping for Farms Market Revenues & Volume By Real-time Crop View for the Period 2022 - 2032F
- Historical Data and Forecast of China Smart Aerial Mapping for Farms Market Revenues & Volume By End User for the Period 2022 - 2032F
- Historical Data and Forecast of China Smart Aerial Mapping for Farms Market Revenues & Volume By Precision Farming Firms for the Period 2022 - 2032F
- Historical Data and Forecast of China Smart Aerial Mapping for Farms Market Revenues & Volume By Agri-Tech Startups for the Period 2022 - 2032F
- Historical Data and Forecast of China Smart Aerial Mapping for Farms Market Revenues & Volume By Agricultural Surveyors for the Period 2022 - 2032F
- Historical Data and Forecast of China Smart Aerial Mapping for Farms Market Revenues & Volume By Farm Equipment Suppliers for the Period 2022 - 2032F
- China Smart Aerial Mapping for Farms Import Export Trade Statistics
- Market Opportunity Assessment By Mapping Type
- Market Opportunity Assessment By Technology Used
- Market Opportunity Assessment By Output Provided
- Market Opportunity Assessment By End User
- China Smart Aerial Mapping for Farms Top Companies Market Share
- China Smart Aerial Mapping for Farms Competitive Benchmarking By Technical and Operational Parameters
- China Smart Aerial Mapping for Farms Company Profiles
- China Smart Aerial Mapping for Farms Key Strategic Recommendations
Market Covered
The report offers an extensive study of the following market segments.
By Mapping Type
- Multispectral Mapping
- Thermal Mapping
- Lidar-based Mapping
- RGB Imaging
By Technology Used
- Drone + NDVI Sensors
- IR Camera + UAV
- 3D Aerial Models
- High-Res Cameras
By Output Provided
- Crop Health Maps
- Soil Moisture/Heat Stress
- Terrain Profiling
- Real-time Crop View
By End User
- Precision Farming Firms
- Agri-Tech Startups
- Agricultural Surveyors
- Farm Equipment Suppliers































