India Smart Manufacturing Visualization Market Size & Growth Rate
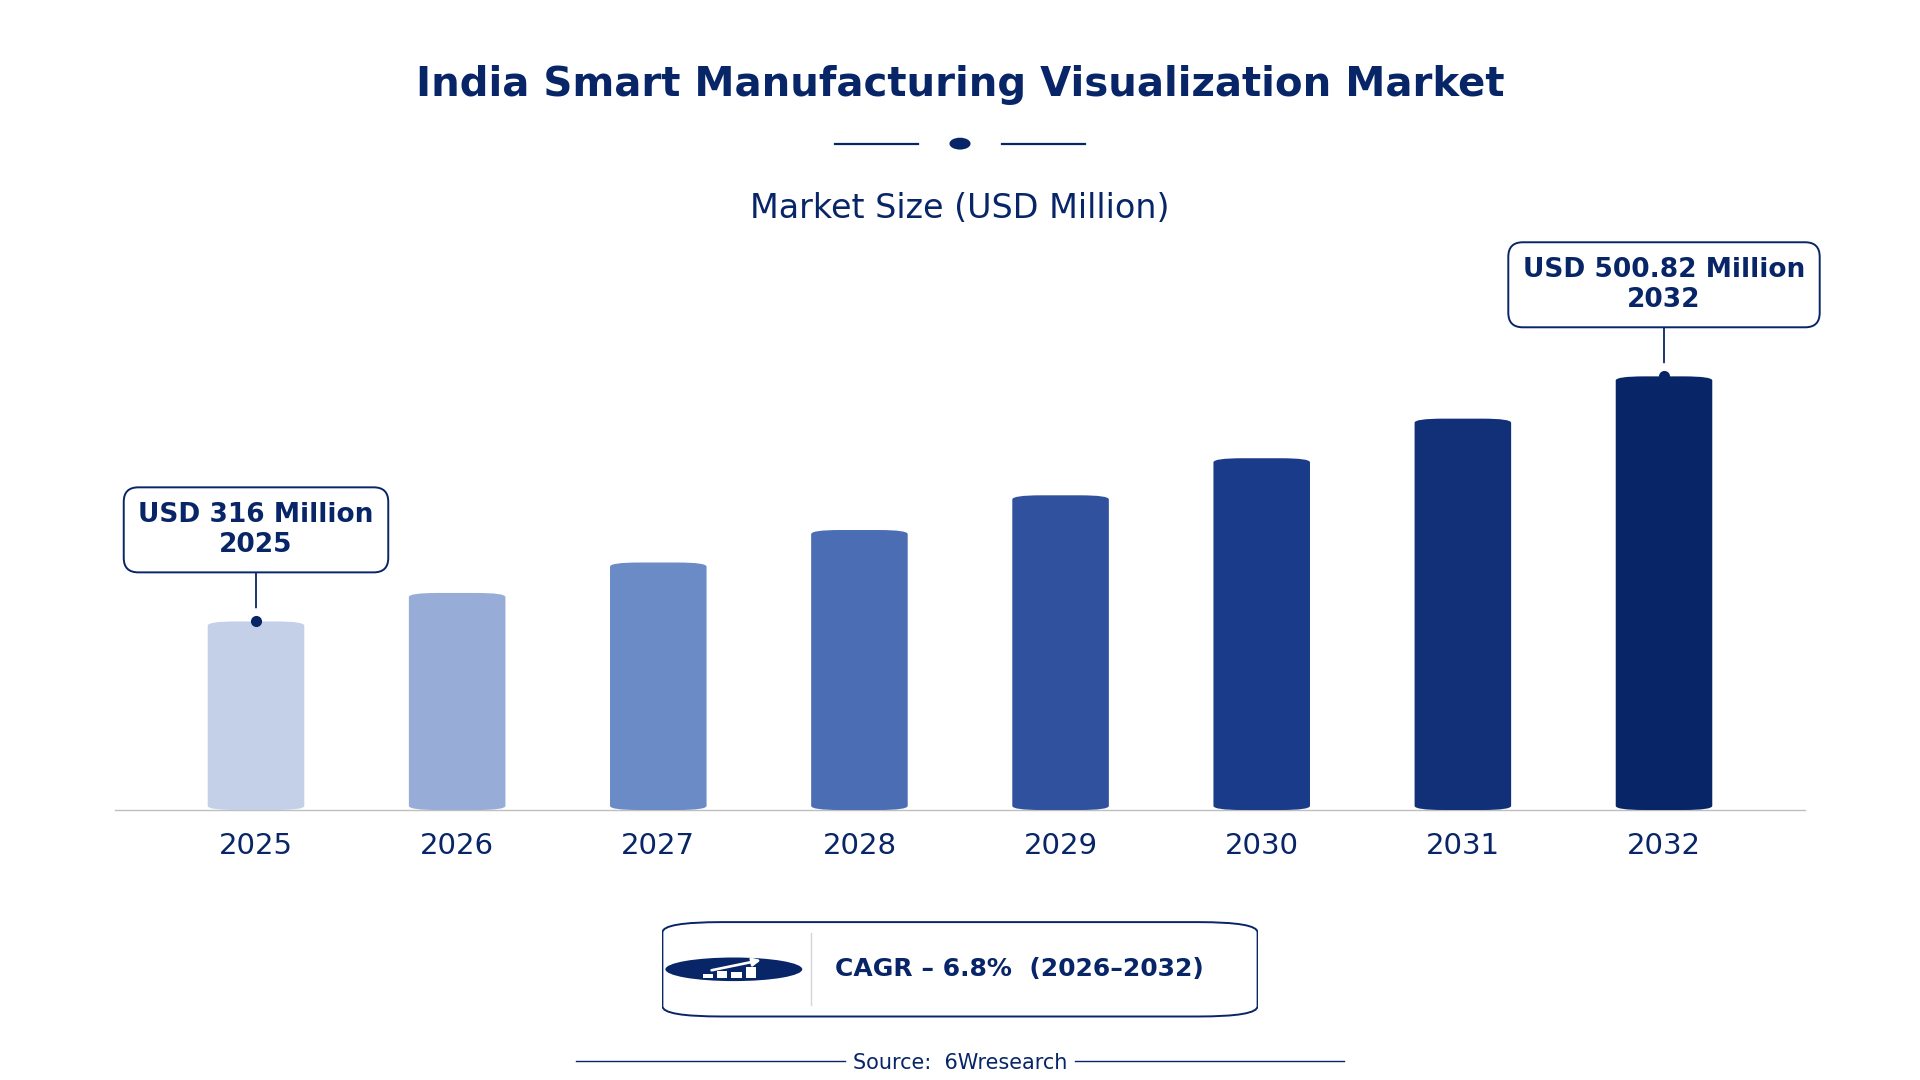
According to 6Wresearch internal database and industry insights, the India Smart Manufacturing Visualization Market was valued at USD 316.0 million in 2025 and is projected to reach USD 500.82 million by 2032, growing at a CAGR of approximately 6.8% during 2026–2032.
India Smart Manufacturing Visualization Market Highlights
| Report Metric | Details |
| Report Name | India Smart Manufacturing Visualization Market |
| Market Size 2025 | USD 316.0 million |
| Market Size 2032 | USD 500.82 million |
| Absolute Growth 2025–2032 | USD 184.82 million |
| CAGR 2026–2032 | 6.8% |
| Peak Annual Growth | 8.9% in 2026 |
| Forecast Period | 2026–2032 |
| Historical Data | 2022–2025 |
| Base Year | 2025 |
| Leading Visualization Tool, 2025 | Digital Dashboards (44% share) |
| Leading Core Feature, 2025 | Real-Time Metrics (38% share) |
| Leading Visualization Method, 2025 | Web & Mobile Interface (49% share) |
| Leading End User, 2025 | Plant Managers (51% share) |
| Fastest-Growing Visualization Tool | AR-Based Layout Planning (8.9% CAGR) |
| Fastest-Growing Core Feature | Spatial Simulation (8.8% CAGR) |
| Fastest-Growing Visualization Method | Augmented Reality (9.1% CAGR) |
| Fastest-Growing End User | Manufacturing Analysts (9.6% CAGR) |
| Growing Sector | automotive |
| Key End Users | Plant Managers, Manufacturing Analysts, Facility Managers |
India Smart Manufacturing Visualization Market Year-wise Growth Rate and Key Drivers (2022–2032)
This graph illustrates the annual growth rates of the market from 2022 to 2032, highlighting a steady upward trajectory and projected market expansion over the forecast period.
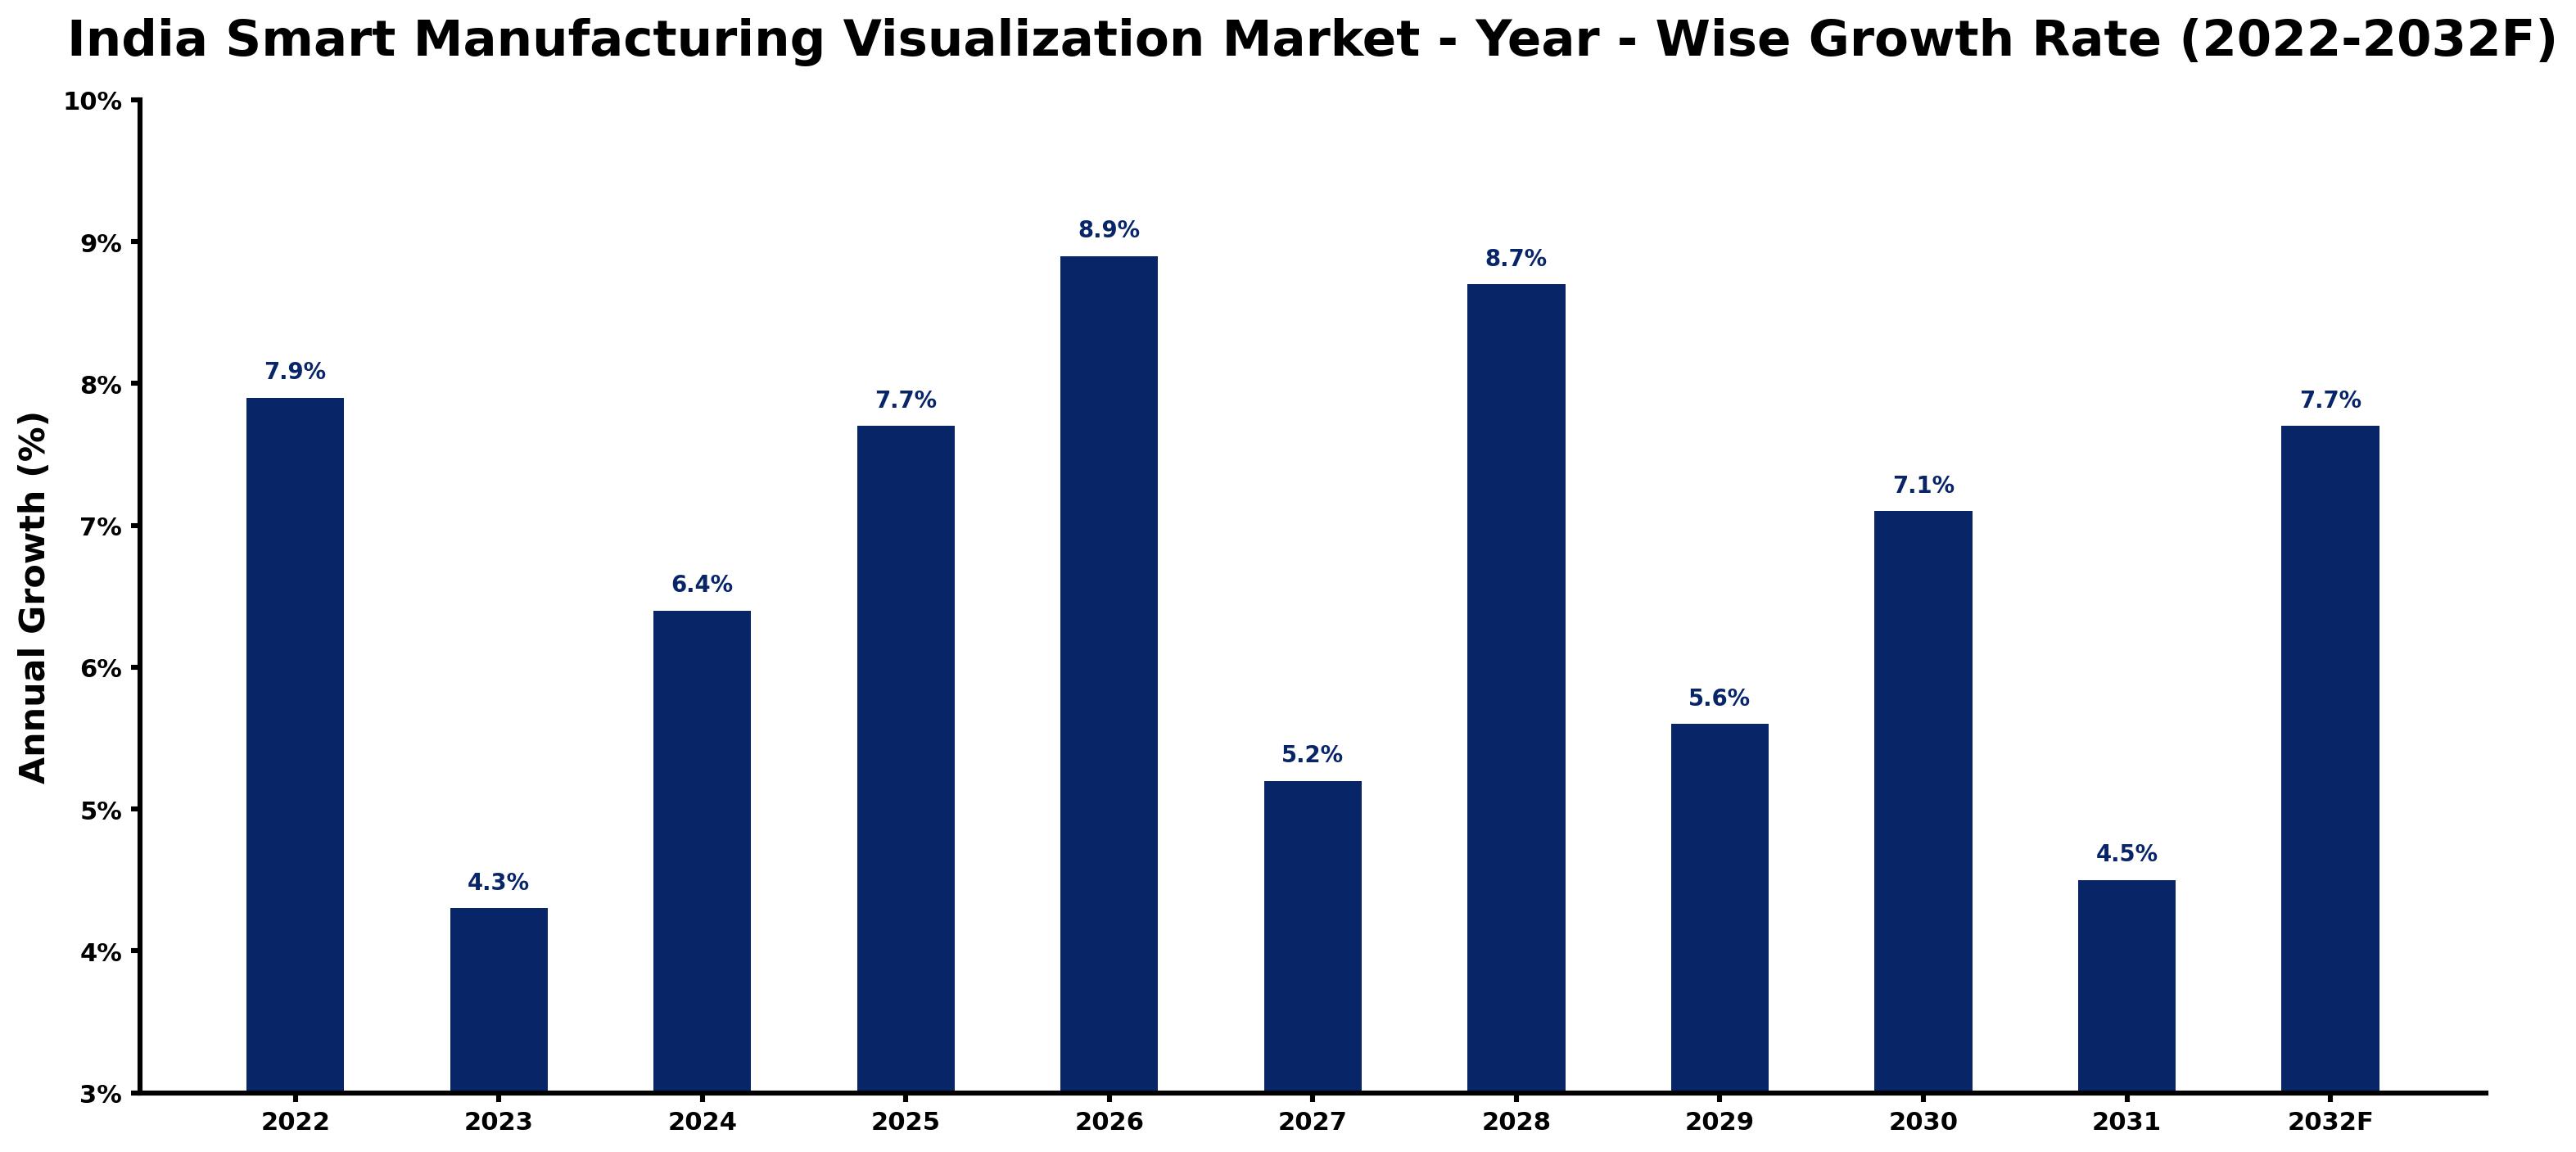
Below, each year's estimated growth is shown next to the factor that most influenced it.
| Year | Estimated Annual Growth (%) | Market Rationale |
| 2022 | 7.9 | The manufacturing sector showed strong performance, with many firms investing in smart technologies such as digital dashboards. |
| 2023 | 4.3 | Adoption of smart visualization tools slowed as firms adjusted to previous investments and economic conditions, particularly in the automotive sector. |
| 2024 | 6.4 | Increased demand for operational efficiency led to a rise in visualization tool adoption across sectors, especially among plant managers. |
| 2025 | 7.7 | The automotive industry expanded its use of smart manufacturing tools, driving growth in the market through enhanced production metrics. |
| 2026 | 8.9 | The peak growth is expected to be supported by investments in digital infrastructure and technology under the Digital India initiative. |
| 2027 | 5.2 | Growth is projected to slow as firms focus on optimising existing technologies rather than new investments in AR-based layout planning. |
| 2028 | 8.7 | Renewed interest in augmented reality tools is expected to boost growth as firms seek effective solutions for factory design. |
| 2029 | 5.6 | Market growth is anticipated to slow as firms face challenges in integrating new technologies into existing systems, particularly in data heatmaps. |
| 2030 | 7.1 | Demand for real-time metrics is expected to increase as compliance with safety regulations becomes a priority for manufacturers. |
| 2031 | 4.5 | Growth is projected to slow as firms evaluate the effectiveness of their smart manufacturing investments amid rising costs. |
| 2032 | 7.7 | A resurgence in investment is expected as firms aim to enhance operational efficiency through new initiatives, driven by the National Manufacturing Policy. |
Note: Market size estimations and growth projections presented in this report are based on 6Wresearch's proprietary forecasting methodology, utilizing the latest available industry data, government publications, and primary research inputs.
India Smart Manufacturing Visualization Market Synopsis
The India Smart Manufacturing Visualization Market encompasses advanced technologies that create visual representations of manufacturing processes, utilising software that integrates real-time data. This market is expanding due to rising demand from sectors like automotive and electronics, supported by initiatives such as the Make in India programme, which promotes smart technologies. In 2022, over 1,000 operational manufacturing plants were using digital dashboards, reflecting the increasing investment in this area and the need for improved productivity and decision-making.
Market Dynamics Impact Analysis (2026–2032)
| Factor | Type | Impact | Primary Segment Affected |
| Growing demand for real-time metrics in manufacturing processes | Driver | High | Real-Time Metrics |
| Increased adoption of AR-based layout planning in factories | Driver | High | AR-Based Layout Planning |
| Need for improved operational efficiency in manufacturing | Opportunity | High | Digital Dashboards |
| Demand for data visualization tools in the textile industry | Opportunity | Medium | Data Heatmaps |
| Challenges in integrating new technologies into existing systems | Restraint | High | 3D Floor Mapping |
| Limited availability of skilled workforce for advanced manufacturing technologies | Restraint | Medium | Spatial Simulation |
| Smart Manufacturing Visualization in India faces practical problems such as high initial investment costs. | Challenge | High | Equipment Tracking |
| Market participants struggle with rapid technological changes and the need for constant updates. | Challenge | Medium | Production Bottlenecks |
Evaluation of Drivers in India Smart Manufacturing Visualization Market (2026–2032)
Key forces behind demand, with the segment each one moves most, are listed below.
| Drivers | Primary Segment Affected | Why It Matters (Evidence) |
| Increased investment in digital infrastructure | Digital Dashboards | In 2023, over 1,000 operational manufacturing plants adopted digital dashboards, improving production metrics tracking and decision-making. |
| Growing adoption of AR technologies in factories | AR-Based Layout Planning | Over 50% of manufacturing firms are implementing AR-based layout planning to optimise factory designs and improve workflow. |
| Demand for compliance with safety regulations | Real-Time Metrics | Real-time metrics are essential for compliance with safety regulations, driving their adoption in manufacturing operations across sectors. |
| Need for operational efficiency in the automotive sector | Data Heatmaps | The automotive industry increasingly uses data heatmaps to identify operational inefficiencies and improve productivity, leading to higher adoption rates. |
| Focus on improving decision-making processes | Spatial Simulation | Spatial simulation tools are being adopted to predict outcomes and improve decision-making in manufacturing, enhancing overall operational efficiency. |
Growth across the Smart Manufacturing Visualization market in India is anchored in rising operational efficiency needs, increased investment in digital infrastructure, and the growing adoption of augmented reality technologies. In 2022, over 1,000 operational manufacturing plants implemented digital dashboards, improving their production metrics tracking. Additionally, over 50% of manufacturing firms are adopting AR-based layout planning, optimising factory designs and improving workflow. This combination of factors is driving further investment in smart visualization tools across the automotive and electronics sectors.
Evaluation of Restraints in India Smart Manufacturing Visualization Market
Below mentioned are some major restraints and their influence on market dynamics.
| Market Restraint | Primary Segment Affected | Why It Matters (Evidence) |
| Outdated infrastructure hinders technology adoption | Digital Dashboards | Many manufacturing plants struggle to integrate advanced visualization tools, delaying operational efficiency. |
| High initial investment costs | AR-Based Layout Planning | The cost of implementing smart manufacturing solutions often exceeds 30% of operational budgets, straining smaller producers. |
| Compliance with safety regulations complicates implementation | Real-Time Metrics | Increased administrative burdens for manufacturers hinder the adoption of new technologies. |
| Insufficient training for staff | Spatial Simulation | Over 50% of firms are still in early stages of adopting AR-based layout planning, creating inefficiencies. |
| Limited awareness of benefits | Data Heatmaps | Many firms do not fully understand how visualization tools can improve operational efficiency. |
India Smart Manufacturing Visualization Market Challenges
The India Smart Manufacturing Visualization Market faces a few practical problems, and the first is technology adoption. Many manufacturing plants struggle to integrate advanced visualization tools due to outdated infrastructure, which delays operational efficiency for buyers. Compliance with safety regulations complicates the implementation of new technologies, increasing administrative burdens for manufacturers. Training staff on these systems poses another challenge, as over 50% of firms are still in the early stages of adopting AR-based layout planning, creating inefficiencies in production. The high cost of implementing smart manufacturing solutions, with initial investments often exceeding 30% of operational budgets, strains the financial viability for smaller producers.
Trends in the India Smart Manufacturing Visualization Market
Several trends are reshaping the India Smart Manufacturing Visualization Market; the most important are set out below.
- Shift to Augmented Reality in Manufacturing: Since 2022, there has been a notable shift towards augmented reality tools in manufacturing processes. Over 50% of firms are adopting AR-based layout planning, improving factory design efficiency. This trend allows manufacturers to visualise layouts in real-time, improving operational workflows.
- Increased Use of Digital Dashboards: In 2022, the adoption of digital dashboards surged, with over 1,000 manufacturing plants implementing these tools. This shift enables real-time insights into production metrics, facilitating better decision-making and operational efficiency.
- Growing Importance of Real-Time Metrics: In 2023, the emphasis on real-time metrics became more pronounced as manufacturers sought compliance with safety regulations. This trend has led to increased investments in monitoring technologies, ensuring safety and efficiency in production.
- Data Heatmaps Gaining Traction: Since 2022, data heatmaps have seen increased usage, particularly in the textile industry. These tools help identify operational inefficiencies, driving improvements in production processes and resource allocation.
Investment Opportunities in the India Smart Manufacturing Visualization Market
The following opportunities in the India Smart Manufacturing Visualization Market pair current demand with a clear way in.
- Investment in Digital Dashboards: Manufacturers are increasingly looking for digital dashboard solutions to improve operational efficiency. With over 1,000 plants using these tools, there is a significant gap to fill in providing comprehensive solutions tailored to various sectors.
- Supply of AR-Based Layout Planning Tools: The growing adoption of AR-based layout planning presents a valuable opportunity. With over 50% of firms implementing these solutions, suppliers can enter the market by partnering with local manufacturers to provide tailored tools.
- Development of Real-Time Metrics Solutions: The demand for real-time metrics is rising as firms seek compliance with safety regulations. Suppliers can invest in developing advanced metrics solutions tailored for the automotive sector, which is a major user of these technologies.
- Focus on Training for Smart Manufacturing: With the Skill India Mission targeting 400 million trained individuals, there is a pressing need for training programs in smart manufacturing technologies. This presents an opportunity for educational institutions to develop relevant courses that meet industry needs.
Government Initiatives in the India Smart Manufacturing Visualization Market
In 2023, the Digital India initiative was launched with a budget of ₹10,000 crores to improve digital infrastructure in manufacturing. This initiative builds on the National Policy on Electronics 2020, which aims to promote smart manufacturing technologies and increase local production by 2025. The focus on digital infrastructure will facilitate the adoption of smart visualization tools, enabling manufacturers to improve operational efficiency and decision-making processes. Additionally, the Production Linked Incentive Scheme introduced in 2022 provides financial incentives for adopting advanced technologies, further supporting the growth of the sector.
The Ministry of Electronics and Information Technology supports various schemes that fund the implementation of smart manufacturing technologies. The Production Linked Incentive Scheme aims to boost manufacturing in key sectors by providing financial incentives for adopting advanced technologies. Additionally, the Skill India Mission focuses on training workers in advanced manufacturing technologies, including smart visualization tools, to ensure a skilled workforce is available for the industry. This initiative aims to train 400 million individuals by 2022, ensuring that the workforce meets the demands of modern manufacturing.
Future Insight of the India Smart Manufacturing Visualization Market
The India Smart Manufacturing Visualization Market is expected to evolve significantly by 2032, driven by several key factors. The National Manufacturing Policy aims to increase manufacturing's GDP contribution to 25% by 2025, which will spur the adoption of smart technologies. Government initiatives to enhance digital infrastructure will facilitate smoother transitions for firms. The establishment of the Indian Smart Manufacturing Association will promote best practices, ensuring competitiveness. With more than 1,000 operational plants already utilising digital dashboards, the trend towards real-time data integration will likely accelerate, improving operational efficiency.
Market Segmentation Analysis
The report offers a comprehensive study of the following market segments and their leading categories in the market.
By Visualization Tool – Digital Dashboards Dominated, AR-Based Layout Planning Expected to Grow Fastest
According to Dhaval Chaurasia, Assistant Manager at 6Wresearch, the largest visualization tool category in 2025 was Digital Dashboards, with a 44% share of total revenue. Digital dashboards hold the largest market share due to their ability to provide real-time insights into production metrics, which are essential for operational efficiency. With over 1,000 manufacturing plants in India employing these dashboards, they are integral to various sectors, particularly automotive and electronics. The quickest growth will come from AR-Based Layout Planning, forecast to expand at a CAGR of 8.9% between 2026 and 2032. AR-based layout planning is rapidly gaining traction, as it allows for efficient factory layout design using augmented reality, with over 50% of manufacturing firms adopting this technology. This trend is set to enhance the effectiveness of digital dashboards, further solidifying their market position. Suppliers should prioritise enhancing digital dashboard functionalities to meet the growing demand for real-time operational insights.
By Core Feature – Real-Time Metrics Dominated, Spatial Simulation Expected to Grow Fastest
With a 38% revenue share in 2025, Real-Time Metrics was the largest core feature category. Real-time metrics dominate this segment because they are crucial for continuously monitoring production performance, directly impacting operational efficiency. Their role in ensuring compliance with safety regulations further strengthens their leading market share. Spatial Simulation is projected to grow fastest, at a CAGR of 8.8% during 2026–2032. Spatial simulation is emerging as the fastest-growing feature, as it assists in predicting outcomes of different manufacturing scenarios, increasingly valued for informed decision-making. The rising interest in predictive analytics will elevate the significance of real-time metrics even more. Buyers should consider investing in solutions that integrate real-time metrics with predictive capabilities to optimise operational decision-making.
By Visualization Method – Web & Mobile Interface Dominated, Augmented Reality Expected to Grow Fastest
Web & Mobile Interface held a 49% share of the India Smart Manufacturing Visualization Market by visualization method in 2025. The web and mobile interface commands the largest market share as it enhances access to visualization tools, making them more user-friendly for a broad audience. This accessibility is crucial in a market where improving operational efficiency is a key focus. Over 2026–2032, Augmented Reality is expected to post the fastest growth, at a CAGR of 9.1%. Augmented reality is the fastest-growing visualization method, providing an enhanced user experience and immersive insights into manufacturing processes. Its increasing adoption across various sectors is likely to drive further interest in web and mobile interfaces. Suppliers need to concentrate on developing augmented reality features to stay competitive in the evolving visualization methods market.
By End User – Plant Managers Dominated, Manufacturing Analysts Expected to Grow Fastest
Plant Managers took a 51% share of end user in 2025, more than any other category. Plant managers represent the largest share of end users as they are key to operational oversight and rely heavily on visualization tools for managing production. Their direct involvement in day-to-day operations makes them essential for driving the adoption of smart manufacturing technologies. Manufacturing Analysts are set to record the highest CAGR in this split, 9.6% over 2026–2032. Manufacturing analysts are the fastest-growing user group, as they increasingly rely on visualization for data analysis and reporting, which is vital for strategic decision-making. Their expanding role in data-driven environments will further elevate the importance of tools used by plant managers. Suppliers must tailor their offerings to meet the specific needs of manufacturing analysts to capture this growing market segment.
Key Attractiveness of the Report
- 10 Years of Market Numbers
- Historical Data Starting from 2022 to 2025
- Base Year 2025
- Forecast Data until 2032
- Key Performance Indicators Impacting the Market
- Major Upcoming Developments and Projects
Key Highlights of the Report:
- India Smart Manufacturing Visualization Market Outlook
- Market Size of India Smart Manufacturing Visualization Market, 2025
- Forecast of India Smart Manufacturing Visualization Market, 2032
- Historical Data and Forecast of India Smart Manufacturing Visualization Revenues & Volume for the Period 2022 - 2032F
- India Smart Manufacturing Visualization Market Trend Evolution
- India Smart Manufacturing Visualization Market Drivers and Challenges
- India Smart Manufacturing Visualization Price Trends
- India Smart Manufacturing Visualization Porter's Five Forces
- India Smart Manufacturing Visualization Industry Life Cycle
- Historical Data and Forecast of India Smart Manufacturing Visualization Market Revenues & Volume By Visualization Tool for the Period 2022 - 2032F
- Historical Data and Forecast of India Smart Manufacturing Visualization Market Revenues & Volume By Digital Dashboards for the Period 2022 - 2032F
- Historical Data and Forecast of India Smart Manufacturing Visualization Market Revenues & Volume By AR-Based Layout Planning for the Period 2022 - 2032F
- Historical Data and Forecast of India Smart Manufacturing Visualization Market Revenues & Volume By Data Heatmaps for the Period 2022 - 2032F
- Historical Data and Forecast of India Smart Manufacturing Visualization Market Revenues & Volume By 3D Floor Mapping for the Period 2022 - 2032F
- Historical Data and Forecast of India Smart Manufacturing Visualization Market Revenues & Volume By Core Feature for the Period 2022 - 2032F
- Historical Data and Forecast of India Smart Manufacturing Visualization Market Revenues & Volume By Real-Time Metrics for the Period 2022 - 2032F
- Historical Data and Forecast of India Smart Manufacturing Visualization Market Revenues & Volume By Spatial Simulation for the Period 2022 - 2032F
- Historical Data and Forecast of India Smart Manufacturing Visualization Market Revenues & Volume By Production Bottlenecks for the Period 2022 - 2032F
- Historical Data and Forecast of India Smart Manufacturing Visualization Market Revenues & Volume By Equipment Tracking for the Period 2022 - 2032F
- Historical Data and Forecast of India Smart Manufacturing Visualization Market Revenues & Volume By Visualization Method for the Period 2022 - 2032F
- Historical Data and Forecast of India Smart Manufacturing Visualization Market Revenues & Volume By Web & Mobile Interface for the Period 2022 - 2032F
- Historical Data and Forecast of India Smart Manufacturing Visualization Market Revenues & Volume By Augmented Reality for the Period 2022 - 2032F
- Historical Data and Forecast of India Smart Manufacturing Visualization Market Revenues & Volume By Visual Analytics for the Period 2022 - 2032F
- Historical Data and Forecast of India Smart Manufacturing Visualization Market Revenues & Volume By CAD/IoT Sync for the Period 2022 - 2032F
- Historical Data and Forecast of India Smart Manufacturing Visualization Market Revenues & Volume By End User for the Period 2022 - 2032F
- Historical Data and Forecast of India Smart Manufacturing Visualization Market Revenues & Volume By Plant Managers for the Period 2022 - 2032F
- Historical Data and Forecast of India Smart Manufacturing Visualization Market Revenues & Volume By Factory Designers for the Period 2022 - 2032F
- Historical Data and Forecast of India Smart Manufacturing Visualization Market Revenues & Volume By Manufacturing Analysts for the Period 2022 - 2032F
- Historical Data and Forecast of India Smart Manufacturing Visualization Market Revenues & Volume By Facility Managers for the Period 2022 - 2032F
- India Smart Manufacturing Visualization Import Export Trade Statistics
- Market Opportunity Assessment By Visualization Tool
- Market Opportunity Assessment By Core Feature
- Market Opportunity Assessment By Visualization Method
- Market Opportunity Assessment By End User
- India Smart Manufacturing Visualization Top Companies Market Share
- India Smart Manufacturing Visualization Competitive Benchmarking By Technical and Operational Parameters
- India Smart Manufacturing Visualization Company Profiles
- India Smart Manufacturing Visualization Key Strategic Recommendations
Market Covered
Segments analysed in this report are listed below.
By Visualization Tool
- Digital Dashboards
- AR-Based Layout Planning
- Data Heatmaps
- 3D Floor Mapping
By Core Feature
- Real-Time Metrics
- Spatial Simulation
- Production Bottlenecks
- Equipment Tracking
By Visualization Method
- Web & Mobile Interface
- Augmented Reality
- Visual Analytics
- CAD/IoT Sync
By End User
- Plant Managers
- Factory Designers
- Manufacturing Analysts
- Facility Managers































