China Smart Manufacturing Visualization Market Size & Growth Rate
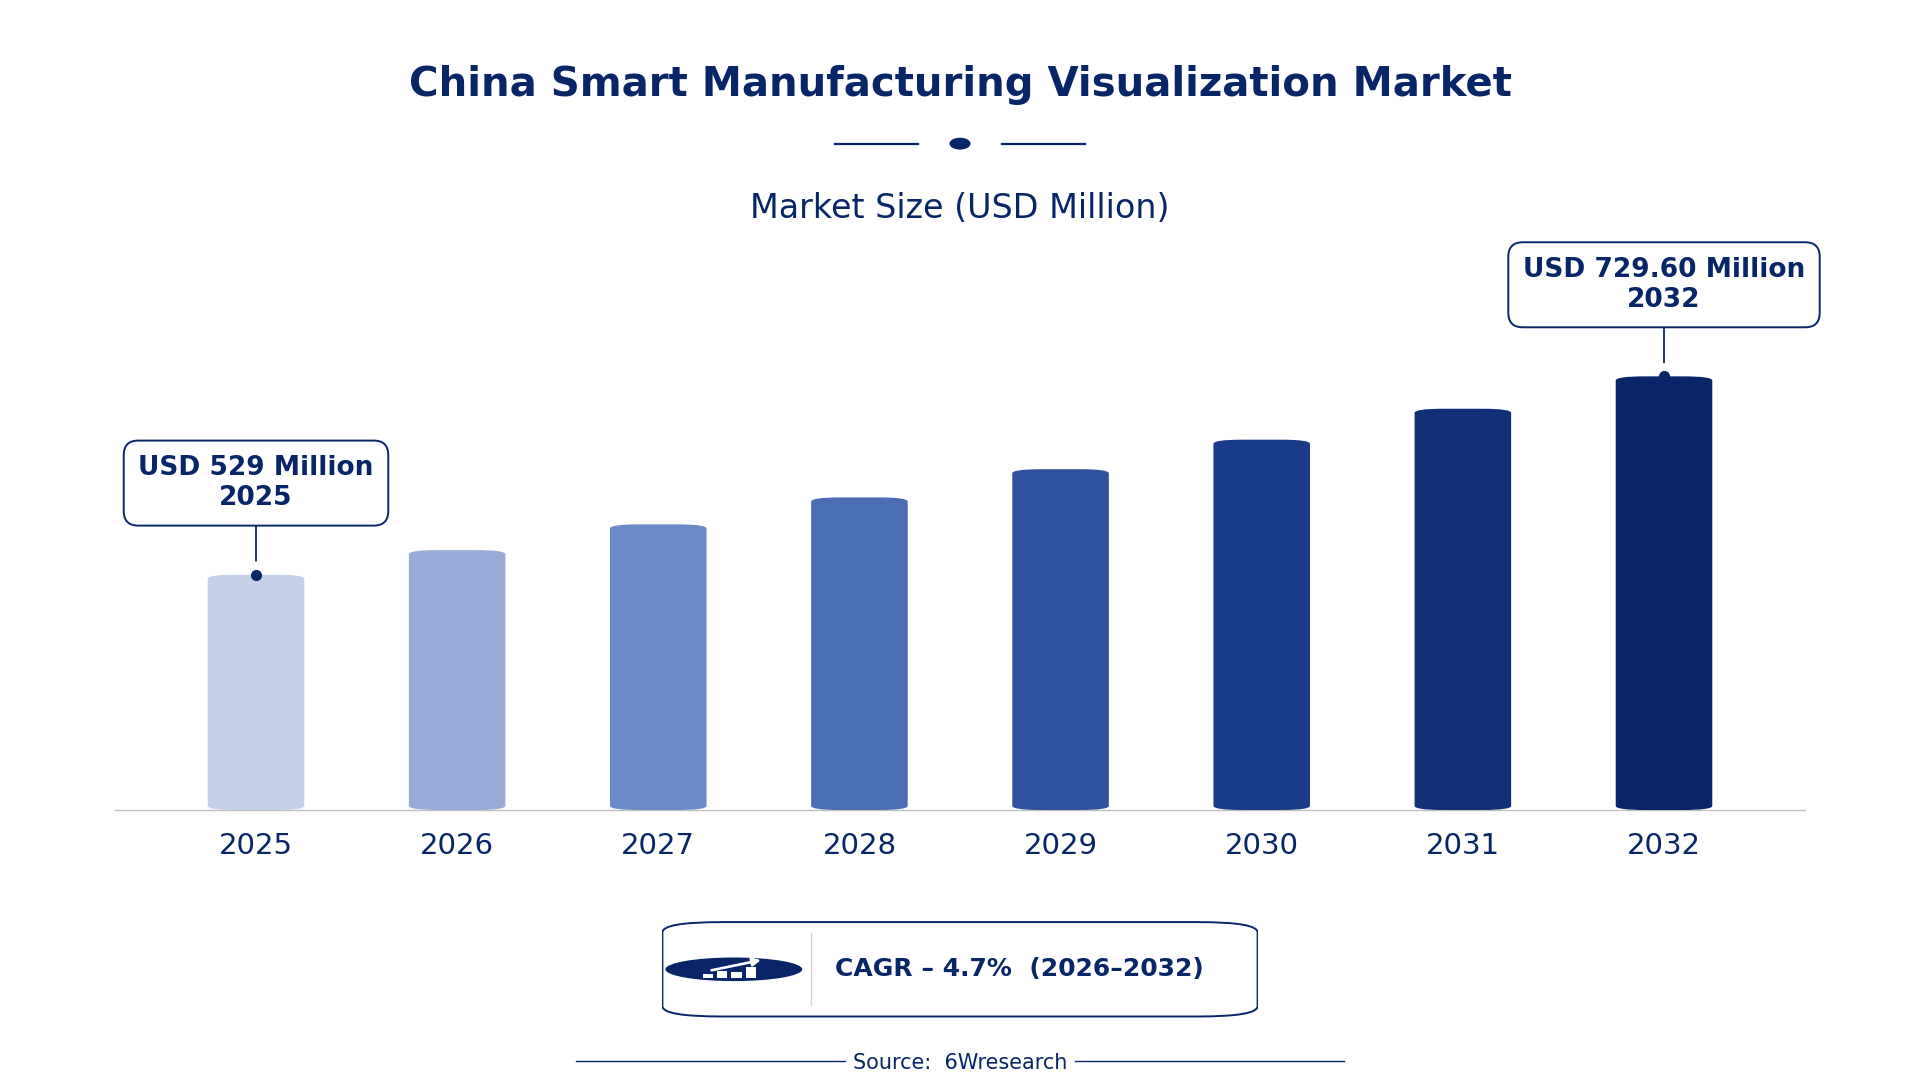
According to 6Wresearch internal database and industry insights, the China Smart Manufacturing Visualization Market was valued at USD 529.0 million in 2025 and is projected to reach USD 729.60 million by 2032, growing at a CAGR of approximately 4.7% during 2026–2032.
China Smart Manufacturing Visualization Market Highlights
| Report Metric | Details |
| Report Name | China Smart Manufacturing Visualization Market |
| Market Size 2025 | USD 529.0 million |
| Market Size 2032 | USD 729.60 million |
| Absolute Growth 2025–2032 | USD 200.60 million |
| CAGR 2026–2032 | 4.7% |
| Peak Annual Growth | 6.5% in 2030 |
| Forecast Period | 2026–2032 |
| Historical Data | 2022–2025 |
| Base Year | 2025 |
| Leading Visualization Tool, 2025 | Digital Dashboards (39% share) |
| Leading Core Feature, 2025 | Real-Time Metrics (41% share) |
| Leading Visualization Method, 2025 | Web & Mobile Interface (56% share) |
| Leading End User, 2025 | Plant Managers (45% share) |
| Fastest-Growing Visualization Tool | AR-Based Layout Planning (6.6% CAGR) |
| Fastest-Growing Core Feature | Spatial Simulation (6.1% CAGR) |
| Fastest-Growing Visualization Method | Augmented Reality (6.6% CAGR) |
| Fastest-Growing End User | Manufacturing Analysts (5.9% CAGR) |
| Growing Sector | Manufacturing |
| Key End Users | Plant Managers, Factory Designers, Manufacturing Analysts, Facility Managers |
China Smart Manufacturing Visualization Market Year-wise Growth Rate and Key Drivers (2022–2032)
This graph illustrates the annual growth rates of the market from 2022 to 2032, highlighting a steady upward trajectory and projected market expansion over the forecast period.
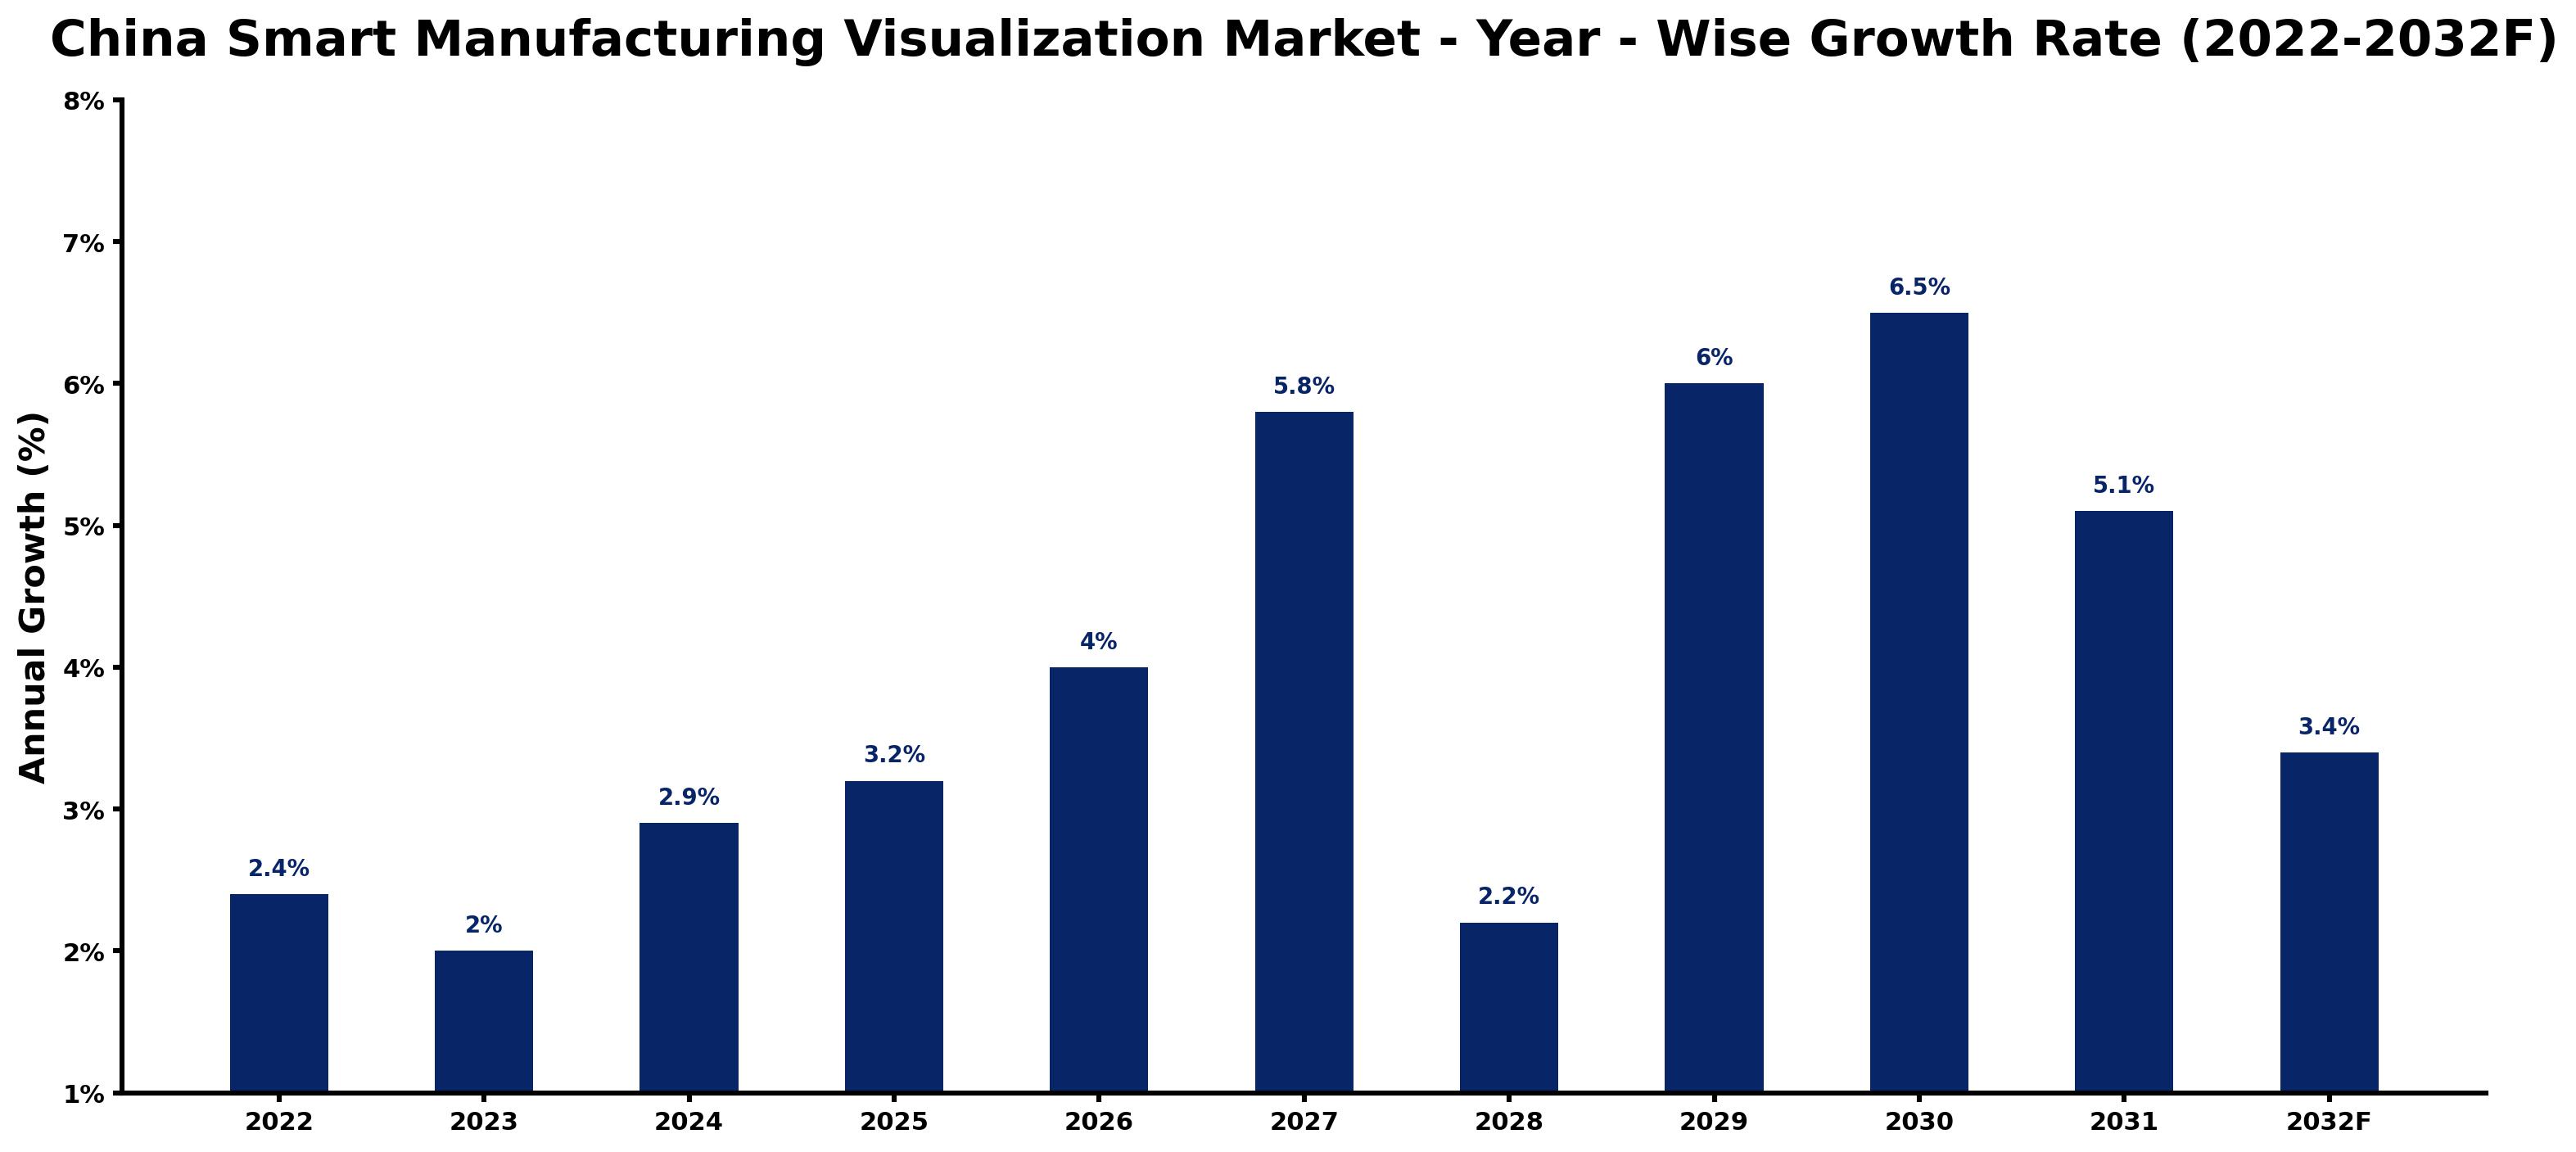
Year by year, the estimates below pair each growth rate with the development that shaped it.
| Year | Estimated Annual Growth (%) | Market Rationale |
| 2022 | 2.4 | The market experienced steady growth as companies began adopting visualization technologies from the 'Smart Manufacturing Development Plan'. |
| 2023 | 2.0 | Growth slowed slightly due to ongoing investments in technology and the 'Made in China 2025' initiative. |
| 2024 | 2.9 | Increased demand for operational efficiency from Plant Managers led to faster growth in visualization tools. |
| 2025 | 3.2 | The market grew further as more manufacturers implemented real-time metrics for monitoring, driven by the National Standard for Smart Manufacturing. |
| 2026 | 4.0 | Investment in smart manufacturing technologies is expected to drive growth as firms upgrade systems and adopt new tools. |
| 2027 | 5.8 | Demand surged as manufacturers sought to optimise workflows and reduce bottlenecks through advanced visualization solutions. |
| 2028 | 2.2 | Growth is projected to slow as the market stabilises following rapid advancements in technology. |
| 2029 | 6.0 | A resurgence in investment in AR technologies is expected to spur faster growth once again as factories adopt new solutions. |
| 2030 | 6.5 | The market is projected to peak with strong adoption of real-time metrics and advanced visualization tools. |
| 2031 | 5.1 | Growth is expected to slow as the market matures and firms focus on integrating existing technologies. |
| 2032 | 3.4 | A further slowdown is anticipated as firms consolidate their technology investments and streamline operations. |
Note: Market size estimations and growth projections presented in this report are based on 6Wresearch's proprietary forecasting methodology, utilizing the latest available industry data, government publications, and primary research inputs.
China Smart Manufacturing Visualization Market Synopsis
Smart Manufacturing Visualization in China encompasses technologies that enhance the visibility of production processes through digital tools. These tools improve operational efficiency and facilitate better decision-making in production environments. The China Smart Manufacturing Visualization Market is projected to reach 1 trillion yuan by 2025, driven by substantial investments from over 70% of manufacturing firms. The 'Smart Manufacturing Development Plan' and 'Made in China 2025' initiative are primary catalysts for this growth, promoting the adoption of advanced visualization technologies across various sectors.
Market Dynamics Impact Analysis (2026–2032)
| Factor | Type | Impact | Primary Segment Affected |
| Growing investment in digital tools enhances operational efficiency. | Driver | High | Digital Dashboards |
| Increased demand for real-time metrics drives technology adoption. | Driver | High | Real-Time Metrics |
| Rising demand for AR technologies creates new market opportunities. | Opportunity | High | AR-Based Layout Planning |
| The Guangdong province's leadership in smart manufacturing presents investment potential. | Opportunity | Medium | Data Heatmaps |
| High initial costs deter some manufacturers from adopting new technologies. | Restraint | High | Web & Mobile Interface |
| Limited awareness of benefits hampers wider adoption of visualization tools. | Restraint | Medium | Spatial Simulation |
| Supply chain disruptions affect timely implementation of visualization technologies. | Challenge | High | Equipment Tracking |
| Technological integration challenges slow down project timelines for manufacturers. | Challenge | Medium | Production Bottlenecks |
Evaluation of Drivers in China Smart Manufacturing Visualization Market (2026–2032)
The main growth drivers and the segments they affect most are set out below.
| Drivers | Primary Segment Affected | Why It Matters (Evidence) |
| Increased investment in smart manufacturing technologies drives demand for visualization tools. | Digital Dashboards | Over 70% of manufacturing firms are investing in visualization technologies to improve decision-making capabilities. |
| The need for real-time monitoring systems boosts demand for advanced metrics. | Real-Time Metrics | By 2025, 80% of manufacturers are expected to utilise real-time metrics for production monitoring, enhancing operational oversight. |
| The push for efficient space utilisation in factories increases the market for AR-based solutions. | AR-Based Layout Planning | In 2023, 30% of factories in China adopted AR technologies for layout planning, reflecting a shift towards modern manufacturing practices. |
| Growing emphasis on data-driven decision-making increases demand for data visualisation tools. | Data Heatmaps | The 'Digital Economy Development Plan' aims to integrate smart manufacturing with AI by 2025, driving demand for advanced analytics. |
| The need for better operational oversight drives investment in visualisation technologies. | Web & Mobile Interface | The annual 'China Smart Manufacturing Conference' promotes industry collaboration and technology adoption, encouraging firms to invest. |
Market growth for Smart Manufacturing Visualization in China is underpinned by increased investment in smart manufacturing technologies, with over 70% of manufacturing firms adopting visualization tools. The need for real-time monitoring systems drives demand for advanced metrics, as 80% of manufacturers are expected to utilize these by 2025. The push for efficient space utilization in factories increases the market for AR-based solutions, with 30% of factories adopting AR technologies for layout planning in 2023. Growing emphasis on data-driven decision-making is also increasing demand for data visualization tools, supported by the 'Digital Economy Development Plan'. The demand for better operational oversight propels investment in visualization technologies, as highlighted by industry conferences promoting collaboration.
Evaluation of Restraints in China Smart Manufacturing Visualization Market
Below mentioned are some major restraints and their influence on market dynamics.
| Market Restraint | Primary Segment Affected | Why It Matters (Evidence) |
| High initial costs deter some manufacturers from adopting new technologies. | Web & Mobile Interface | Many firms hesitate to invest heavily in new visualization tools due to budget constraints, which can consume up to 20% of their annual budgets. |
| Limited awareness of benefits hampers wider adoption of visualization tools. | Spatial Simulation | Some manufacturers remain unaware of how visualization can improve operational efficiency, leading to missed opportunities for upgrades. |
| Supply chain disruptions affect timely implementation of visualization technologies. | Equipment Tracking | Delays in receiving necessary components hinder the rollout of new systems, impacting overall productivity for manufacturers. |
| Technological integration challenges slow down project timelines for manufacturers. | Real-Time Metrics | Manufacturers must navigate various standards, which can slow the adoption of new technologies and increase costs. |
| Inadequate training resources limit effective use of visualization tools. | Data Heatmaps | Many firms lack access to training programs, resulting in underutilisation of advanced visualization capabilities. |
China Smart Manufacturing Visualization Market Challenges
Regulatory compliance in the China Smart Manufacturing Visualization market presents challenges for producers, as adherence to the 'National Standard for Smart Manufacturing' necessitates substantial investment, costing up to 20% of their annual budgets. Skills shortages impede progress, with over 70% of manufacturing firms reporting difficulties in sourcing qualified personnel skilled in advanced visualization tools, which delays project timelines and escalates operational costs for producers. Supply chain inefficiencies stem from limited access to high-quality software solutions, hindering importers' competitive edge. Buyers face integration challenges with new visualization technologies, as many lack the necessary infrastructure, resulting in prolonged delays in achieving operational efficiency.
Trends in the China Smart Manufacturing Visualization Market
Below mentioned are some of the trends shaping the China Smart Manufacturing Visualization Market growth.
- Shift from Traditional to Smart Manufacturing: In 2023, 30% of factories in China adopted AR technologies for layout planning, reflecting a growing trend towards real-time data usage in manufacturing. This transition is vital for improving production efficiency.
- Emergence of Augmented Reality in Manufacturing: In 2022, the 'National Standard for Smart Manufacturing' was approved, promoting data-driven decision-making in manufacturing environments. This standard is essential for improving operational efficiency.
- Growth of Real-Time Metrics Utilization: By 2025, 80% of manufacturers are expected to adopt real-time metrics for production monitoring, enhancing operational oversight. This shift will significantly impact decision-making processes.
- Integration of AI with Smart Manufacturing: The 'Digital Economy Development Plan' aims to combine smart manufacturing with AI by 2025, streamlining processes and increasing productivity across the sector.
Investment Opportunities in the China Smart Manufacturing Visualization Market
Below are the investment opportunities with the strongest case in the China Smart Manufacturing Visualization Market.
- Investment in Visualization Technologies in Guangdong Province: Guangdong province currently leads in smart manufacturing adoption, with over 1,000 projects funded. Investing in visualization technologies here offers a strong opportunity for suppliers, particularly in AR-based solutions.
- Partnerships in Smart Manufacturing Projects: As 80% of manufacturers are expected to utilise real-time metrics by 2025, there is a clear opportunity for investment in solutions that deliver these capabilities.
- Supply Chain Solutions for Visualization Technologies: With ongoing supply chain disruptions, there is an urgent need for solutions that ensure timely delivery of visualization tools. Targeting manufacturers in regions like Guangdong can yield substantial returns.
- Training Programs for Visualization Tools: As manufacturers strive to adopt new technologies, there is an opportunity to offer training programs that improve the effective use of visualization tools, enhancing operational efficiency.
Government Initiatives in the China Smart Manufacturing Visualization Market
The 'Smart Manufacturing Development Plan' issued by the Ministry of Industry and Information Technology in 2021 aims to improve smart manufacturing capabilities by 2025. This plan encourages manufacturers to adopt advanced visualization technologies and improve operational efficiency. Additionally, the 'Made in China 2025' initiative, updated in 2020, sets new targets for smart manufacturing adoption across various industries, further promoting the use of smart technologies in production processes.
The Ministry of Industry and Information Technology allocates funding for smart manufacturing projects, including 30 billion yuan in 2021. This funding supports manufacturers in adopting visualization technologies and improving their operational capabilities. The 'Digital Economy Development Plan' launched in 2022 by the State Council also promotes the integration of digital technologies in manufacturing sectors, ensuring that buyers can access the latest advancements in smart manufacturing.
Future Insight of the China Smart Manufacturing Visualization Market
Several forward-looking factors should support the China Smart Manufacturing Visualization market in the coming years. The government's 50 billion yuan investment in 2023 for smart manufacturing innovations will stimulate technological advancements. By 2025, 80% of manufacturers are expected to utilise real-time metrics for production monitoring, significantly improving operational workflows. The integration of AI with smart manufacturing, as outlined in the 'Digital Economy Development Plan', will streamline processes and increase productivity across the sector.
Market Segmentation Analysis
The report offers a comprehensive study of the following market segments and their leading categories in the market.
By Visualization Tool – Digital Dashboards Dominated, AR-Based Layout Planning Expected to Grow Fastest
According to Dhaval Chaurasia, Assistant Manager at 6Wresearch, Digital Dashboards held a 39% share of the China Smart Manufacturing Visualization Market by visualization tool in 2025. Digital Dashboards dominate the market because they provide real-time insights for decision-making, essential for over 70% of manufacturing firms investing in visualization technologies. Their widespread application in various manufacturing sectors, particularly in the Guangdong province, solidifies their leading position. Over 2026–2032, AR-Based Layout Planning is expected to post the fastest growth, at a CAGR of 6.6%. AR-Based Layout Planning is rapidly gaining traction as 30% of factories in China have adopted AR technologies for layout planning, significantly improving space utilisation. This trend is likely to continue as manufacturers increasingly seek effective solutions to optimise operational efficiency. Suppliers should focus on developing advanced AR solutions to meet the rising demand for efficient layout planning in manufacturing.
By Core Feature – Real-Time Metrics Dominated, Spatial Simulation Expected to Grow Fastest
The largest core feature category in 2025 was Real-Time Metrics, with a 41% share of total revenue. Real-Time Metrics hold the largest share as they are crucial for monitoring production performance, a necessity for manufacturers aiming to enhance operational efficiency. The government's strong support for smart manufacturing highlights the importance of real-time data in this sector. The quickest growth will come from Spatial Simulation, forecast to expand at a CAGR of 6.1% between 2026 and 2032. Spatial Simulation is witnessing accelerated growth as it assists in planning and optimising workflows, aligning with the increasing need for efficiency in manufacturing processes. This growth is further encouraged by the anticipated integration of smart manufacturing with AI by 2025. Buyers should prioritise solutions that offer robust spatial simulation capabilities to improve their manufacturing workflows.
By Visualization Method – Web & Mobile Interface Dominated, Augmented Reality Expected to Grow Fastest
In 2025, Web & Mobile Interface led the visualization method split with a 56% share. Web & Mobile Interface leads the market as it allows remote access to manufacturing data, a vital feature for modern manufacturing environments. This accessibility is particularly valued by plant managers who need to oversee operations from various locations. Augmented Reality is projected to grow fastest, at a CAGR of 6.6% during 2026–2032. Augmented Reality is quickly gaining popularity for its ability to enhance training and operational efficiency, making it a critical tool for manufacturers. As more firms recognise its benefits, the adoption rate is expected to rise significantly. Suppliers must invest in developing user-friendly AR applications to address the growing demand for improved training solutions in manufacturing.
By End User – Plant Managers Dominated, Manufacturing Analysts Expected to Grow Fastest
With a 45% revenue share in 2025, Plant Managers was the largest end user category. Plant Managers constitute the largest user group as they rely on smart manufacturing visualization tools for operational oversight, ensuring seamless production processes. Their essential role drives the adoption of these technologies across various sectors. Manufacturing Analysts are set to record the highest CAGR in this split, 5.9% over 2026–2032. Manufacturing Analysts are experiencing the fastest growth as they analyse data for process improvements, a function that is becoming increasingly vital in the competitive landscape. Their insights play a key role in refining manufacturing strategies and operations. Vendors should tailor their offerings to meet the specific analytical needs of manufacturing analysts to capture this expanding segment.
Key Attractiveness of the Report
- 10 Years of Market Numbers
- Historical Data Starting from 2022 to 2025
- Base Year 2025
- Forecast Data until 2032
- Key Performance Indicators Impacting the Market
- Major Upcoming Developments and Projects
Key Highlights of the Report:
- China Smart Manufacturing Visualization Market Outlook
- Market Size of China Smart Manufacturing Visualization Market, 2025
- Forecast of China Smart Manufacturing Visualization Market, 2032
- Historical Data and Forecast of China Smart Manufacturing Visualization Revenues & Volume for the Period 2022 - 2032F
- China Smart Manufacturing Visualization Market Trend Evolution
- China Smart Manufacturing Visualization Market Drivers and Challenges
- China Smart Manufacturing Visualization Price Trends
- China Smart Manufacturing Visualization Porter's Five Forces
- China Smart Manufacturing Visualization Industry Life Cycle
- Historical Data and Forecast of China Smart Manufacturing Visualization Market Revenues & Volume By Visualization Tool for the Period 2022 - 2032F
- Historical Data and Forecast of China Smart Manufacturing Visualization Market Revenues & Volume By Digital Dashboards for the Period 2022 - 2032F
- Historical Data and Forecast of China Smart Manufacturing Visualization Market Revenues & Volume By AR-Based Layout Planning for the Period 2022 - 2032F
- Historical Data and Forecast of China Smart Manufacturing Visualization Market Revenues & Volume By Data Heatmaps for the Period 2022 - 2032F
- Historical Data and Forecast of China Smart Manufacturing Visualization Market Revenues & Volume By 3D Floor Mapping for the Period 2022 - 2032F
- Historical Data and Forecast of China Smart Manufacturing Visualization Market Revenues & Volume By Core Feature for the Period 2022 - 2032F
- Historical Data and Forecast of China Smart Manufacturing Visualization Market Revenues & Volume By Real-Time Metrics for the Period 2022 - 2032F
- Historical Data and Forecast of China Smart Manufacturing Visualization Market Revenues & Volume By Spatial Simulation for the Period 2022 - 2032F
- Historical Data and Forecast of China Smart Manufacturing Visualization Market Revenues & Volume By Production Bottlenecks for the Period 2022 - 2032F
- Historical Data and Forecast of China Smart Manufacturing Visualization Market Revenues & Volume By Equipment Tracking for the Period 2022 - 2032F
- Historical Data and Forecast of China Smart Manufacturing Visualization Market Revenues & Volume By Visualization Method for the Period 2022 - 2032F
- Historical Data and Forecast of China Smart Manufacturing Visualization Market Revenues & Volume By Web & Mobile Interface for the Period 2022 - 2032F
- Historical Data and Forecast of China Smart Manufacturing Visualization Market Revenues & Volume By Augmented Reality for the Period 2022 - 2032F
- Historical Data and Forecast of China Smart Manufacturing Visualization Market Revenues & Volume By Visual Analytics for the Period 2022 - 2032F
- Historical Data and Forecast of China Smart Manufacturing Visualization Market Revenues & Volume By CAD/IoT Sync for the Period 2022 - 2032F
- Historical Data and Forecast of China Smart Manufacturing Visualization Market Revenues & Volume By End User for the Period 2022 - 2032F
- Historical Data and Forecast of China Smart Manufacturing Visualization Market Revenues & Volume By Plant Managers for the Period 2022 - 2032F
- Historical Data and Forecast of China Smart Manufacturing Visualization Market Revenues & Volume By Factory Designers for the Period 2022 - 2032F
- Historical Data and Forecast of China Smart Manufacturing Visualization Market Revenues & Volume By Manufacturing Analysts for the Period 2022 - 2032F
- Historical Data and Forecast of China Smart Manufacturing Visualization Market Revenues & Volume By Facility Managers for the Period 2022 - 2032F
- China Smart Manufacturing Visualization Import Export Trade Statistics
- Market Opportunity Assessment By Visualization Tool
- Market Opportunity Assessment By Core Feature
- Market Opportunity Assessment By Visualization Method
- Market Opportunity Assessment By End User
- China Smart Manufacturing Visualization Top Companies Market Share
- China Smart Manufacturing Visualization Competitive Benchmarking By Technical and Operational Parameters
- China Smart Manufacturing Visualization Company Profiles
- China Smart Manufacturing Visualization Key Strategic Recommendations
Market Covered
Segments analysed in this report are listed below.
By Visualization Tool
- Digital Dashboards
- AR-Based Layout Planning
- Data Heatmaps
- 3D Floor Mapping
By Core Feature
- Real-Time Metrics
- Spatial Simulation
- Production Bottlenecks
- Equipment Tracking
By Visualization Method
- Web & Mobile Interface
- Augmented Reality
- Visual Analytics
- CAD/IoT Sync
By End User
- Plant Managers
- Factory Designers
- Manufacturing Analysts
- Facility Managers































