India Spectroscopy Equipment Market Size & Growth Rate
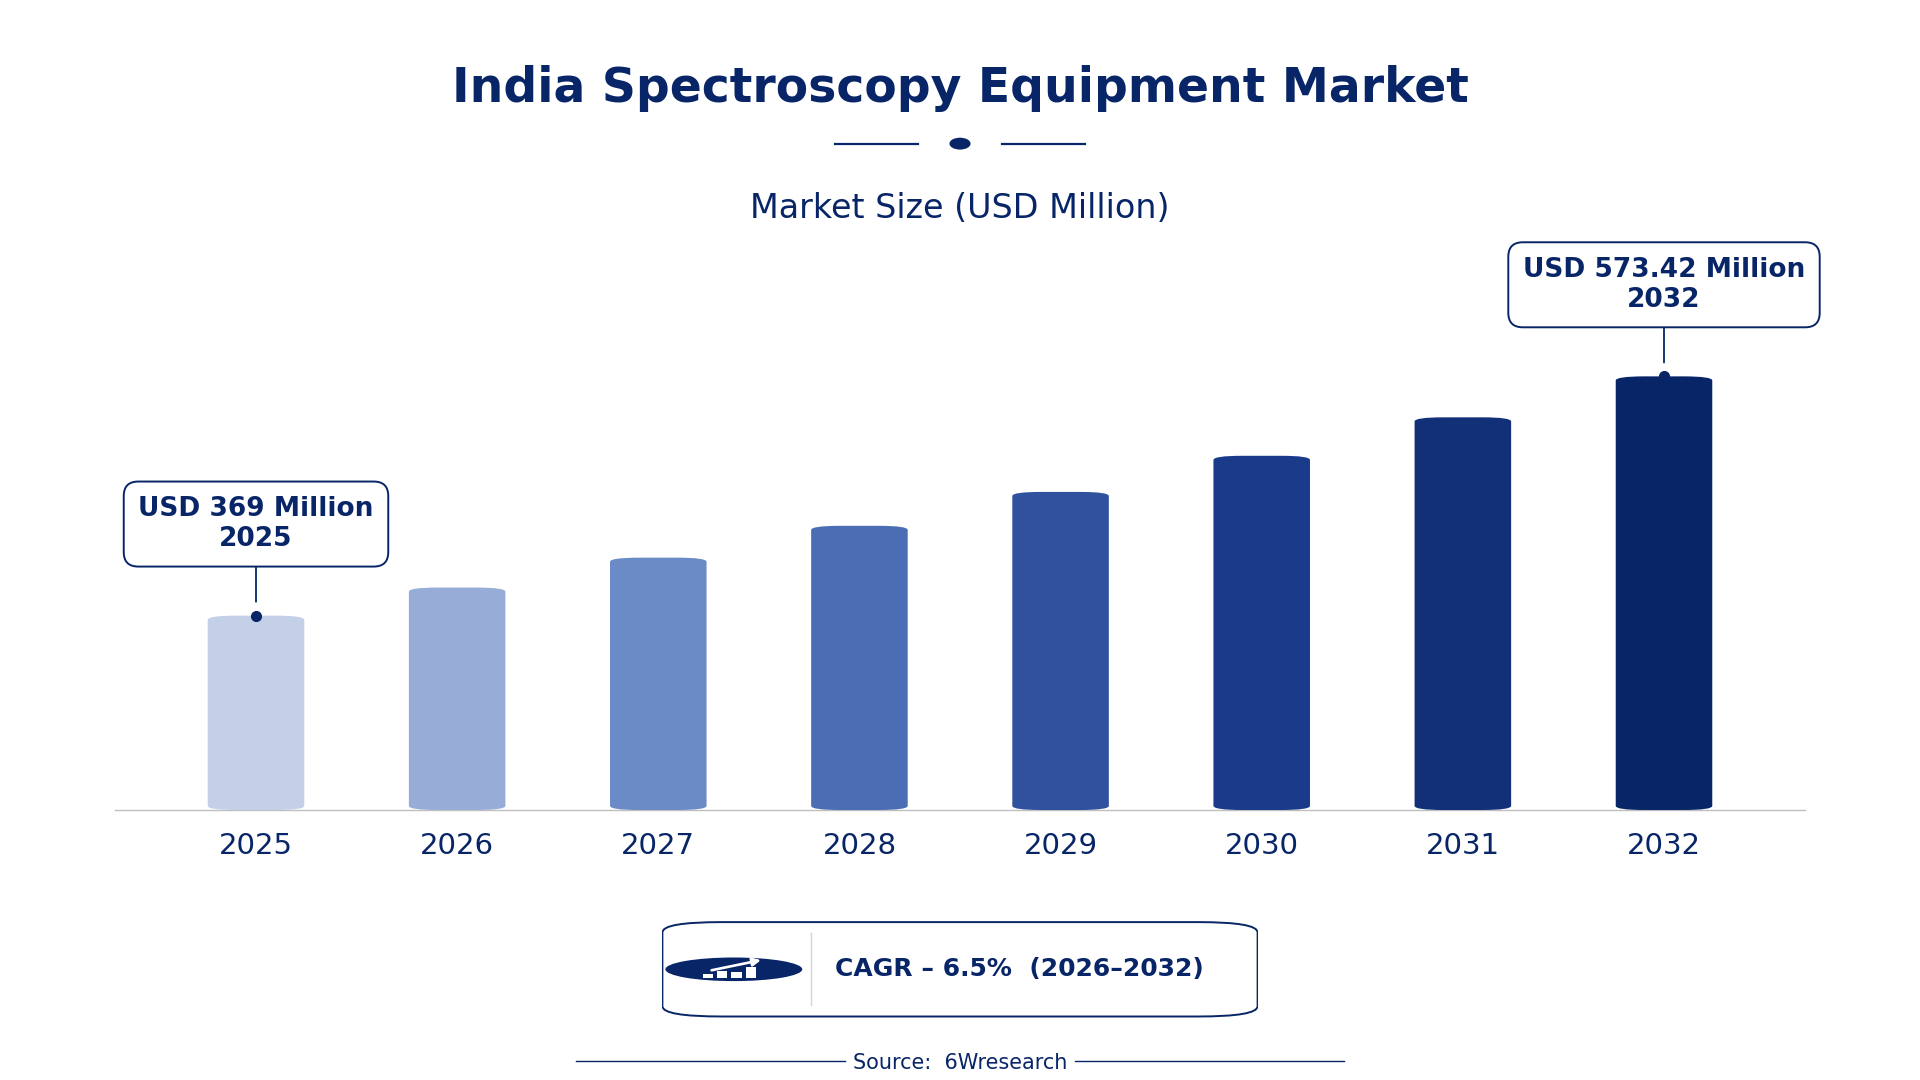
According to 6Wresearch internal database and industry insights, the India Spectroscopy Equipment Market was valued at USD 369.0 million in 2025 and is projected to reach USD 573.42 million by 2032, growing at a CAGR of approximately 6.5% during 2026–2032.
India Spectroscopy Equipment Market Highlights
| Report Metric | Details |
| Report Name | India Spectroscopy Equipment Market |
| Market Size 2025 | USD 369.0 million |
| Market Size 2032 | USD 573.42 million |
| Absolute Growth 2025–2032 | USD 204.42 million |
| CAGR 2026–2032 | 6.5% |
| Peak Annual Growth | 8.7% in 2028 |
| Forecast Period | 2026–2032 |
| Historical Data | 2022–2025 |
| Base Year | 2025 |
| Leading Equipment Type, 2025 | Mass Spectrometers (44% share) |
| Leading Spectral Range, 2025 | Mass-to-Charge Ratio (38% share) |
| Leading Detection Principle, 2025 | Ion Detection (35% share) |
| Leading End User, 2025 | Biotech & Pharma Firms (46% share) |
| Fastest-Growing Equipment Type | Raman Spectrometers (7.5% CAGR) |
| Fastest-Growing Spectral Range | Infrared (8.9% CAGR) |
| Fastest-Growing Detection Principle | Molecular Identification (7.9% CAGR) |
| Fastest-Growing End User | Food Safety Laboratories (8.8% CAGR) |
| Growing Sector | Biotechnology and Pharmaceuticals |
| Key End Users | Biotech & Pharma Firms, Food Safety Laboratories, Academic Research Labs, Chemical Analysts |
India Spectroscopy Equipment Market Year-wise Growth Rate and Key Drivers (2022–2032)
This graph illustrates the annual growth rates of the market from 2022 to 2032, highlighting a steady upward trajectory and projected market expansion over the forecast period.
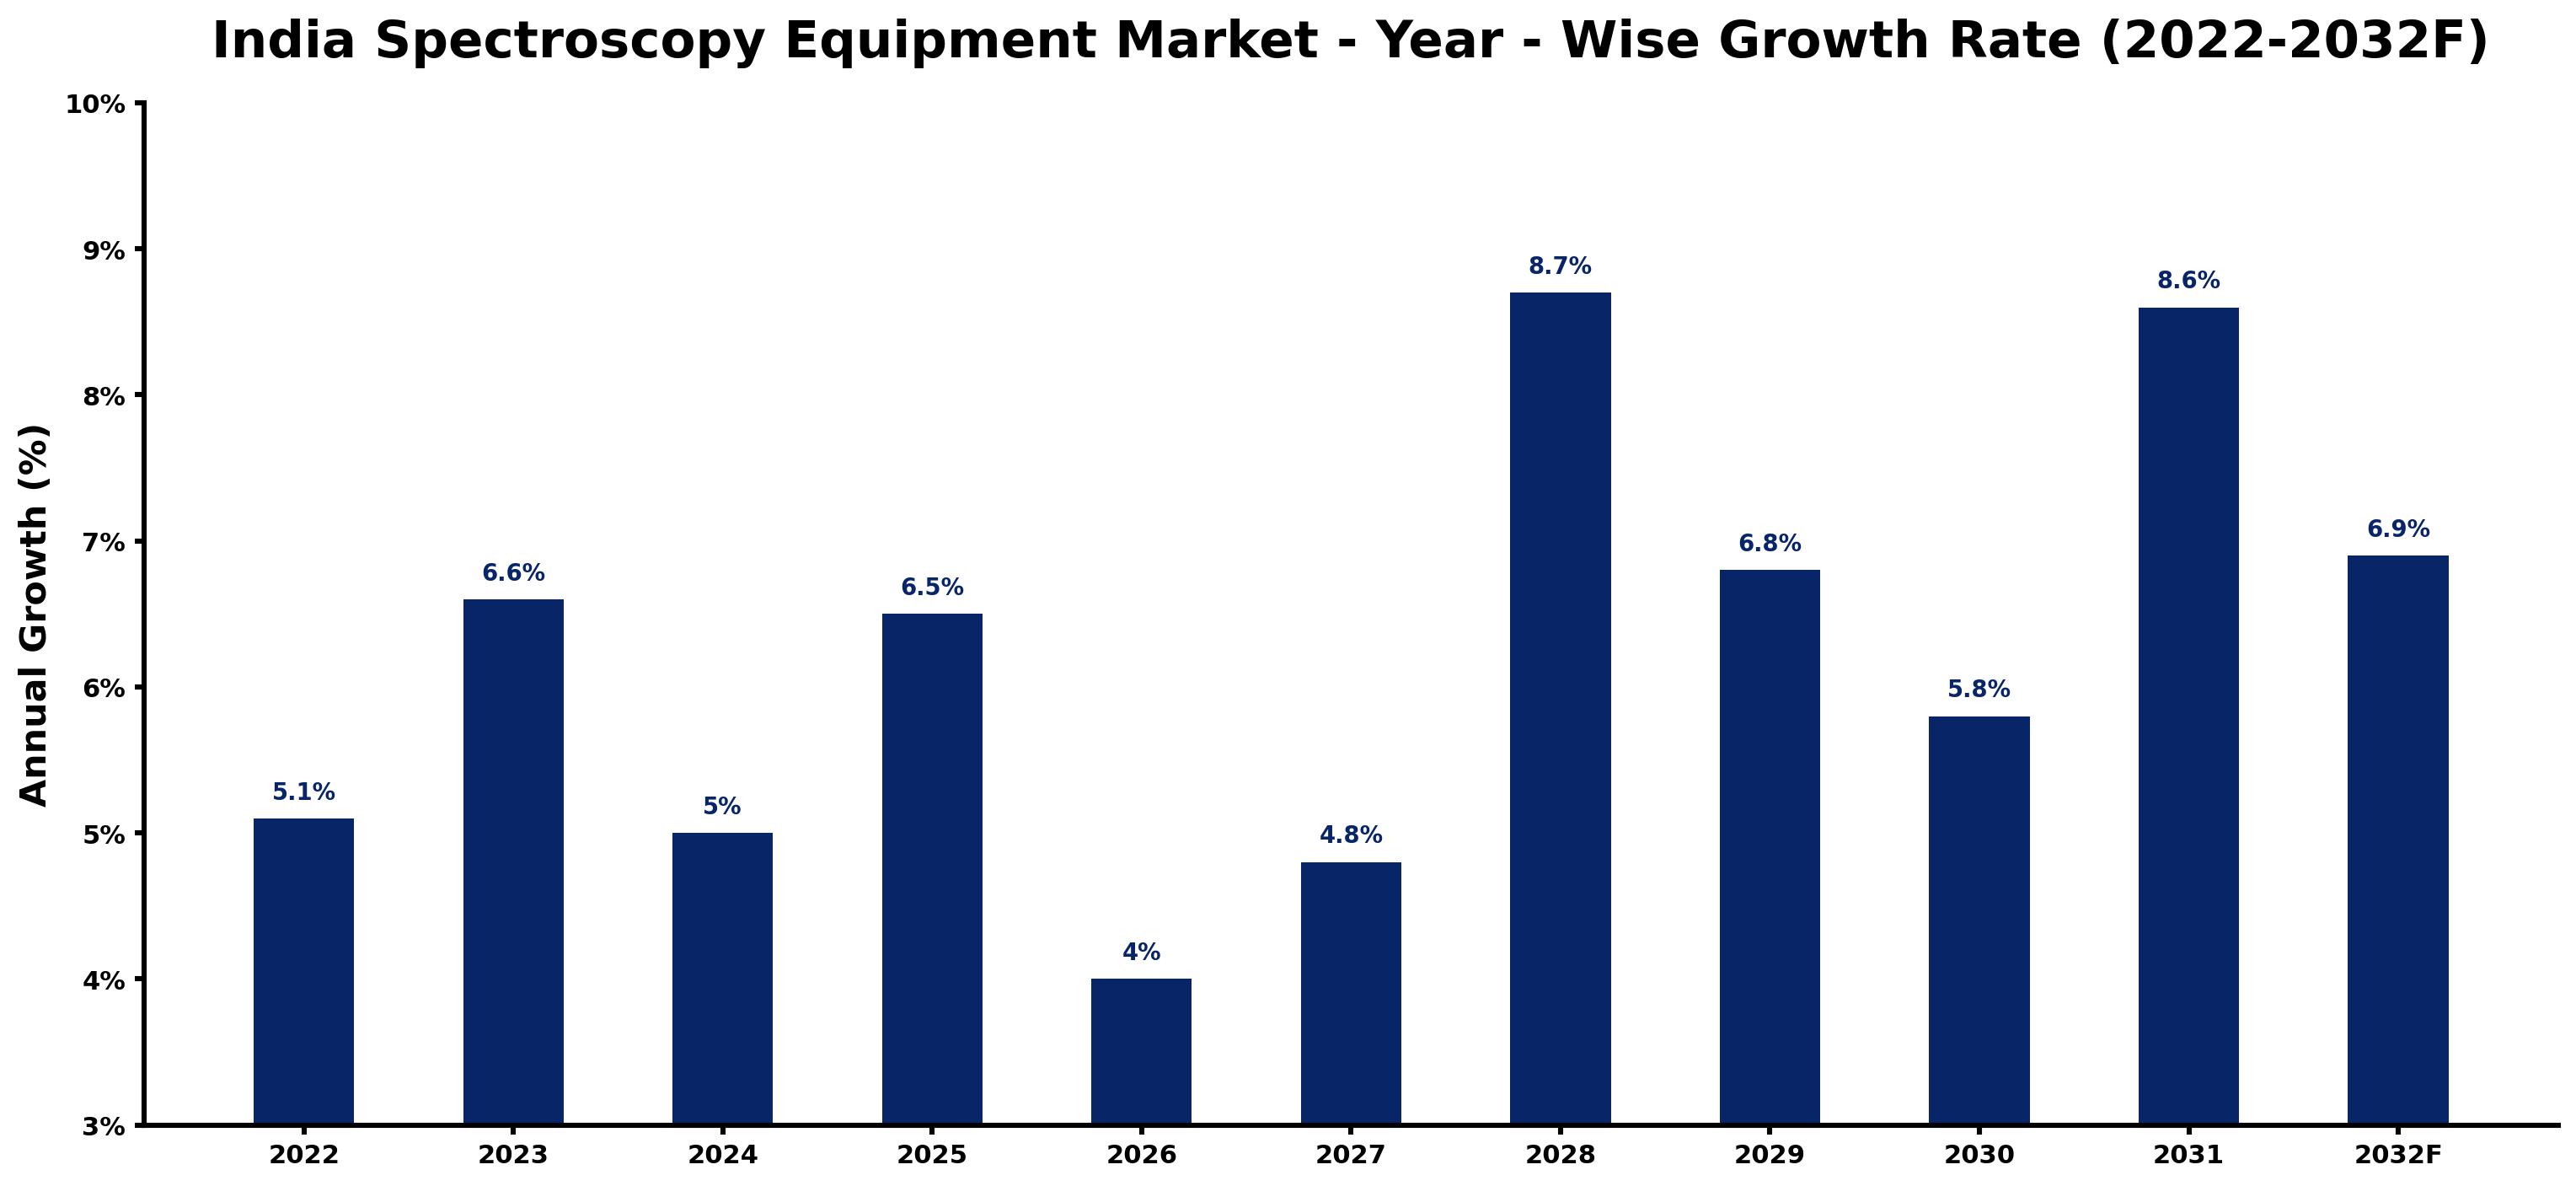
Annual growth estimates for each year appear below with the principal reason behind them, explaining the shifts that set the pace of the market.
| Year | Estimated Annual Growth (%) | Market Rationale |
| 2022 | 5.1 | The market showed steady growth, driven by ongoing investments in research and development. |
| 2023 | 6.6 | Demand accelerated due to increased adoption of spectroscopy in pharmaceutical applications. |
| 2024 | 5.0 | Growth slowed as the market adjusted to previous high demand levels. |
| 2025 | 6.5 | The market rebounded with renewed interest in advanced analytical techniques. |
| 2026 | 4.0 | A slight slowdown occurred as buyers assessed new technologies and investments. |
| 2027 | 4.8 | Growth resumed as biotechnology firms expanded their research capabilities. |
| 2028 | 8.7 | The market peaked with significant investments in local manufacturing initiatives. |
| 2029 | 6.8 | Growth slowed as the market began to stabilise after rapid expansion. |
| 2030 | 5.8 | Demand continued to moderate as firms focused on operational efficiencies. |
| 2031 | 8.6 | Growth accelerated again due to rising investments in health research. |
| 2032 | 6.9 | The market stabilised with consistent demand from academic and industrial sectors. |
Note: Market size estimations and growth projections presented in this report are based on 6Wresearch's proprietary forecasting methodology, utilizing the latest available industry data, government publications, and primary research inputs.
India Spectroscopy Equipment Market Synopsis
The Spectroscopy Equipment Market in India includes a range of analytical instruments that assess the interaction between matter and electromagnetic radiation. These tools play a crucial role in chemical analysis, quality control within pharmaceuticals, and laboratory research. The market is expanding due to substantial investments from the biotech and pharmaceutical sectors, expected to reach $130 billion by 2030. Initiatives like the 'Atmanirbhar Bharat' programme are promoting local manufacturing, further increasing the demand for advanced analytical instruments. With over 1,000 academic research labs employing these technologies, the market is set for ongoing growth.
Market Dynamics Impact Analysis (2026–2032)
| Factor | Type | Impact | Primary Segment Affected |
| Growing demand from pharmaceutical firms for drug development and quality control. | Driver | High | Mass Spectrometers |
| Increased adoption of spectroscopy in food safety laboratories for compliance testing. | Driver | High | FTIR Spectrometers |
| Investment in local manufacturing of analytical instruments is rising. | Opportunity | High | Raman Spectrometers |
| Expansion of biotechnology firms requiring advanced analytical capabilities. | Opportunity | High | UV-Vis Spectrometers |
| High costs associated with advanced spectroscopy equipment limit accessibility. | Restraint | Medium | Mass Spectrometers |
| Limited awareness of advanced spectroscopy techniques among smaller labs. | Restraint | Medium | FTIR Spectrometers |
| Buyers face challenges in sourcing high-quality components for instruments. | Challenge | High | Raman Spectrometers |
| Suppliers struggle with maintaining competitive pricing amid rising production costs. | Challenge | Medium | UV-Vis Spectrometers |
Evaluation of Drivers in India Spectroscopy Equipment Market (2026–2032)
The main growth drivers and the segments they affect most are set out below.
| Drivers | Primary Segment Affected | Why It Matters (Evidence) |
| Increased investments in drug discovery processes drive demand for mass spectrometers. | Mass Spectrometers | The pharmaceutical sector, projected to reach $130 billion by 2030, fuels this demand. |
| Food safety regulations necessitate the use of FTIR spectrometers for compliance testing. | FTIR Spectrometers | Over 300 food safety laboratories across India are adopting these technologies. |
| Rising research activities in biotechnology enhance the need for Raman spectrometers. | Raman Spectrometers | Mass spectrometers are essential in over 200 biotech firms for drug discovery. |
| Increased focus on quality control in chemical analysis drives UV-Vis spectrometer usage. | UV-Vis Spectrometers | Standard in over 500 chemical analysis labs, these instruments are widely used. |
| Growing academic research programs promote the use of spectroscopy equipment. | Mass Spectrometers | India has over 1,000 academic research labs utilizing spectroscopy equipment. |
Growth across the Spectroscopy Equipment market in India is anchored in rising end-use demand from pharmaceutical and biotechnology sectors. The pharmaceutical sector's projected growth to $130 billion by 2030 is driving investments in analytical instruments. Over 200 biotech firms are increasingly relying on mass spectrometers for drug discovery, improving their research capabilities. With over 1,000 academic research labs utilising these technologies, the demand for UV-Vis spectrometers is rising as quality control measures become more stringent.
Evaluation of Restraints in India Spectroscopy Equipment Market
The key brakes on demand, and where they bite hardest, are shown below.
| Market Restraint | Primary Segment Affected | Why It Matters (Evidence) |
| High initial costs of spectroscopy equipment restrict access for smaller labs. | Mass Spectrometers | This limits the ability of smaller firms to invest in advanced analytical technologies, impacting their competitiveness. |
| Limited technical expertise in advanced spectroscopy techniques hampers adoption. | FTIR Spectrometers | Many smaller laboratories lack the necessary training to effectively utilise these instruments, delaying their operational capabilities. |
| Supply chain disruptions affect the availability of critical components for spectrometers. | Raman Spectrometers | This can lead to delays in production and increased costs for suppliers, affecting delivery schedules for buyers. |
| Rising production costs challenge suppliers to maintain competitive pricing. | UV-Vis Spectrometers | This affects the affordability of these instruments for end users, limiting their market reach. |
| Regulatory compliance requirements can complicate the purchasing process. | Mass Spectrometers | Buyers must navigate complex standards which can delay procurement, impacting project timelines. |
India Spectroscopy Equipment Market Challenges
In the India spectroscopy equipment market, rising raw material costs are increasing production expenses by up to 15% this year, which poses challenges for local manufacturers. Competition from imported instruments is exerting pricing pressures, potentially resulting in a 10% decline in market share for domestic suppliers. Regulatory hurdles arise from stringent guidelines set by the Bureau of Indian Standards, necessitating additional testing that can delay product launches by an average of six months for manufacturers. Supply chain disruptions, exacerbated by global logistics issues, may extend lead times for critical components by up to eight weeks, impacting delivery schedules for buyers in the pharmaceutical sector.
Trends in the India Spectroscopy Equipment Market
Several trends are reshaping the India Spectroscopy Equipment Market; the most important are set out below.
- Shift towards Local Manufacturing of Analytical Instruments: In 2023, the Indian government launched the 'Atmanirbhar Bharat' initiative to boost local manufacturing of analytical instruments. This initiative aims to strengthen supply chains and reduce import dependency, creating a more competitive market.
- Growing Integration of Spectroscopy in Educational Curricula: The National Programme on Technology Enhanced Learning was revised in 2021 to include spectroscopy in its educational framework. This initiative aims to equip future scientists with essential analytical skills, increasing the demand for spectroscopy equipment.
- Increased Focus on Food Safety Compliance: With India's population of 1.4 billion, food safety testing is critical. Over 300 food safety laboratories are now utilising FTIR spectrometers to ensure compliance with safety standards, reflecting a growing trend towards rigorous food safety measures.
- Rising Demand for Advanced Analytical Techniques in Biotech: The biotechnology sector is rapidly expanding, with over 200 firms relying on mass spectrometers for drug discovery. This trend highlights the increasing need for sophisticated analytical tools in the industry.
Investment Opportunities in the India Spectroscopy Equipment Market
Investors looking at the India Spectroscopy Equipment Market should consider the following areas.
- Biotech & Pharma Firms Seeking Advanced Instruments: With the pharmaceutical sector projected to reach $130 billion by 2030, there is an opportunity to supply advanced spectroscopy equipment to biotech and pharma firms, improving their research capabilities and productivity.
- Food Safety Laboratories Investing in Compliance Technologies: As food safety becomes a priority, over 300 food safety laboratories are investing in FTIR spectrometers. Suppliers can enter this market by partnering with local labs to provide necessary equipment and support compliance efforts.
- Growing Academic Research Labs Needing Equipment: India's academic research landscape, with over 1,000 labs, presents a prime opportunity for suppliers of spectroscopy equipment. Collaborating with educational institutions can facilitate market entry and promote innovation.
- Rising Demand for UV-Vis Spectrometers in Chemical Analysis: The increasing focus on quality control in chemical analysis labs, with over 500 using UV-Vis spectrometers, creates an opportunity for suppliers to meet this demand through local partnerships and tailored solutions.
Government Initiatives in the India Spectroscopy Equipment Market
In 2020, the Ministry of Science and Technology initiated the 'Make in India' program to promote local manufacturing of scientific instruments, including spectroscopy equipment. This policy aims to reduce import dependency and enhance domestic production capabilities. Additionally, the Bureau of Indian Standards updated the 'IS 14700' standard in 2023 for the calibration of spectroscopic instruments, ensuring quality and reliability in laboratory practices. This standard helps producers maintain compliance with industry requirements.
In 2021, the Department of Biotechnology launched the 'Biotechnology Industry Research Assistance Council' to support innovation in biotechnology, including applications of spectroscopy. This initiative provides funding for research projects and promotes collaboration between academia and industry, facilitating the development and application of spectroscopy technologies. The initiative has allocated ₹500 million for various research projects, enabling producers to enhance their capabilities.
Future Insight of the India Spectroscopy Equipment Market
The India spectroscopy equipment market will see substantial changes by 2032, driven by key factors such as the projected $130 billion growth of the pharmaceutical sector, which will increase demand for analytical instruments. Initiatives like 'Atmanirbhar Bharat' will strengthen local manufacturing capabilities, while government funding for advanced spectroscopy research projects will promote innovation. As a result, buyers will benefit from improved access to cutting-edge technology, and suppliers will navigate a more competitive landscape.
Market Segmentation Analysis
The analysis below covers each segmentation, its leading category in 2025 and its fastest-growing category through 2032.
By Equipment Type – Mass Spectrometers Dominated, Raman Spectrometers Expected to Grow Fastest
According to Summon Dutta, Assistant Manager at 6Wresearch, Mass Spectrometers held a 44% share of the India Spectroscopy Equipment Market by equipment type in 2025. Mass spectrometers lead the market share due to their critical role in detailed molecular analysis, particularly in the pharmaceutical sector. Their extensive use in over 200 biotech firms solidifies their position as essential tools for drug discovery and development. Raman Spectrometers are projected to grow fastest, at a CAGR of 7.5% during 2026–2032. Raman spectrometers are experiencing rapid growth as they are increasingly adopted for material characterization in research settings. The demand for these instruments is bolstered by their integration into workflows of numerous academic research labs, indicating a strong upward trend. Suppliers should prioritise the availability of Raman spectrometers to effectively address the growing research application needs.
By Spectral Range – Mass-to-Charge Ratio Dominated, Infrared Expected to Grow Fastest
Mass-to-Charge Ratio accounted for a 38% market share by spectral range in 2025. The mass-to-charge ratio segment commands the largest market share, being essential for mass spectrometry applications in pharmaceuticals. Its established presence in over 200 biotech firms ensures its continued dominance in the spectroscopy equipment market. Over 2026–2032, Infrared is expected to post the fastest growth, at a CAGR of 8.9%. Infrared spectroscopy is witnessing rapid growth due to its versatility in various applications, particularly for molecular identification in food safety. The increasing need for compliance with safety standards across industries is a key factor driving this growth. Buyers should consider investing in infrared spectroscopy to meet regulatory requirements and enhance their analytical capabilities.
By Detection Principle – Ion Detection Dominated, Molecular Identification Expected to Grow Fastest
The largest detection principle category in 2025 was Ion Detection, with a 35% share of total revenue. Ion detection is the leading principle in the market, primarily due to its importance in mass spectrometry for analysing ions in pharmaceutical applications. Its widespread use in over 200 biotech firms highlights its critical role in the industry, solidifying its market share. Molecular Identification is set to record the highest CAGR in this split, 7.9% over 2026–2032. Molecular identification is experiencing the fastest growth as it becomes central to various spectroscopy methods, especially in food safety and pharmaceutical research. This trend reflects an increasing emphasis on accurate molecular analysis across multiple sectors. Suppliers must adapt their offerings to include advanced molecular identification techniques to meet the growing demands of various industries.
By End User – Biotech & Pharma Firms Dominated, Food Safety Laboratories Expected to Grow Fastest
In 2025, Biotech & Pharma Firms led the end user split with a 46% share. Biotech and pharma firms hold the largest market share as major users of spectroscopy equipment for drug development and testing. This segment's strong demand is further driven by the projected growth of the pharmaceutical sector to $130 billion by 2030. The quickest growth will come from Food Safety Laboratories, forecast to expand at a CAGR of 8.8% between 2026 and 2032. Food safety laboratories are the fastest-growing end user, driven by the rising need for compliance with food safety standards in a large population. This growth is further supported by initiatives promoting the use of spectroscopy in health research. Suppliers should focus on developing tailored solutions for food safety laboratories to capitalise on this rapid growth in demand.
Key Attractiveness of the Report
- 10 Years of Market Numbers
- Historical Data Starting from 2022 to 2025
- Base Year 2025
- Forecast Data until 2032
- Key Performance Indicators Impacting the Market
- Major Upcoming Developments and Projects
Key Highlights of the Report:
- India Spectroscopy Equipment Market Outlook
- Market Size of India Spectroscopy Equipment Market, 2025
- Forecast of India Spectroscopy Equipment Market, 2032
- Historical Data and Forecast of India Spectroscopy Equipment Revenues & Volume for the Period 2022 - 2032F
- India Spectroscopy Equipment Market Trend Evolution
- India Spectroscopy Equipment Market Drivers and Challenges
- India Spectroscopy Equipment Price Trends
- India Spectroscopy Equipment Porter's Five Forces
- India Spectroscopy Equipment Industry Life Cycle
- Historical Data and Forecast of India Spectroscopy Equipment Market Revenues & Volume By Equipment Type for the Period 2022 - 2032F
- Historical Data and Forecast of India Spectroscopy Equipment Market Revenues & Volume By Mass Spectrometers for the Period 2022 - 2032F
- Historical Data and Forecast of India Spectroscopy Equipment Market Revenues & Volume By FTIR Spectrometers for the Period 2022 - 2032F
- Historical Data and Forecast of India Spectroscopy Equipment Market Revenues & Volume By Raman Spectrometers for the Period 2022 - 2032F
- Historical Data and Forecast of India Spectroscopy Equipment Market Revenues & Volume By UV-Vis Spectrometers for the Period 2022 - 2032F
- Historical Data and Forecast of India Spectroscopy Equipment Market Revenues & Volume By Spectral Range for the Period 2022 - 2032F
- Historical Data and Forecast of India Spectroscopy Equipment Market Revenues & Volume By Mass-to-Charge Ratio for the Period 2022 - 2032F
- Historical Data and Forecast of India Spectroscopy Equipment Market Revenues & Volume By Infrared for the Period 2022 - 2032F
- Historical Data and Forecast of India Spectroscopy Equipment Market Revenues & Volume By Laser Scattering for the Period 2022 - 2032F
- Historical Data and Forecast of India Spectroscopy Equipment Market Revenues & Volume By Ultraviolet-Visible for the Period 2022 - 2032F
- Historical Data and Forecast of India Spectroscopy Equipment Market Revenues & Volume By Detection Principle for the Period 2022 - 2032F
- Historical Data and Forecast of India Spectroscopy Equipment Market Revenues & Volume By Ion Detection for the Period 2022 - 2032F
- Historical Data and Forecast of India Spectroscopy Equipment Market Revenues & Volume By Absorbance for the Period 2022 - 2032F
- Historical Data and Forecast of India Spectroscopy Equipment Market Revenues & Volume By Molecular Identification for the Period 2022 - 2032F
- Historical Data and Forecast of India Spectroscopy Equipment Market Revenues & Volume By Light Absorption for the Period 2022 - 2032F
- Historical Data and Forecast of India Spectroscopy Equipment Market Revenues & Volume By End User for the Period 2022 - 2032F
- Historical Data and Forecast of India Spectroscopy Equipment Market Revenues & Volume By Biotech & Pharma Firms for the Period 2022 - 2032F
- Historical Data and Forecast of India Spectroscopy Equipment Market Revenues & Volume By Chemical Analysts for the Period 2022 - 2032F
- Historical Data and Forecast of India Spectroscopy Equipment Market Revenues & Volume By Academic Research Labs for the Period 2022 - 2032F
- Historical Data and Forecast of India Spectroscopy Equipment Market Revenues & Volume By Food Safety Laboratories for the Period 2022 - 2032F
- India Spectroscopy Equipment Import Export Trade Statistics
- Market Opportunity Assessment By Equipment Type
- Market Opportunity Assessment By Spectral Range
- Market Opportunity Assessment By Detection Principle
- Market Opportunity Assessment By End User
- India Spectroscopy Equipment Top Companies Market Share
- India Spectroscopy Equipment Competitive Benchmarking By Technical and Operational Parameters
- India Spectroscopy Equipment Company Profiles
- India Spectroscopy Equipment Key Strategic Recommendations
Market Covered
Segments analysed in this report are listed below.
By Equipment Type
- Mass Spectrometers
- FTIR Spectrometers
- Raman Spectrometers
- UV-Vis Spectrometers
By Spectral Range
- Mass-to-Charge Ratio
- Infrared
- Laser Scattering
- Ultraviolet-Visible
By Detection Principle
- Ion Detection
- Absorbance
- Molecular Identification
- Light Absorption
By End User
- Biotech & Pharma Firms
- Chemical Analysts
- Academic Research Labs
- Food Safety Laboratories































