China Spectroscopy Equipment Market Size & Growth Rate
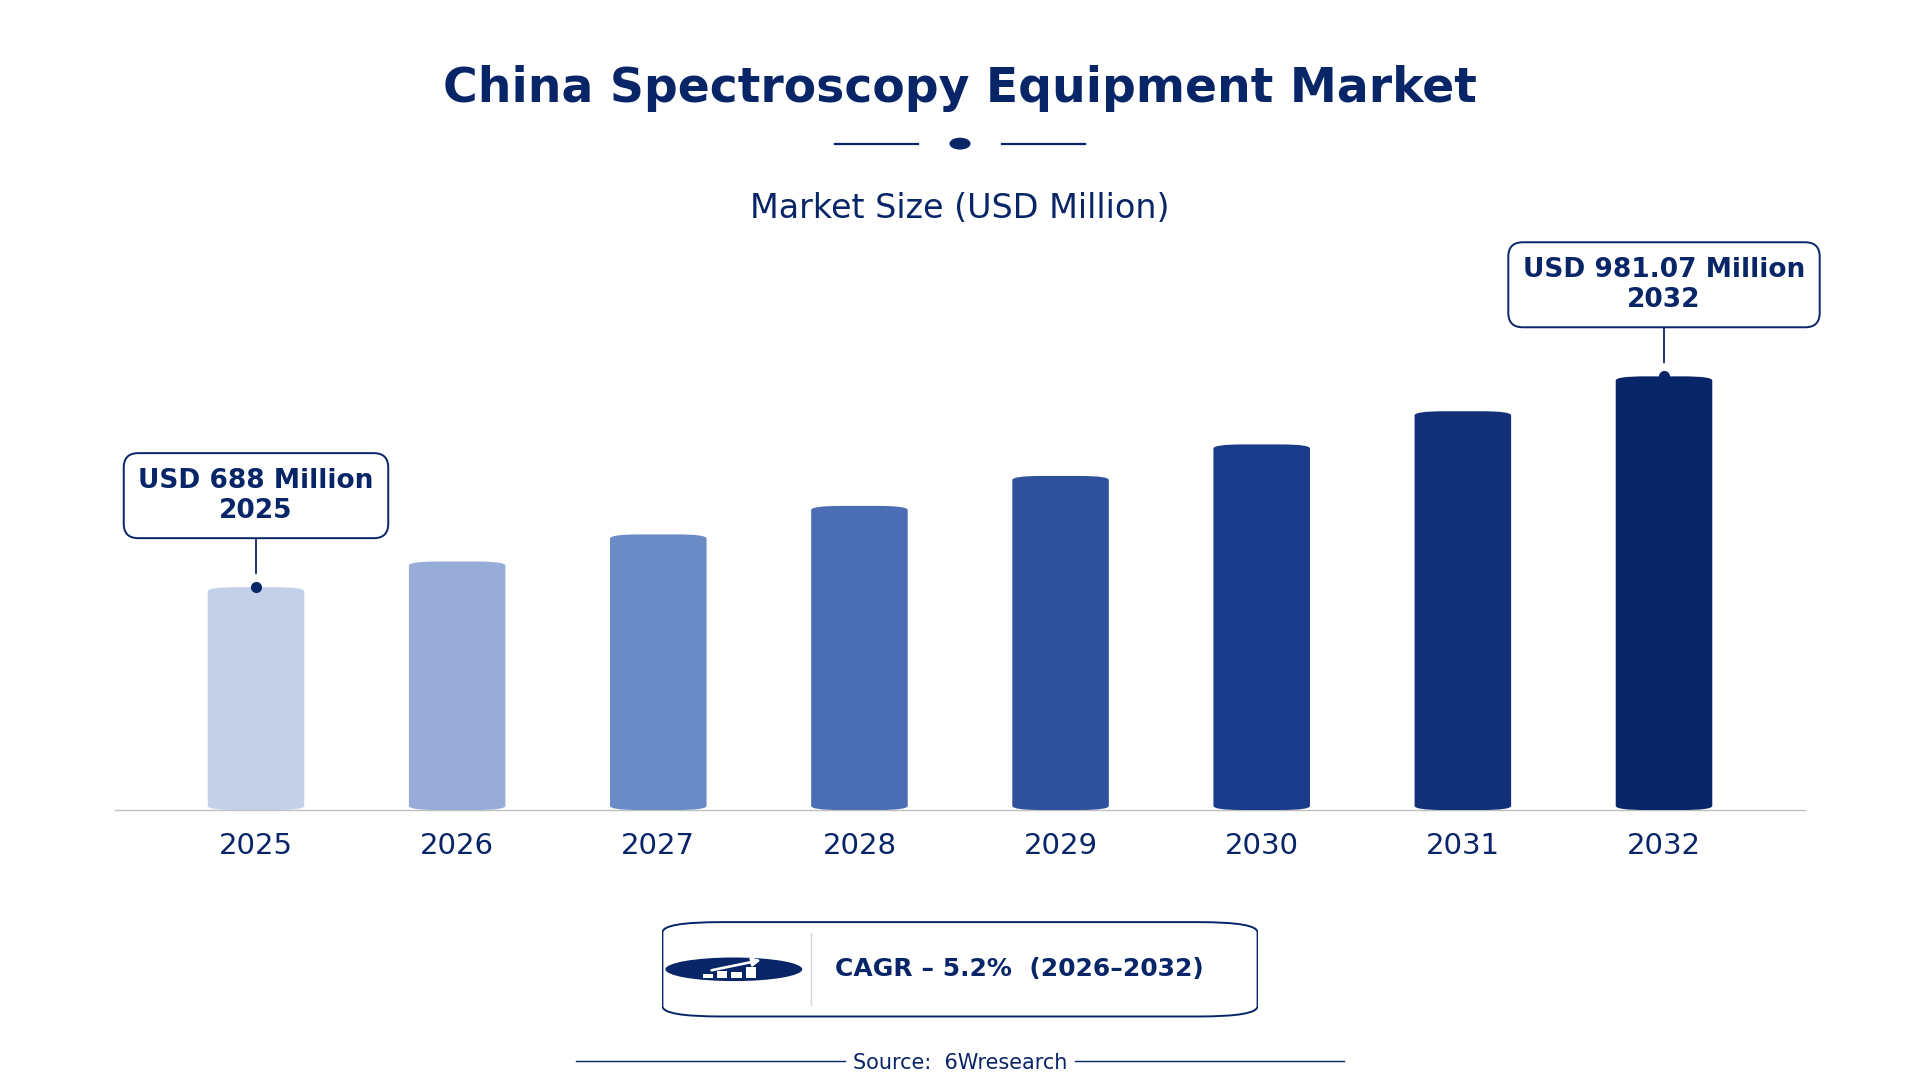
According to 6Wresearch internal database and industry insights, the China Spectroscopy Equipment Market was valued at USD 688.0 million in 2025 and is projected to reach USD 981.07 million by 2032, growing at a CAGR of approximately 5.2% during 2026–2032.
China Spectroscopy Equipment Market Highlights
| Report Metric | Details |
| Report Name | China Spectroscopy Equipment Market |
| Market Size 2025 | USD 688.0 million |
| Market Size 2032 | USD 981.07 million |
| Absolute Growth 2025–2032 | USD 293.07 million |
| CAGR 2026–2032 | 5.2% |
| Peak Annual Growth | 7.8% in 2030 |
| Forecast Period | 2026–2032 |
| Historical Data | 2022–2025 |
| Base Year | 2025 |
| Leading Equipment Type, 2025 | Mass Spectrometers (42% share) |
| Leading Spectral Range, 2025 | Mass-to-Charge Ratio (41% share) |
| Leading Detection Principle, 2025 | Ion Detection (51% share) |
| Leading End User, 2025 | Biotech & Pharma Firms (34% share) |
| Fastest-Growing Equipment Type | Raman Spectrometers (6.6% CAGR) |
| Fastest-Growing Spectral Range | Infrared (7.3% CAGR) |
| Fastest-Growing Detection Principle | Molecular Identification (7.1% CAGR) |
| Growing Sector | Biotechnology and Pharmaceuticals |
| Key End Users | Biotech & Pharma Firms, Food Safety Laboratories, Academic Research Labs |
China Spectroscopy Equipment Market Year-wise Growth Rate and Key Drivers (2022–2032)
This graph illustrates the annual growth rates of the market from 2022 to 2032, highlighting a steady upward trajectory and projected market expansion over the forecast period.
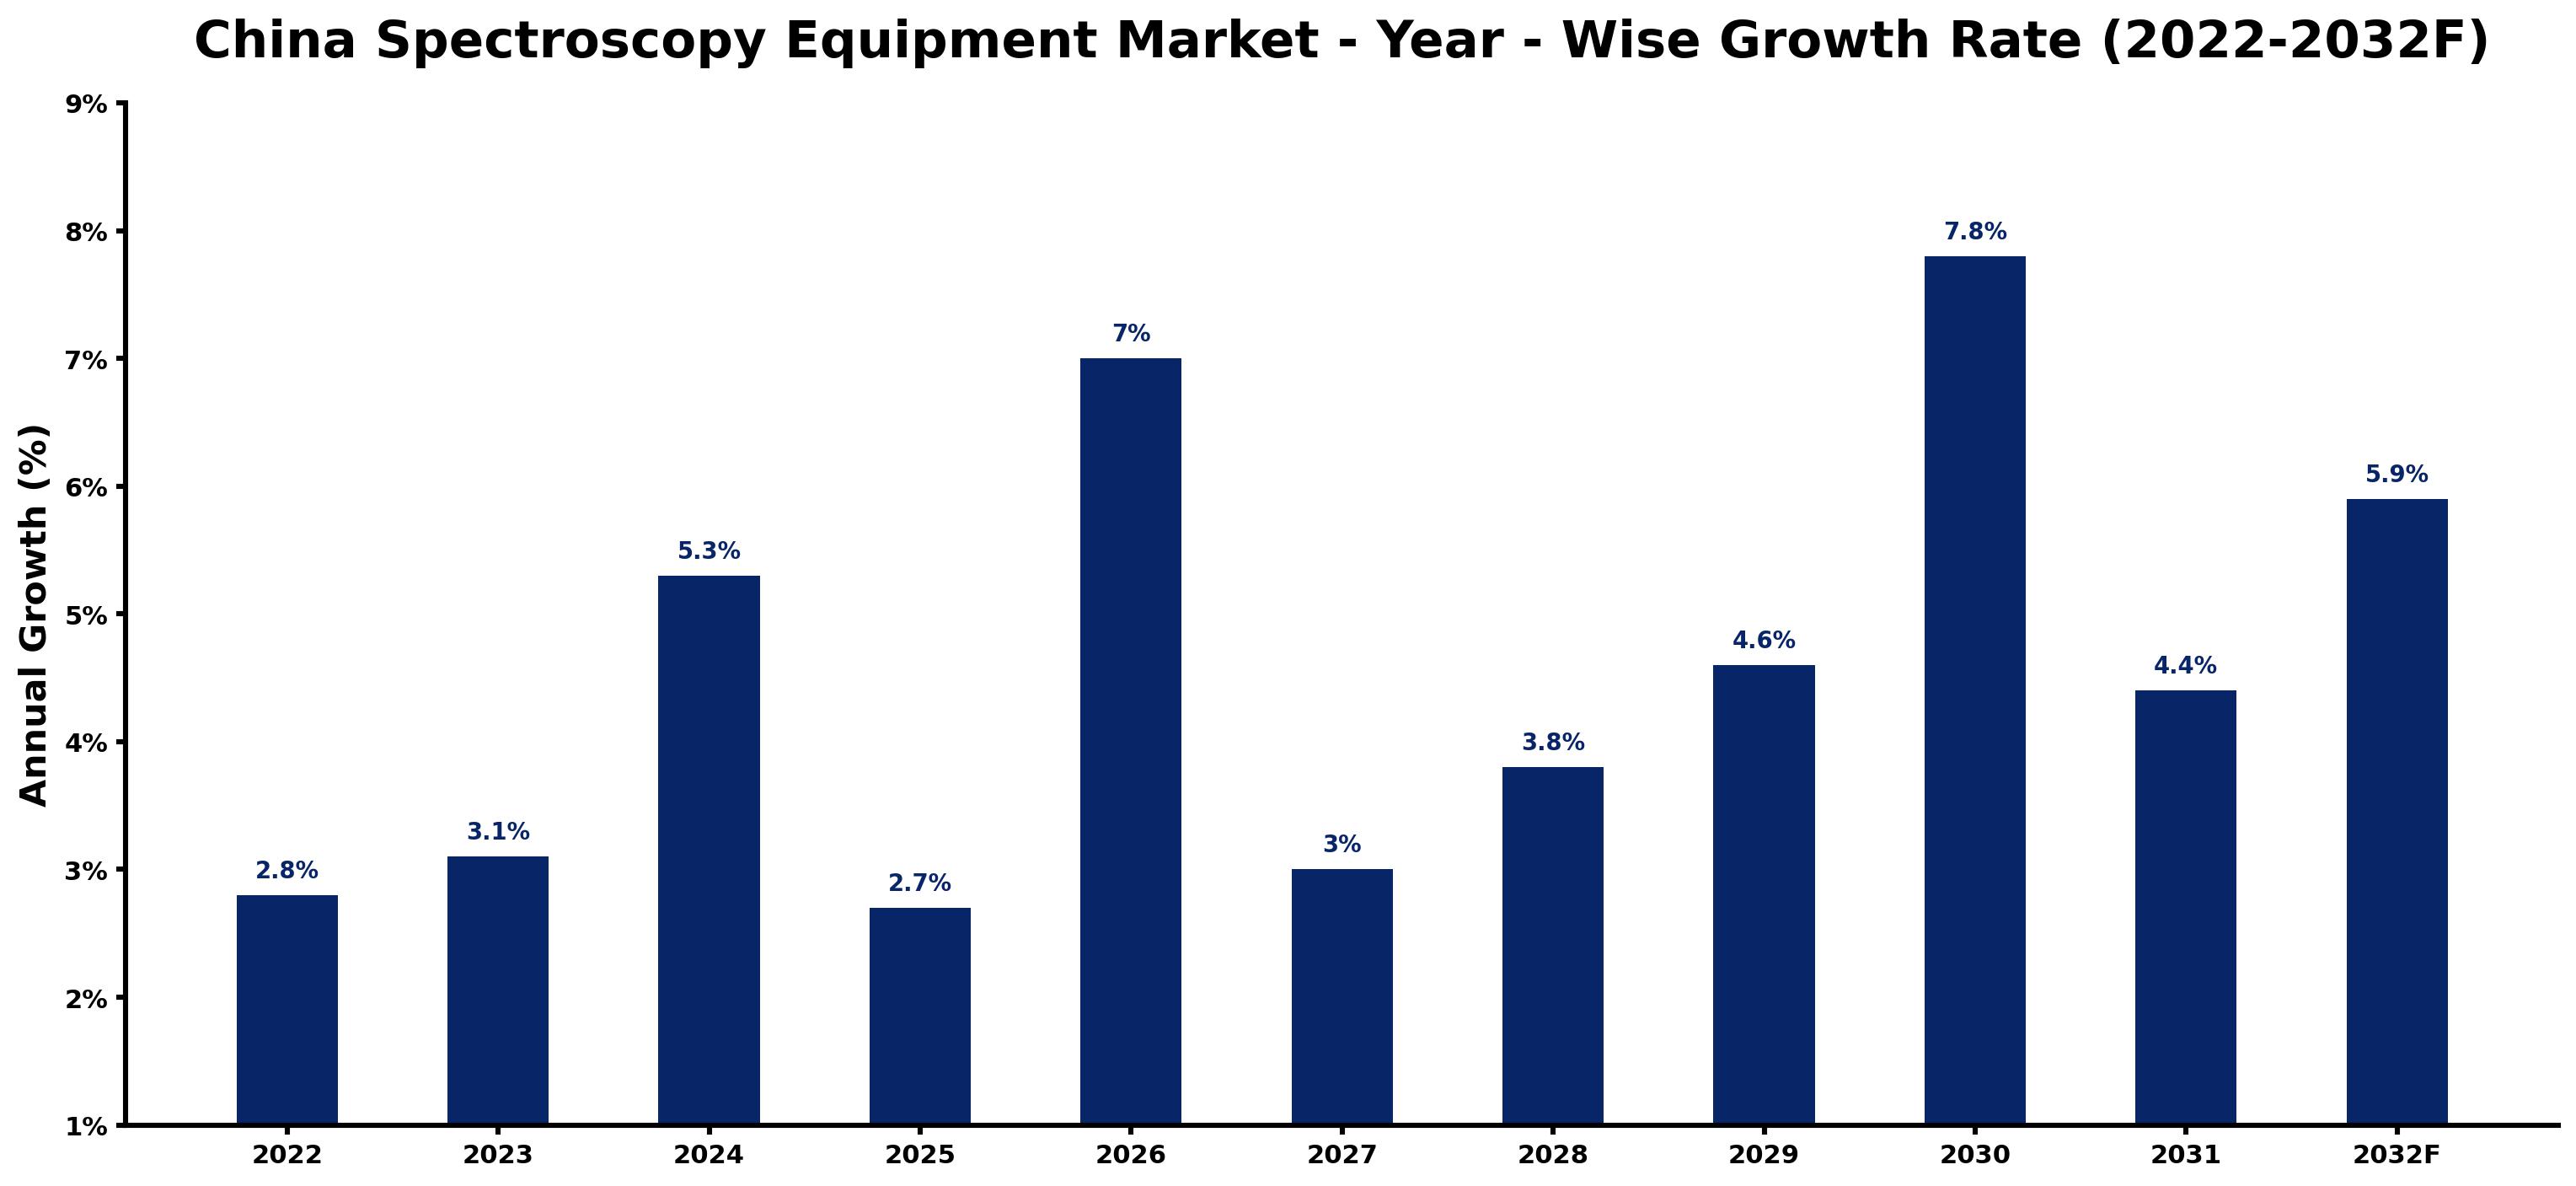
Annual growth estimates for each year appear below with the principal reason behind them, explaining the shifts that set the pace of the market.
| Year | Estimated Annual Growth (%) | Market Rationale |
| 2022 | 2.8 | The market experienced steady growth due to increased laboratory activities across sectors, particularly in pharmaceuticals. |
| 2023 | 3.1 | Demand rose as more academic research labs adopted advanced spectroscopy techniques, boosting equipment purchases. |
| 2024 | 5.3 | Growth accelerated with heightened investments in pharmaceutical research and development, leading to increased demand for mass spectrometers. |
| 2025 | 2.7 | The growth rate slowed as adjustments in the equipment supply chain affected purchasing decisions. |
| 2026 | 7.0 | A resurgence in demand emerged from biotechnology firms focusing on drug development, driving mass spectrometer sales. |
| 2027 | 3.0 | Growth decelerated as market saturation began to affect purchasing decisions, particularly in mass spectrometry. |
| 2028 | 3.8 | Demand improved as environmental monitoring projects expanded their use of spectroscopy, particularly Raman spectrometers. |
| 2029 | 4.6 | Increased quality control measures in food safety laboratories drove demand higher for FTIR spectrometers, essential for compliance. |
| 2030 | 7.8 | The market peaked as substantial investments in research facilities boosted equipment purchases across sectors. |
| 2031 | 4.4 | Growth moderated as the market adjusted to new standards and practices, impacting purchasing strategies. |
| 2032 | 5.9 | Demand increased due to ongoing modernization efforts in academic laboratories, improving their research capabilities. |
Note: Market size estimations and growth projections presented in this report are based on 6Wresearch's proprietary forecasting methodology, utilizing the latest available industry data, government publications, and primary research inputs.
China Spectroscopy Equipment Market Synopsis
The China Spectroscopy Equipment Market encompasses analytical instruments that measure interactions between matter and electromagnetic radiation. These instruments are essential for chemical analysis, quality control, and research in laboratories. Valued at approximately 10 billion yuan as of 2023, the market is driven by demand from biotech and pharmaceutical firms, food safety laboratories, and academic research institutions. The National Laboratory Development Program promotes modernization efforts, further stimulating market growth as research capabilities expand.
Market Dynamics Impact Analysis (2026–2032)
| Factor | Type | Impact | Primary Segment Affected |
| Rising investments in pharmaceutical research and development drive demand for advanced analytical tools. | Driver | High | Mass Spectrometers |
| Growing emphasis on food safety regulations increases the need for quality control testing equipment. | Driver | High | FTIR Spectrometers |
| The current investment of 2 billion yuan in research facilities creates opportunities for suppliers of spectroscopy equipment. | Opportunity | High | Raman Spectrometers |
| The increasing number of academic research labs presents a significant market entry opportunity for new suppliers. | Opportunity | High | UV-Vis Spectrometers |
| High costs associated with advanced spectroscopy equipment may limit access for smaller laboratories. | Restraint | Medium | Mass Spectrometers |
| The complexity of compliance with national standards can hinder market entry for new manufacturers. | Restraint | Medium | FTIR Spectrometers |
| The Spectroscopy Equipment Market in China faces challenges from rapid technological advancements. | Challenge | High | Raman Spectrometers |
| Supply chain disruptions can delay equipment delivery, affecting laboratory operations. | Challenge | Medium | UV-Vis Spectrometers |
Evaluation of Drivers in China Spectroscopy Equipment Market (2026–2032)
The factors lifting demand, and the evidence behind each, are summarised below.
| Drivers | Primary Segment Affected | Why It Matters (Evidence) |
| Increased laboratory activities in pharmaceuticals drive demand for Mass Spectrometers. | Mass Spectrometers | Mass spectrometers are widely used in over 500 pharmaceutical firms across China, boosting purchases. |
| Quality control testing in food safety laboratories fuels demand for FTIR Spectrometers. | FTIR Spectrometers | FTIR spectrometers are essential in over 200 food safety laboratories for quality control testing. |
| Environmental monitoring projects increase the adoption of Raman Spectrometers. | Raman Spectrometers | Raman spectrometers are increasingly adopted in environmental monitoring projects across several provinces. |
| The growing number of academic research papers drives demand for UV-Vis Spectrometers. | UV-Vis Spectrometers | Academic institutions in China produce over 300 research papers annually utilizing spectroscopy techniques. |
| Investment in research facilities supports the market for spectroscopy equipment. | Mass Spectrometers | The Chinese government has invested 2 billion yuan in research facilities focusing on spectroscopy technologies since 2020. |
Growth in the Spectroscopy Equipment market in China comes from rising end-use demand in pharmaceuticals, food safety, and academic research. Laboratory activities in pharmaceutical firms are driving demand for mass spectrometers, with over 500 firms utilizing these instruments. Quality control testing in food safety laboratories fuels the need for FTIR spectrometers, essential for maintaining safety standards. Environmental monitoring projects are boosting the adoption of Raman spectrometers across several provinces. Additionally, the investment of 2 billion yuan in research facilities supports the development of advanced spectroscopy technologies.
Evaluation of Restraints in China Spectroscopy Equipment Market
The following restraints limit how fast demand can grow.
| Market Restraint | Primary Segment Affected | Why It Matters (Evidence) |
| High costs of advanced spectroscopy equipment limit access for smaller laboratories. | Mass Spectrometers | The average price of mass spectrometers can exceed several hundred thousand yuan, restricting purchases. |
| Complex compliance with national standards can hinder market entry for new manufacturers. | FTIR Spectrometers | Manufacturers must adhere to the National Standard GB/T 20239-2006, which can be resource-intensive. |
| Supply chain disruptions can delay equipment delivery, affecting laboratory operations. | Raman Spectrometers | Recent global supply chain issues have led to longer lead times for spectroscopy equipment, impacting lab productivity. |
| Technological advancements can outpace existing equipment capabilities, requiring frequent upgrades. | UV-Vis Spectrometers | Laboratories may face challenges in keeping up with the latest technological developments, necessitating costly upgrades. |
| Market saturation in certain segments can limit growth potential for new entrants. | Mass Spectrometers | With over 1,000 academic research labs, competition for market share is intensifying, making it difficult for newcomers. |
China Spectroscopy Equipment Market Challenges
The China spectroscopy equipment market encounters several practical issues, beginning with strict regulations. The National Standard GB/T 20239-2006 necessitates complex testing methods that can postpone product approvals for suppliers, leading to increased costs and potential revenue loss. Additionally, technology limitations hinder the adoption of advanced spectroscopy techniques in smaller laboratories, which may miss out on efficiency improvements and precise results. Buyers in pharmaceutical firms face intense competition, as over 500 companies vie for the same equipment, driving prices higher and squeezing profit margins. Lastly, the rapid pace of innovation compels manufacturers to continuously update their offerings, straining resources and risking product obsolescence.
Trends in the China Spectroscopy Equipment Market
The trends below show where the China Spectroscopy Equipment Market is heading.
- Shift towards Advanced Analytical Techniques: China is increasingly adopting advanced analytical techniques in laboratories, particularly in pharmaceuticals. The National Laboratory Development Program aims to modernize equipment, with 1 billion yuan allocated to enhancing research capabilities. This trend drives demand for spectroscopy technologies.
- Growing Focus on Environmental Monitoring: Environmental monitoring is becoming a priority in several provinces, leading to increased adoption of spectroscopy. Raman spectrometers are being utilized in various environmental projects to ensure compliance with regulations. This shift is projected to boost market growth, with investments in monitoring technologies rising.
- Increased Standardization in Spectroscopy Practices: The introduction of the New Standards for Spectroscopy Equipment in 2022 has led to greater consistency in manufacturing practices. This standard, approved by the State Administration for Market Regulation, improves quality and safety measures for manufacturers, impacting overall market dynamics positively.
- Expansion of Academic Research Labs: The number of academic research labs in China is on the rise, resulting in higher demand for spectroscopy equipment. With over 1,000 labs currently operational, the focus on research and development is driving significant purchases of advanced analytical tools.
Investment Opportunities in the China Spectroscopy Equipment Market
The following opportunities in the China Spectroscopy Equipment Market pair current demand with a clear way in.
- Current Investment in Research Facilities: The Chinese government's investment of 2 billion yuan in research facilities presents a timely opportunity for suppliers of spectroscopy equipment. Biotech and pharmaceutical firms are key buyers, and local partnerships can facilitate market entry, strengthening supplier presence.
- Entry through Collaboration with Academic Institutions: Partnering with academic institutions offers a promising entry route for new suppliers. With over 1,000 research labs, establishing joint ventures can lead to significant equipment sales and enhanced market presence, driving growth for suppliers.
- Supply of Advanced Spectroscopy Technologies: The rising emphasis on quality control in food safety laboratories creates an opportunity to supply advanced spectroscopy technologies. With over 200 food safety laboratories nationwide, suppliers can effectively target this growing segment, meeting increasing demand for compliance.
- Expansion in Shanghai's Manufacturing Hub: Shanghai stands as a leading hub for spectroscopy equipment manufacturing, offering opportunities for local suppliers. Investing in production facilities or partnerships in this region can enhance market access and growth, tapping into local demand.
Government Initiatives in the China Spectroscopy Equipment Market
In 2023, the Ministry of Education initiated the 'Laboratory Equipment Modernization Program' to upgrade research facilities in universities, including spectroscopy equipment. This program builds on the 'National Key Research and Development Program' launched in 2021, which supports advanced spectroscopy technologies with a budget of 1 billion yuan. These measures collectively improve laboratory capabilities and promote the adoption of modern analytical techniques, ensuring compliance with current standards.
The Ministry of Science and Technology oversees the implementation of the 'National Laboratory Development Program,' which funds upgrades to laboratory equipment across various institutions. This program enables academic research labs to modernise their spectroscopy equipment, ensuring compliance with current standards and improving research outcomes. Additionally, the State Administration for Market Regulation enforces the 'New Standards for Spectroscopy Equipment,' ensuring that manufacturers meet quality and safety requirements, improving product reliability.
Future Insight of the China Spectroscopy Equipment Market
Buyers and suppliers in the China spectroscopy equipment market can anticipate substantial changes by 2032, influenced by several key factors. The National Laboratory Development Program will enhance research capabilities and stimulate innovation in spectroscopy applications. Investment in research facilities, amounting to 2 billion yuan since 2020, will facilitate the development of new technologies. The growing adoption of UV-Vis spectrometers in food safety laboratories will create new opportunities across various sectors. Academic institutions are likely to produce over 300 research papers annually, underscoring the increasing importance of spectroscopy in scientific exploration.
Market Segmentation Analysis
Each segment group is reviewed below, with the leader by share and the fastest grower by CAGR.
By Equipment Type – Mass Spectrometers Dominated, Raman Spectrometers Expected to Grow Fastest
According to Summon Dutta, Assistant Manager at 6Wresearch, Mass Spectrometers accounted for a 42% market share by equipment type in 2025. Mass spectrometers dominate the China spectroscopy equipment market due to their critical role in precise molecular weight determination, extensively used in over 500 pharmaceutical firms. Their established presence in laboratories reinforces their leading market share, ensuring consistent demand and a strong installed base. Over 2026–2032, Raman Spectrometers are expected to post the fastest growth, at a CAGR of 6.6%. Raman spectrometers are experiencing rapid growth as they are increasingly adopted in environmental monitoring projects across several provinces, indicating a shift towards sustainable practices. This trend is expected to accelerate, allowing Raman spectrometers to further widen their market position. Suppliers should enhance their offerings in Raman spectrometers to capitalise on this growing demand.
By Spectral Range – Mass-to-Charge Ratio Dominated, Infrared Expected to Grow Fastest
In 2025, Mass-to-Charge Ratio led the spectral range split with a 41% share. The mass-to-charge ratio is vital for identifying ions in mass spectrometry, making it a fundamental aspect of laboratory analysis. This necessity across various applications solidifies its leading market share in the spectroscopy equipment sector. Infrared is projected to grow fastest, at a CAGR of 7.3% during 2026–2032. Infrared spectroscopy is gaining traction due to its fundamental role in molecular structure analysis, particularly in chemistry, as more industries recognise its importance. This increasing adoption will likely drive further growth in this segment, enhancing its market position. Buyers should prioritise suppliers who offer advanced infrared solutions to meet their analytical needs.
By Detection Principle – Ion Detection Dominated, Molecular Identification Expected to Grow Fastest
Ion Detection took a 51% share of detection principle in 2025, more than any other category. Ion detection is essential for detecting and quantifying ions in mass spectrometry, widely utilised in laboratories for various applications. Its critical importance in analytical processes ensures that it holds the largest market share in the detection principle segment. The quickest growth will come from Molecular Identification, forecast to expand at a CAGR of 7.1% between 2026 and 2032. Molecular identification is becoming increasingly vital for identifying chemical substances across multiple fields, leading to its rapid growth. As industries expand their analytical capabilities, the demand for this detection principle will continue to rise. Suppliers should invest in technologies that enhance molecular identification capabilities to meet the evolving demands of the market.
By End User – Biotech & Pharma Firms Dominated and Is Expected to Record the Fastest Growth
The largest end user category in 2025 was Biotech & Pharma Firms, with a 34% share of total revenue. Biotech and pharma firms are the primary users of spectroscopy equipment, leveraging it for drug development and testing, which drives their substantial market share. Their extensive reliance on these instruments ensures robust demand within the sector. Its lead should widen, with a projected CAGR of 7.7% during 2026–2032, the highest in this split. As biotech and pharma firms continue to innovate and expand, their demand for spectroscopy equipment will grow, maintaining their position as the fastest-growing segment. This trend indicates that suppliers must align their strategies to cater to this key customer base. Suppliers should focus on building strong relationships with biotech and pharma firms to secure ongoing business opportunities.
Key Attractiveness of the Report
- 10 Years of Market Numbers
- Historical Data Starting from 2022 to 2025
- Base Year 2025
- Forecast Data until 2032
- Key Performance Indicators Impacting the Market
- Major Upcoming Developments and Projects
Key Highlights of the Report:
- China Spectroscopy Equipment Market Outlook
- Market Size of China Spectroscopy Equipment Market, 2025
- Forecast of China Spectroscopy Equipment Market, 2032
- Historical Data and Forecast of China Spectroscopy Equipment Revenues & Volume for the Period 2022 - 2032F
- China Spectroscopy Equipment Market Trend Evolution
- China Spectroscopy Equipment Market Drivers and Challenges
- China Spectroscopy Equipment Price Trends
- China Spectroscopy Equipment Porter's Five Forces
- China Spectroscopy Equipment Industry Life Cycle
- Historical Data and Forecast of China Spectroscopy Equipment Market Revenues & Volume By Equipment Type for the Period 2022 - 2032F
- Historical Data and Forecast of China Spectroscopy Equipment Market Revenues & Volume By Mass Spectrometers for the Period 2022 - 2032F
- Historical Data and Forecast of China Spectroscopy Equipment Market Revenues & Volume By FTIR Spectrometers for the Period 2022 - 2032F
- Historical Data and Forecast of China Spectroscopy Equipment Market Revenues & Volume By Raman Spectrometers for the Period 2022 - 2032F
- Historical Data and Forecast of China Spectroscopy Equipment Market Revenues & Volume By UV-Vis Spectrometers for the Period 2022 - 2032F
- Historical Data and Forecast of China Spectroscopy Equipment Market Revenues & Volume By Spectral Range for the Period 2022 - 2032F
- Historical Data and Forecast of China Spectroscopy Equipment Market Revenues & Volume By Mass-to-Charge Ratio for the Period 2022 - 2032F
- Historical Data and Forecast of China Spectroscopy Equipment Market Revenues & Volume By Infrared for the Period 2022 - 2032F
- Historical Data and Forecast of China Spectroscopy Equipment Market Revenues & Volume By Laser Scattering for the Period 2022 - 2032F
- Historical Data and Forecast of China Spectroscopy Equipment Market Revenues & Volume By Ultraviolet-Visible for the Period 2022 - 2032F
- Historical Data and Forecast of China Spectroscopy Equipment Market Revenues & Volume By Detection Principle for the Period 2022 - 2032F
- Historical Data and Forecast of China Spectroscopy Equipment Market Revenues & Volume By Ion Detection for the Period 2022 - 2032F
- Historical Data and Forecast of China Spectroscopy Equipment Market Revenues & Volume By Absorbance for the Period 2022 - 2032F
- Historical Data and Forecast of China Spectroscopy Equipment Market Revenues & Volume By Molecular Identification for the Period 2022 - 2032F
- Historical Data and Forecast of China Spectroscopy Equipment Market Revenues & Volume By Light Absorption for the Period 2022 - 2032F
- Historical Data and Forecast of China Spectroscopy Equipment Market Revenues & Volume By End User for the Period 2022 - 2032F
- Historical Data and Forecast of China Spectroscopy Equipment Market Revenues & Volume By Biotech & Pharma Firms for the Period 2022 - 2032F
- Historical Data and Forecast of China Spectroscopy Equipment Market Revenues & Volume By Chemical Analysts for the Period 2022 - 2032F
- Historical Data and Forecast of China Spectroscopy Equipment Market Revenues & Volume By Academic Research Labs for the Period 2022 - 2032F
- Historical Data and Forecast of China Spectroscopy Equipment Market Revenues & Volume By Food Safety Laboratories for the Period 2022 - 2032F
- China Spectroscopy Equipment Import Export Trade Statistics
- Market Opportunity Assessment By Equipment Type
- Market Opportunity Assessment By Spectral Range
- Market Opportunity Assessment By Detection Principle
- Market Opportunity Assessment By End User
- China Spectroscopy Equipment Top Companies Market Share
- China Spectroscopy Equipment Competitive Benchmarking By Technical and Operational Parameters
- China Spectroscopy Equipment Company Profiles
- China Spectroscopy Equipment Key Strategic Recommendations
Market Covered
Segments analysed in this report are listed below.
By Equipment Type
- Mass Spectrometers
- FTIR Spectrometers
- Raman Spectrometers
- UV-Vis Spectrometers
By Spectral Range
- Mass-to-Charge Ratio
- Infrared
- Laser Scattering
- Ultraviolet-Visible
By Detection Principle
- Ion Detection
- Absorbance
- Molecular Identification
- Light Absorption
By End User
- Biotech & Pharma Firms
- Chemical Analysts
- Academic Research Labs
- Food Safety Laboratories































