India Valve Automation Market Size & Growth Rate

According to 6Wresearch internal database and industry insights, the India Valve Automation Market was valued at USD 76.0 million in 2025 and is projected to reach USD 146.23 million by 2032, growing at a CAGR of approximately 9.8% during 2026–2032.
India Valve Automation Market Highlights
| Report Metric | Details |
| Report Name | India Valve Automation Market |
| Market Size 2025 | USD 76.0 million |
| Market Size 2032 | USD 146.23 million |
| Absolute Growth 2025–2032 | USD 70.23 million |
| CAGR 2026–2032 | 9.8% |
| Peak Annual Growth | 11.7% in 2027 |
| Forecast Period | 2026–2032 |
| Historical Data | 2022–2025 |
| Base Year | 2025 |
| Leading Valve Type, 2025 | Ball Valves (46% share) |
| Leading Automation Type, 2025 | Electric Actuator (53% share) |
| Leading Control Interface, 2025 | PLC/SCADA (39% share) |
| Leading End User, 2025 | Refinery Plants (45% share) |
| Fastest-Growing Valve Type | Butterfly Valves (12.2% CAGR) |
| Fastest-Growing Control Interface | IoT-Based (12.4% CAGR) |
| Fastest-Growing End User | Water Treatment Plants (12.4% CAGR) |
| Growing Sector | Water Treatment Plants |
| Key End Users | Refinery Plants, Water Treatment Plants, Power Plants, Pipeline Operators |
India Valve Automation Market Year-wise Growth Rate and Key Drivers (2022–2032)
This graph illustrates the annual growth rates of the market from 2022 to 2032, highlighting a steady upward trajectory and projected market expansion over the forecast period.
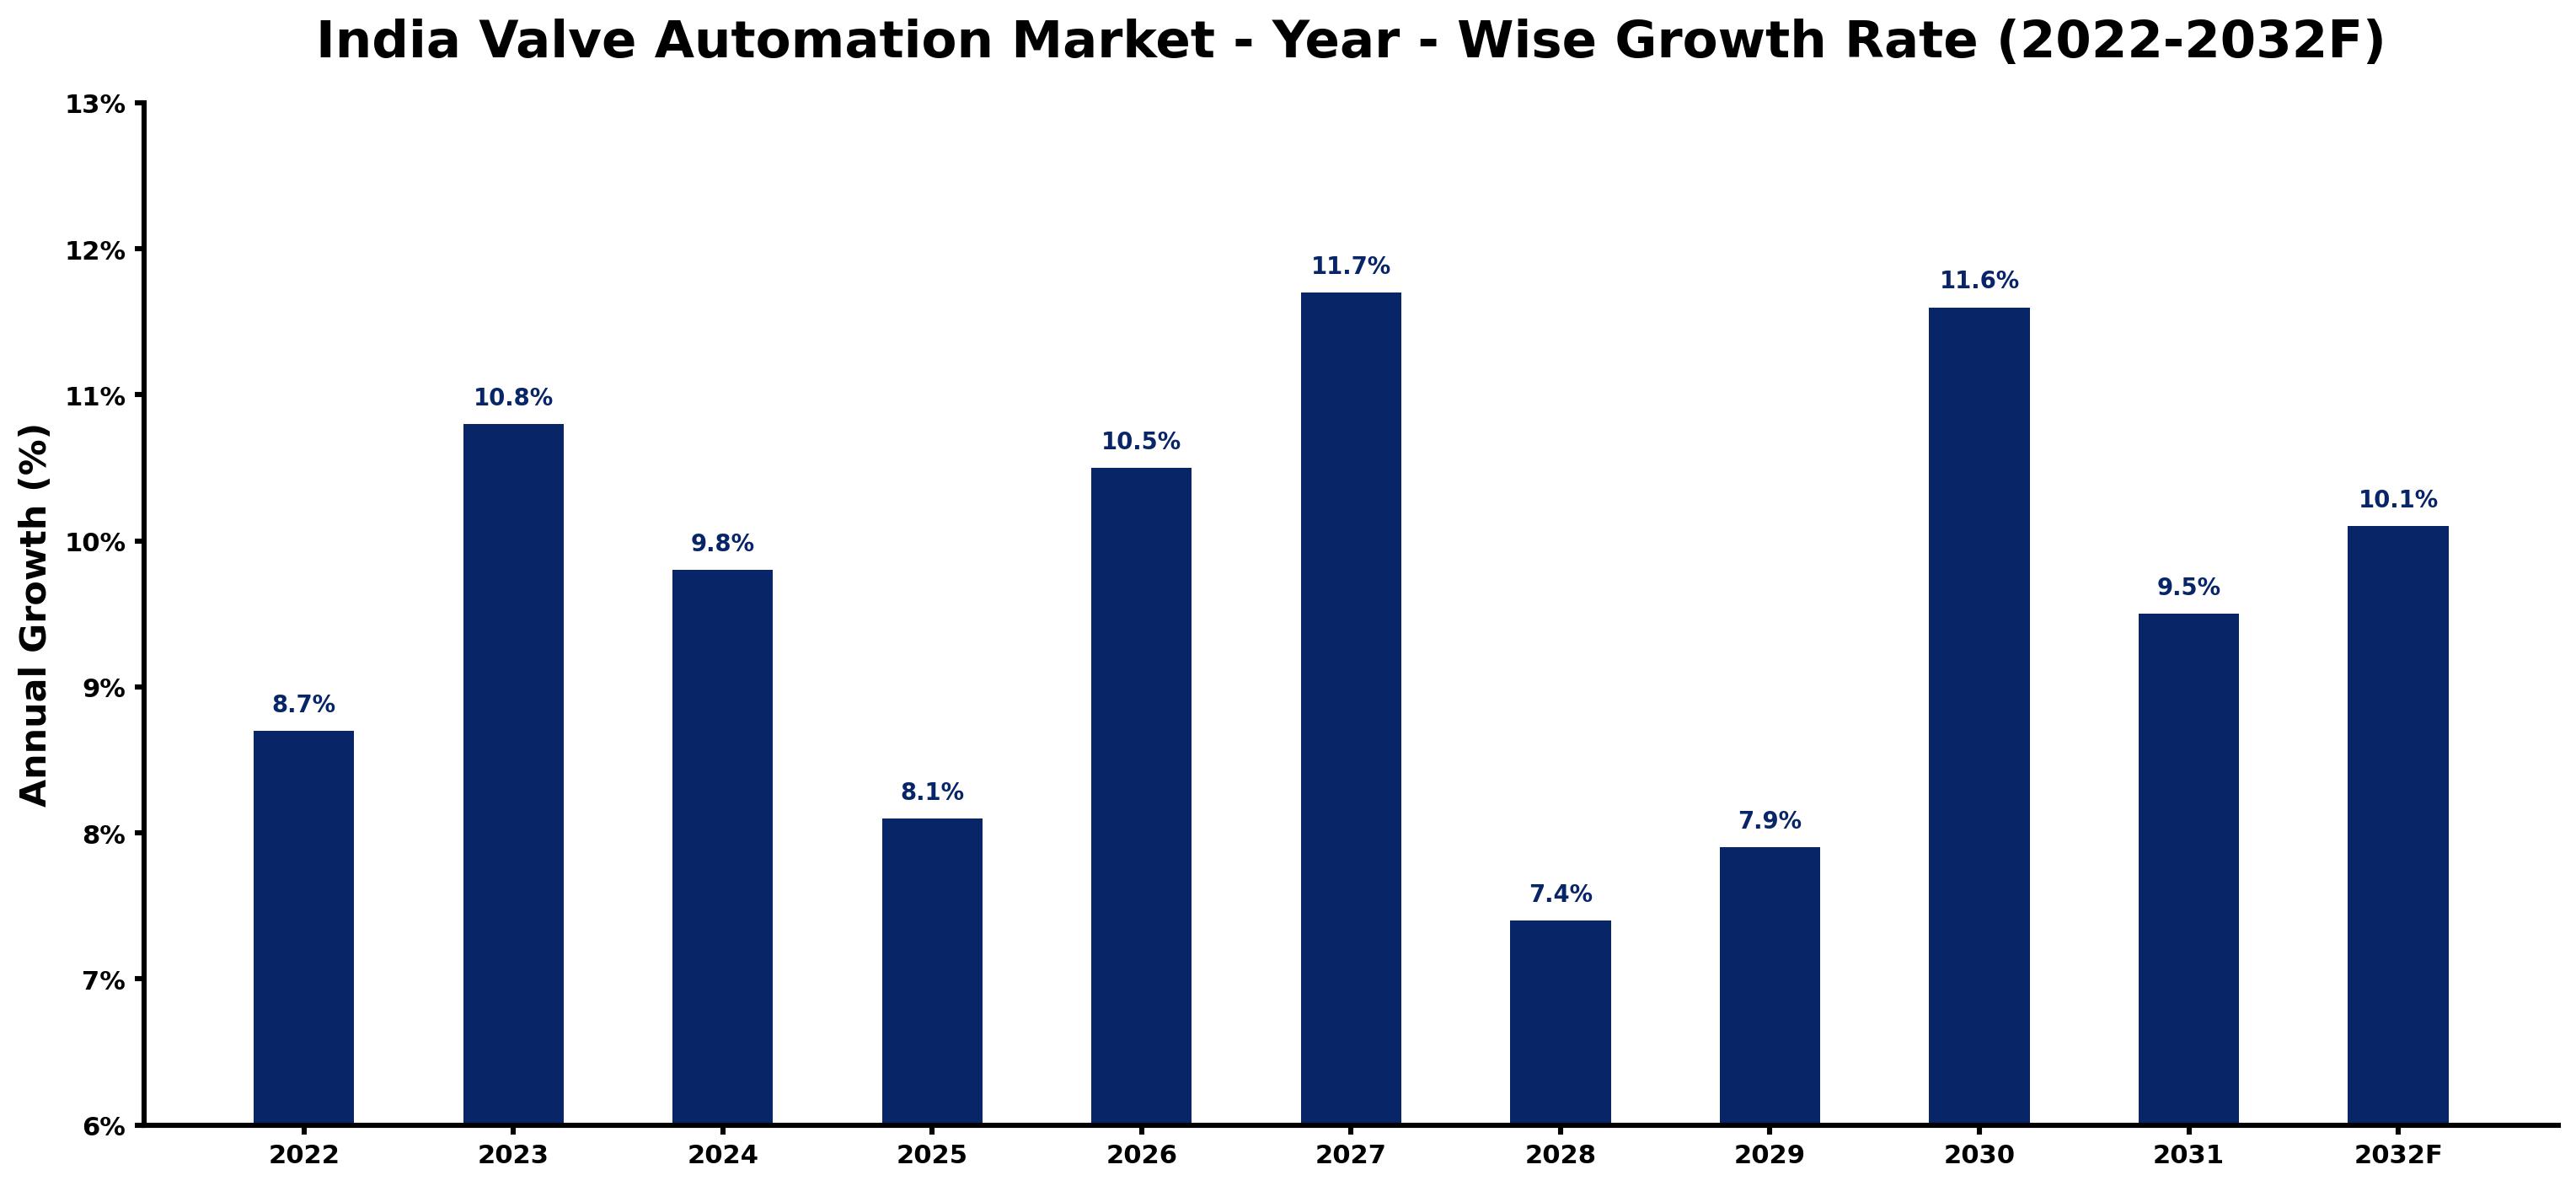
Annual growth estimates for each year appear below with the principal reason behind them, explaining the shifts that set the pace of the market.
| Year | Estimated Annual Growth (%) | Market Rationale |
| 2022 | 8.7 | The market experienced steady growth due to increased industrial activity and demand for automation technologies in oil and gas. |
| 2023 | 10.8 | Demand surged as the oil and gas sector expanded, leading to higher automation needs in refinery plants. |
| 2024 | 9.8 | Growth slowed as the market adjusted to previous high levels of investment in automation technologies. |
| 2025 | 8.1 | Continued industrialisation and urbanisation contributed to a further slowdown in growth for water treatment facilities. |
| 2026 | 10.5 | Investment in automation technologies is expected to drive faster growth in the valve automation market. |
| 2027 | 11.7 | The market is projected to peak as refinery and water treatment sectors ramp up automation efforts, supported by the National Water Policy. |
| 2028 | 7.4 | Growth is expected to slow again as the market stabilises after the peak demand period in power generation. |
| 2029 | 7.9 | Increased investment in smart technologies will lead to a rebound in growth rates for valve automation solutions. |
| 2030 | 11.6 | The market will continue to grow as power generation facilities modernise their operations with advanced automation. |
| 2031 | 9.5 | A slowdown is anticipated as the market matures, with growth rates normalising due to regulatory compliance. |
| 2032 | 10.1 | The market is expected to grow as new projects and technologies emerge in the water treatment sector. |
Note: Market size estimations and growth projections presented in this report are based on 6Wresearch's proprietary forecasting methodology, utilizing the latest available industry data, government publications, and primary research inputs.
India Valve Automation Market Synopsis
Valve Automation in India involves automated systems that control valve operations across diverse industrial applications. This technology combines actuators and control systems to improve efficiency in sectors such as oil and gas, water treatment, and power generation. The India Valve Automation Market is on an upward trajectory, driven by increasing industrialisation and substantial investments in infrastructure. The water treatment sector alone is set to see a 30% rise in automation by 2025, reflecting strong demand. Additionally, the Smart Cities Mission is promoting IoT-based automation, further expanding market opportunities.
Market Dynamics Impact Analysis (2026–2032)
| Factor | Type | Impact | Primary Segment Affected |
| Rising industrialisation in India is increasing the need for automation in various sectors. | Driver | High | Electric Actuator |
| The ongoing modernization of power plants is driving demand for advanced valve automation solutions. | Driver | High | Pneumatic |
| The water treatment sector is increasingly adopting automation technologies to enhance efficiency. | Opportunity | High | Water Treatment Plants |
| The Smart Cities Mission is creating opportunities for IoT-based automation in urban infrastructure. | Opportunity | High | IoT-Based |
| Limited availability of skilled workforce affects the implementation of automation technologies. | Restraint | Medium | Electric Actuator |
| High initial investment costs for automation systems can deter potential buyers. | Restraint | Medium | Pneumatic |
| Technological advancements require continuous investment, which can strain budgets for some buyers. | Challenge | Medium | Electric Actuator |
| The rapid pace of technological change can lead to obsolescence of existing systems. | Challenge | Medium | Pneumatic |
Evaluation of Drivers in India Valve Automation Market (2026–2032)
The factors lifting demand, and the evidence behind each, are summarised below.
| Drivers | Primary Segment Affected | Why It Matters (Evidence) |
| Increased investment in refinery upgrades is driving demand for valve automation solutions. | Electric Actuator | Refinery plants are modernising operations, leading to a projected growth of 10.8% in this segment. |
| The expansion of water treatment facilities is boosting the need for automated control systems. | Pneumatic | India's water treatment sector aims for a 30% increase in automation by 2025, requiring new technologies. |
| The push for smart city initiatives is accelerating the adoption of IoT-based valve automation. | IoT-Based | The Smart Cities Mission promotes IoT technologies, enhancing urban infrastructure efficiency by 12.4% by 2032. |
| The growth of the power generation sector is increasing the demand for automation technologies. | Electric Actuator | The Indian power generation capacity reached 400 GW in 2023, necessitating more automation solutions. |
| Regulatory standards are mandating automation in wastewater treatment facilities, driving demand. | Pneumatic | The Central Pollution Control Board requires automation in wastewater treatment processes, increasing compliance needs. |
The growth of the Valve Automation market in India is supported by rising industrialisation, substantial infrastructure investments, and a growing need for automation solutions in key sectors. The oil and gas industry, which boasts over 200 operational refineries, is a major driver of demand for automation technologies. The water treatment sector is expected to require 30% more automation by 2025, contributing to market expansion. The modernisation of power generation facilities is increasing the demand for automated systems, with the sector achieving a capacity of 400 GW in 2023.
Evaluation of Restraints in India Valve Automation Market
The main factors holding the market back are set out below.
| Market Restraint | Primary Segment Affected | Why It Matters (Evidence) |
| The limited availability of skilled workforce hampers the implementation of advanced automation technologies. | Electric Actuator | A shortage of qualified personnel can delay project timelines and increase costs by up to 15%. |
| High initial investment costs for automation systems deter potential buyers in various sectors. | Pneumatic | Many facilities struggle to allocate budgets for expensive automation upgrades, with costs reaching ₹5 crores. |
| Frequent updates and upgrades may lead to financial burdens for smaller operators. | Electric Actuator | Technological advancements require continuous investment, which can strain budgets for some buyers, increasing costs by 20%. |
| The rapid pace of technological change can lead to obsolescence of existing systems. | Pneumatic | Facilities may hesitate to invest in automation due to fears of rapid technological shifts, risking up to 30% in lost investments. |
| Regulatory compliance can be complex and costly, impacting the adoption of automation. | Electric Actuator | Navigating regulations can delay projects and increase operational costs, with compliance costs averaging ₹1 crore. |
India Valve Automation Market Challenges
The India Valve Automation Market still has to solve a few problems, starting with technology adoption; over 50% of producers rely on outdated systems, which hinders efficiency and raises operational costs. A skills shortage exists, with around 40,000 trained professionals needed, delaying project timelines for importers and distributors. Regulatory compliance presents challenges; the Bureau of Indian Standards mandates strict quality checks, which can extend lead times for buyers by up to 20%. Fluctuating buyer demand complicates inventory management, forcing producers to maintain higher stock levels, negatively impacting cash flow and operational flexibility.
Trends in the India Valve Automation Market
Buyers and suppliers in the India Valve Automation Market are adjusting to the following trends.
- Shift towards IoT-Based Automation in Urban Infrastructure: India is increasingly embracing IoT technologies for valve automation in urban environments, as exemplified by the Smart Cities Mission. This initiative aims to enhance operational efficiency, with a projected 12.4% growth in IoT-based solutions by 2032.
- Transition from Traditional to Automated Water Treatment: The National Water Mission is advocating for automation in water treatment facilities, leading to a notable shift in operational practices. By 2025, the sector is expected to experience a 30% increase in automation adoption.
- Emergence of Electric Actuators as Preferred Solutions: Electric actuators are gaining popularity as the preferred choice for valve automation due to their precision and efficiency. This segment is projected to grow at a CAGR of 10.8% from 2026 to 2032.
- Growth in Automation for Power Generation Facilities: The modernisation of power plants is propelling the adoption of automation technologies. The Indian power generation sector, with a capacity of 400 GW, is expected to see increased investments in automation.
Investment Opportunities in the India Valve Automation Market
Below are the investment opportunities with the strongest case in the India Valve Automation Market.
- Current Demand for Automation in Water Treatment: With the water treatment sector projected to require 30% more automation by 2025, there is a strong opportunity for suppliers to invest in advanced valve automation technologies. Water treatment plants are actively seeking solutions to improve efficiency.
- Growing Need for Automation in Refinery Plants: Refinery plants are modernising operations, creating a demand for advanced automation solutions. Suppliers can enter this market by partnering with local operators to provide tailored automation systems.
- Investment Opportunities in Smart City Projects: The Smart Cities Mission is driving demand for IoT-based automation technologies in urban infrastructure. Suppliers can engage with municipal bodies to deliver effective solutions that meet regulatory standards.
- Expansion of Power Generation Capacity: The increasing power generation capacity in India presents an opportunity for automation suppliers to provide advanced control systems. Collaborating with power generation facilities can facilitate market entry.
Government Initiatives in the India Valve Automation Market
The National Water Mission, established by the Ministry of Jal Shakti in 2020, aims to promote efficient water management practices across India. This initiative enhances automation in water treatment facilities, ensuring compliance with modern standards and operational efficiency. The mission encourages investments in technologies that support sustainable water management, thus driving demand for valve automation solutions in the sector. The Smart Cities Mission, initiated in 2021, further supports this by promoting IoT technologies in urban infrastructure, improving automation capabilities.
In 2023, the Indian government allocated ₹1,000 crores for water treatment projects, overseen by the Ministry of Jal Shakti. This funding supports the implementation of advanced automation technologies in water treatment facilities, ensuring improved efficiency and compliance with environmental standards. The Bureau of Indian Standards regulates valve quality, ensuring that manufacturers meet necessary safety and performance criteria. The Central Pollution Control Board also mandates automation in wastewater treatment processes, driving further demand for automation technologies.
Future Insight of the India Valve Automation Market
The India Valve Automation Market is poised for significant development by 2032, driven by several key factors. The National Water Policy aims to enhance water treatment efficiency, increasing demand for advanced automation solutions. The Smart Cities Mission will promote the integration of IoT-based valve systems, improving urban infrastructure management. The Ministry of Power's initiative for modernising energy facilities will further elevate automation needs. With the Indian government allocating ₹1,000 crores for water treatment projects, the adoption of automation technologies across various sectors will become crucial.
Market Segmentation Analysis
Each segment group is reviewed below, with the leader by share and the fastest grower by CAGR.
By Valve Type – Ball Valves Dominated, Butterfly Valves Expected to Grow Fastest
According to Bhawna Singh, Assistant Manager at 6Wresearch, in 2025, Ball Valves led the valve type split with a 46% share. Ball valves hold a substantial market share in the India valve automation market as they are extensively utilised in over 200 operational refineries, providing reliable on/off control in critical applications. Their robust design and efficiency make them indispensable in the oil and gas sector, where operational integrity is crucial. Over 2026–2032, Butterfly Valves are expected to post the fastest growth, at a CAGR of 12.2%. Butterfly valves are experiencing the fastest growth due to their increasing adoption for flow regulation in large systems, particularly within the water treatment sector, which is projected to require 30% more automation by 2025. This trend highlights a shift towards more efficient fluid management solutions in various industrial applications. This indicates that suppliers should focus on expanding their offerings of butterfly valves to align with the rising demand in the water treatment sector.
By Automation Type – Electric Actuator Dominated and Is Expected to Record the Fastest Growth
Electric Actuator accounted for a 53% market share by automation type in 2025. Electric actuators dominate the market share because they provide precise control in automation, making them essential for various industrial applications. Their reliability and ease of integration with existing systems have made them the preferred choice among manufacturers. The same category is also set to grow fastest, at a CAGR of 10.8% during 2026–2032. Electric actuators are also the fastest-growing segment, as the demand for precise control continues to rise with the modernization of power plants and other facilities. This dual role as both leader and fastest will likely strengthen their market position further. Buyers should consider investing in electric actuators to ensure optimal performance and efficiency in their automation processes.
By Control Interface – PLC/SCADA Dominated, IoT-Based Expected to Grow Fastest
PLC/SCADA held a 39% share of the India Valve Automation Market by control interface in 2025. PLC/SCADA systems dominate the control interface segment, capturing the largest market share due to their essential role in automation and monitoring across various industries. Their reliability in managing complex processes ensures they remain a vital component for achieving operational efficiency in numerous applications. IoT-Based is projected to grow fastest, at a CAGR of 12.4% during 2026–2032. IoT-based interfaces are rapidly gaining traction as they provide enhanced connectivity and real-time data management, aligning with the objectives of the Smart Cities Mission. This growth reflects a broader shift towards integrated and intelligent automation solutions in urban infrastructure. Suppliers should prioritise the development of IoT-based technologies to meet the increasing demand for advanced control interfaces in automation.
By End User – Refinery Plants Dominated, Water Treatment Plants Expected to Grow Fastest
Refinery Plants took a 45% share of end user in 2025, more than any other category. Refinery plants command the largest share in the end-user segment as they are critical for process control and safety, necessitating advanced valve automation solutions. The extensive use of valve automation in over 200 operational refineries underscores their importance in this sector. Water Treatment Plants are set to record the highest CAGR in this split, 12.4% over 2026–2032. Water treatment plants are the fastest-growing end-user segment, driven by the government's allocation of ₹1,000 crores for water treatment projects in 2023, which boosts the demand for automation technologies. This growth reflects a heightened focus on improving water quality and efficiency in treatment processes. Suppliers should target the water treatment sector to capitalize on the increasing investments and automation needs.
Key Attractiveness of the Report
- 10 Years of Market Numbers
- Historical Data Starting from 2022 to 2025
- Base Year 2025
- Forecast Data until 2032
- Key Performance Indicators Impacting the Market
- Major Upcoming Developments and Projects
Key Highlights of the Report:
- India Valve Automation Market Outlook
- Market Size of India Valve Automation Market, 2025
- Forecast of India Valve Automation Market, 2032
- Historical Data and Forecast of India Valve Automation Revenues & Volume for the Period 2022 - 2032F
- India Valve Automation Market Trend Evolution
- India Valve Automation Market Drivers and Challenges
- India Valve Automation Price Trends
- India Valve Automation Porter's Five Forces
- India Valve Automation Industry Life Cycle
- Historical Data and Forecast of India Valve Automation Market Revenues & Volume By Valve Type for the Period 2022 - 2032F
- Historical Data and Forecast of India Valve Automation Market Revenues & Volume By Ball Valves for the Period 2022 - 2032F
- Historical Data and Forecast of India Valve Automation Market Revenues & Volume By Gate Valves for the Period 2022 - 2032F
- Historical Data and Forecast of India Valve Automation Market Revenues & Volume By Butterfly Valves for the Period 2022 - 2032F
- Historical Data and Forecast of India Valve Automation Market Revenues & Volume By Globe Valves for the Period 2022 - 2032F
- Historical Data and Forecast of India Valve Automation Market Revenues & Volume By Automation Type for the Period 2022 - 2032F
- Historical Data and Forecast of India Valve Automation Market Revenues & Volume By Pneumatic for the Period 2022 - 2032F
- Historical Data and Forecast of India Valve Automation Market Revenues & Volume By Electric Actuator for the Period 2022 - 2032F
- Historical Data and Forecast of India Valve Automation Market Revenues & Volume By Hydraulic Actuation for the Period 2022 - 2032F
- Historical Data and Forecast of India Valve Automation Market Revenues & Volume By Electro-Mechanical for the Period 2022 - 2032F
- Historical Data and Forecast of India Valve Automation Market Revenues & Volume By Control Interface for the Period 2022 - 2032F
- Historical Data and Forecast of India Valve Automation Market Revenues & Volume By PLC/SCADA for the Period 2022 - 2032F
- Historical Data and Forecast of India Valve Automation Market Revenues & Volume By DCS for the Period 2022 - 2032F
- Historical Data and Forecast of India Valve Automation Market Revenues & Volume By Remote Access for the Period 2022 - 2032F
- Historical Data and Forecast of India Valve Automation Market Revenues & Volume By IoT-Based for the Period 2022 - 2032F
- Historical Data and Forecast of India Valve Automation Market Revenues & Volume By End User for the Period 2022 - 2032F
- Historical Data and Forecast of India Valve Automation Market Revenues & Volume By Refinery Plants for the Period 2022 - 2032F
- Historical Data and Forecast of India Valve Automation Market Revenues & Volume By Pipeline Operators for the Period 2022 - 2032F
- Historical Data and Forecast of India Valve Automation Market Revenues & Volume By Water Treatment Plants for the Period 2022 - 2032F
- Historical Data and Forecast of India Valve Automation Market Revenues & Volume By Power Plants for the Period 2022 - 2032F
- India Valve Automation Import Export Trade Statistics
- Market Opportunity Assessment By Valve Type
- Market Opportunity Assessment By Automation Type
- Market Opportunity Assessment By Control Interface
- Market Opportunity Assessment By End User
- India Valve Automation Top Companies Market Share
- India Valve Automation Competitive Benchmarking By Technical and Operational Parameters
- India Valve Automation Company Profiles
- India Valve Automation Key Strategic Recommendations
Market Covered
The report offers an extensive study of the following market segments.
By Valve Type
- Ball Valves
- Gate Valves
- Butterfly Valves
- Globe Valves
By Automation Type
- Pneumatic
- Electric Actuator
- Hydraulic Actuation
- Electro-Mechanical
By Control Interface
- PLC/SCADA
- DCS
- Remote Access
- IoT-Based
By End User
- Refinery Plants
- Pipeline Operators
- Water Treatment Plants
- Power Plants































