Indonesia Anthranilic Acid Market (2026-2032) Outlook | Companies, Share, Growth, Industry, Trends, Value, Size, Analysis, Revenue & Forecast
Market Forecast By Product (Pharmaceutical Grade, Industrial Grade), By Applications (Dye, Pharmaceutical, Others) And Competitive Landscape
| Product Code: ETC312568 | Publication Date: Aug 2022 | Updated Date: Jul 2026 | Product Type: Market Research Report | |
| Publisher: 6Wresearch | Author: Ravi Bhandari | No. of Pages: 75 | No. of Figures: 35 | No. of Tables: 20 |
Indonesia Anthranilic Acid Market Size, Share & Growth Rate
The Indonesia Anthranilic Acid Market was estimated at USD 264 Million in 2025 and is projected to reach USD 348 Million by 2032, growing at a CAGR of 4.0% from 2026 to 2032. This growth trajectory is primarily driven by increased consumption in the pharmaceutical sector, alongside rising demand from industrial applications, particularly in paints and coatings. The market's potential is further underscored by the versatility of anthranilic acid, which finds utility across various segments.
Indonesia Anthranilic Acid Market Year-wise Growth Rate and Key Drivers
This graph highlights how the Indonesia Anthranilic Acid Market has steadily grown over the years, supported by major growth factors.
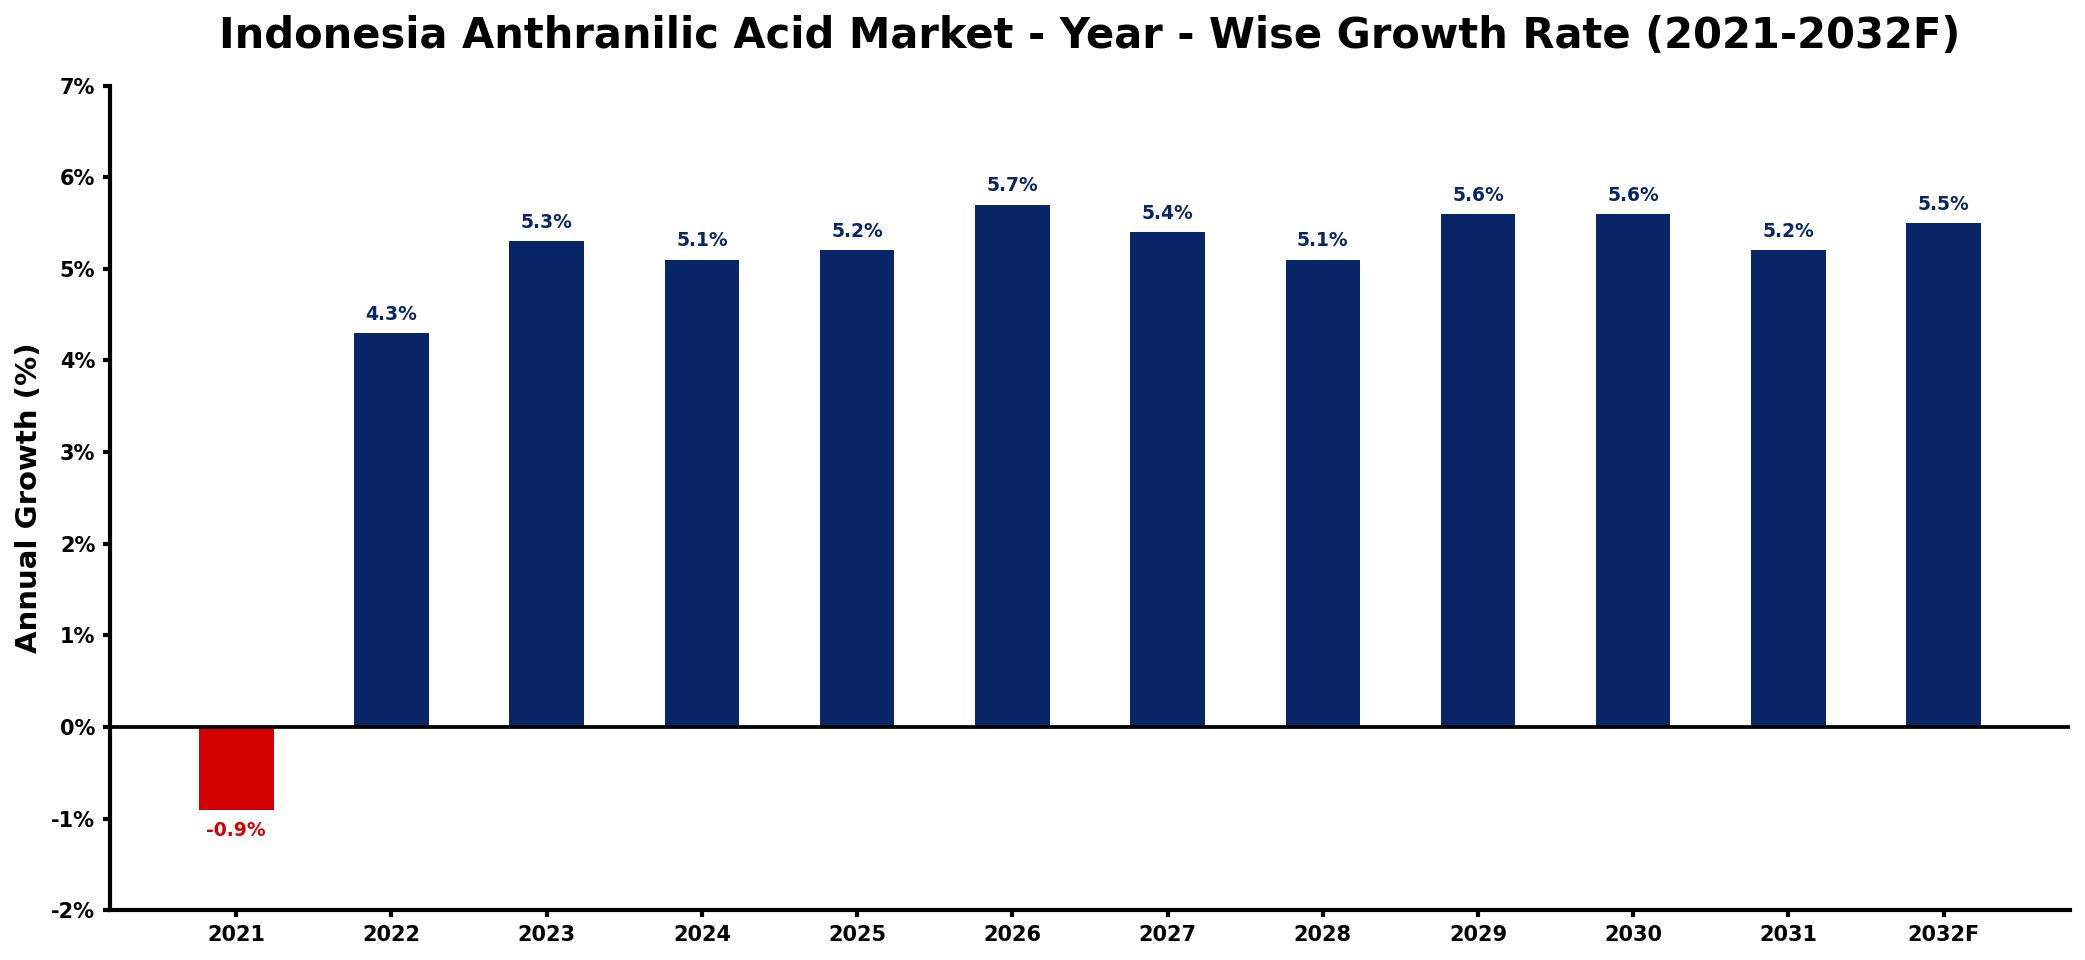
The table below presents the year‑wise growth rates along with the key drivers influencing the market
| Year | Growth Rate | Major Drivers |
| 2021 | -0.9% | Decline in manufacturing investments |
| 2022 | 4.3% | Rising demand in pharmaceuticals sector |
| 2023 | 5.3% | Growth in agricultural applications |
| 2024 | 5.1% | Expansion of cosmetic industry usage |
| 2025 | 5.2% | Increased production capacity initiatives |
| 2026 | 5.7% | Surge in food industry applications |
| 2027 | 5.4% | Growing interest in specialty chemicals |
| 2028 | 5.1% | Emergence of new market players |
| 2029 | 5.6% | Investments in research and development |
| 2030 | 5.6% | Enhanced regulatory support initiatives |
| 2031 | 5.2% | Strengthening export market opportunities |
| 2032 | 5.5% | Innovations in manufacturing processes |
Note: Market size estimations and growth projections presented in this report are based on 6Wresearch's proprietary forecasting methodology, utilizing the latest available industry data, government publications, and primary research inputs.
Indonesia Anthranilic Acid Market Synopsis
The Indonesia Anthranilic Acid market has recently shown momentum, particularly due to the surging interest from the pharmaceutical industry. However, as we look towards 2025 and beyond, the landscape may shift, influenced by supply-side constraints and regulatory pressures. While the current demand landscape is vibrant, these factors could temper growth as the market evolves.
In the coming years, challenges such as volatile raw material prices and stringent regulations on trade practices related to anthranilic acid derivatives may shape the competitive dynamics. Despite these hurdles, the foundational demand from sectors such as textiles and chemicals positions the market for steady, albeit moderated, growth.
Indonesia Anthranilic Acid Market Key Takeaways
- The market is driven by robust demand from pharmaceuticals and industrial applications.
- Growth is tempered by supply constraints and strict regulatory environments.
- Anthranilic acid's diverse applications enhance its market attractiveness.
- Emerging trends indicate a focus on sustainable sourcing and production practices.
- Government initiatives are likely to play a crucial role in market evolution.
Evaluation of Restraints in Indonesia Anthranilic Acid Market
The growth of the Indonesia Anthranilic Acid market faces notable restraints, notably due to sourcing challenges for raw materials. The impact of environmental regulations cannot be overlooked, as companies must navigate compliance while striving to meet production demands. Additionally, domestic production is often hindered by fluctuating raw material prices, which can lead to increased costs and instability in supply chains. These factors collectively impose significant limits on the markets growth potential.
Indonesia Anthranilic Acid Market Trends
Several trends are currently shaping the Indonesia Anthranilic Acid market. A key trend is the growing emphasis on sustainable production methods, driven by both regulatory requirements and consumer demand for eco-friendly products. Furthermore, innovation in the textile and chemical sectors is prompting manufacturers to explore new applications for anthranilic acid, enhancing its relevance in various industrial processes. The pharmaceutical industry's ongoing evolution will likely further drive demand as new formulations are developed.
Indonesia Anthranilic Acid Market Opportunities
The landscape presents several growth and investment opportunities for stakeholders in the Indonesia Anthranilic Acid market. One major area of opportunity lies in the pharmaceutical sector, as the demand for advanced medications continues to rise. Additionally, expanding applications in dyes and coatings open avenues for innovation and market penetration. Companies that invest in sustainable practices and technologies will likely capture a larger share of the market, appealing to environmentally conscious consumers.
Government Initiatives in the Indonesia Anthranilic Acid Market
Government initiatives are increasingly shaping the Indonesia Anthranilic Acid market. With policies aimed at promoting domestic manufacturing and encouraging sustainable practices, the government is laying the groundwork for a more resilient market structure. Incentives for research and development in the chemical sector may also foster innovation and facilitate the growth of anthranilic acid applications in emerging industries.
Future Insights of the Indonesia Anthranilic Acid Market
Looking ahead to 2026-2032, the Indonesia Anthranilic Acid market is expected to navigate a complex landscape of opportunities and challenges. The pharmaceutical sector's growth is likely to be a key driver, given the increasing complexity of drug formulations. Simultaneously, industries focusing on eco-friendly processes will push for innovations that enhance the sustainability of anthranilic acid production. Stakeholders will need to adapt strategically to the regulatory environment to fully capitalize on the projected market growth.
Indonesia Anthranilic Acid Market Latest Developments (2025 - 2026)
Recent developments in the Indonesia Anthranilic Acid market indicate a shift towards greater collaboration between industry players and government bodies. There has been a noticeable increase in initiatives aimed at addressing environmental concerns associated with chemical production. Additionally, ongoing discussions regarding regulatory frameworks may influence market dynamics, potentially paving the way for enhanced trade conditions and market stability.
Indonesia Anthranilic Acid Market - Key Attractiveness of the Report
- 10 Years of Market Numbers
- Historical Data Starting from 2022 to 2025
- Base Year: 2025
- Forecast Data until 2032
- Key Performance Indicators Impacting the Market
- Major Upcoming Developments and Projects
Key Highlights of the Report:
- Indonesia Anthranilic Acid Market Outlook
- Market Size of Indonesia Anthranilic Acid Market, 2025
- Forecast of Indonesia Anthranilic Acid Market, 2032
- Historical Data and Forecast of Indonesia Anthranilic Acid Revenues & Volume for the Period 2022-2032F
- Indonesia Anthranilic Acid Market Trend Evolution
- Indonesia Anthranilic Acid Market Drivers and Challenges
- Indonesia Anthranilic Acid Price Trends
- Indonesia Anthranilic Acid Porter's Five Forces
- Indonesia Anthranilic Acid Industry Life Cycle
- Historical Data and Forecast of Indonesia Anthranilic Acid Market Revenues & Volume By Product for the Period 2022-2032F
- Historical Data and Forecast of Indonesia Anthranilic Acid Market Revenues & Volume By Pharmaceutical Grade for the Period 2022-2032F
- Historical Data and Forecast of Indonesia Anthranilic Acid Market Revenues & Volume By Industrial Grade for the Period 2022-2032F
- Historical Data and Forecast of Indonesia Anthranilic Acid Market Revenues & Volume By Applications for the Period 2022-2032F
- Historical Data and Forecast of Indonesia Anthranilic Acid Market Revenues & Volume By Dye for the Period 2022-2032F
- Historical Data and Forecast of Indonesia Anthranilic Acid Market Revenues & Volume By Pharmaceutical for the Period 2022-2032F
- Historical Data and Forecast of Indonesia Anthranilic Acid Market Revenues & Volume By Others for the Period 2022-2032F
- Indonesia Anthranilic Acid Import Export Trade Statistics
- Market Opportunity Assessment By Product
- Market Opportunity Assessment By Applications
- Indonesia Anthranilic Acid Top Companies Market Share
- Indonesia Anthranilic Acid Competitive Benchmarking By Technical and Operational Parameters
- Indonesia Anthranilic Acid Company Profiles
- Indonesia Anthranilic Acid Key Strategic Recommendations
Frequently Asked Questions About the Market Study (FAQs):
Key factors include rising demand from the pharmaceutical and textile industries, alongside increased applications in paints and coatings. The compound's versatility plays a significant role in driving its market presence.
The Indonesia Anthranilic Acid Market was estimated at USD 264 Million in 2025, and is projected to reach USD 348 Million by 2032, growing at a CAGR of 4.0% from 2026 to 2032.
Regulatory constraints can impede market growth by creating barriers to entry and increasing operational costs for manufacturers. Compliance with stringent environmental standards often requires significant investment and can limit production capabilities.
Sustainable production practices and innovation in applications are key trends. The market is witnessing a shift towards eco-friendly chemicals, driven by both consumer preferences and regulatory pressures.
The pharmaceutical and textile sectors are poised to drive significant demand. In addition, emerging applications in coatings and dyes present further opportunities for market expansion.
6Wresearch actively monitors the Indonesia Anthranilic Acid Market and publishes its comprehensive annual report, highlighting emerging trends, growth drivers, revenue analysis, and forecast outlook. Our insights help businesses to make data-backed strategic decisions with ongoing market dynamics. Our analysts track relevent industries related to the Indonesia Anthranilic Acid Market, allowing our clients with actionable intelligence and reliable forecasts tailored to emerging regional needs.
Yes, we provide customisation as per your requirements. To learn more, feel free to contact us on sales@6wresearch.com
1 Executive Summary |
2 Introduction |
2.1 Key Highlights of the Report |
2.2 Report Description |
2.3 Market Scope & Segmentation |
2.4 Research Methodology |
2.5 Assumptions |
3 Indonesia Anthranilic Acid Market Overview |
3.1 Indonesia Country Macro Economic Indicators |
3.2 Indonesia Anthranilic Acid Market Revenues & Volume, 2022 & 2032F |
3.3 Indonesia Anthranilic Acid Market - Industry Life Cycle |
3.4 Indonesia Anthranilic Acid Market - Porter's Five Forces |
3.5 Indonesia Anthranilic Acid Market Revenues & Volume Share, By Product, 2022 & 2032F |
3.6 Indonesia Anthranilic Acid Market Revenues & Volume Share, By Applications, 2022 & 2032F |
4 Indonesia Anthranilic Acid Market Dynamics |
4.1 Impact Analysis |
4.2 Market Drivers |
4.2.1 Growing demand for anthranilic acid in the pharmaceutical industry for the production of medicines and drugs. |
4.2.2 Increasing use of anthranilic acid in the agrochemical sector for the manufacturing of pesticides and herbicides. |
4.2.3 Rising awareness about the benefits of anthranilic acid in the food and beverage industry for flavoring agents. |
4.3 Market Restraints |
4.3.1 Fluctuating prices of raw materials used in the production of anthranilic acid. |
4.3.2 Stringent government regulations and compliance requirements affecting the production and distribution of anthranilic acid. |
4.3.3 Competition from alternative chemical compounds impacting the market growth. |
5 Indonesia Anthranilic Acid Market Trends |
6 Indonesia Anthranilic Acid Market, By Types |
6.1 Indonesia Anthranilic Acid Market, By Product |
6.1.1 Overview and Analysis |
6.1.2 Indonesia Anthranilic Acid Market Revenues & Volume, By Product, 2022-2032F |
6.1.3 Indonesia Anthranilic Acid Market Revenues & Volume, By Pharmaceutical Grade, 2022-2032F |
6.1.4 Indonesia Anthranilic Acid Market Revenues & Volume, By Industrial Grade, 2022-2032F |
6.2 Indonesia Anthranilic Acid Market, By Applications |
6.2.1 Overview and Analysis |
6.2.2 Indonesia Anthranilic Acid Market Revenues & Volume, By Dye, 2022-2032F |
6.2.3 Indonesia Anthranilic Acid Market Revenues & Volume, By Pharmaceutical, 2022-2032F |
6.2.4 Indonesia Anthranilic Acid Market Revenues & Volume, By Others, 2022-2032F |
7 Indonesia Anthranilic Acid Market Import-Export Trade Statistics |
7.1 Indonesia Anthranilic Acid Market Export to Major Countries |
7.2 Indonesia Anthranilic Acid Market Imports from Major Countries |
8 Indonesia Anthranilic Acid Market Key Performance Indicators |
8.1 Research and development investments in anthranilic acid-based products. |
8.2 Number of patents filed for innovations related to anthranilic acid applications. |
8.3 Percentage of market share held by anthranilic acid-based products in key industries. |
9 Indonesia Anthranilic Acid Market - Opportunity Assessment |
9.1 Indonesia Anthranilic Acid Market Opportunity Assessment, By Product, 2022 & 2032F |
9.2 Indonesia Anthranilic Acid Market Opportunity Assessment, By Applications, 2022 & 2032F |
10 Indonesia Anthranilic Acid Market - Competitive Landscape |
10.1 Indonesia Anthranilic Acid Market Revenue Share, By Companies, 2025 |
10.2 Indonesia Anthranilic Acid Market Competitive Benchmarking, By Operating and Technical Parameters |
11 Company Profiles |
12 Recommendations |
13 Disclaimer |
Global Go To Market Strategy - 2030
Export potential enables firms to identify high-growth global markets with greater confidence by combining advanced trade intelligence with a structured quantitative methodology. The framework analyzes emerging demand trends and country-level import patterns while integrating macroeconomic and trade datasets such as GDP and population forecasts, bilateral import–export flows, tariff structures, elasticity differentials between developed and developing economies, geographic distance, and import demand projections. Using weighted trade values from 2020–2024 as the base period to project country-to-country export potential for 2030, these inputs are operationalized through calculated drivers such as gravity model parameters, tariff impact factors, and projected GDP per-capita growth. Through an analysis of hidden potentials, demand hotspots, and market conditions that are most favorable to success, this method enables firms to focus on target countries, maximize returns, and global expansion with data, backed by accuracy.
By factoring in the projected importer demand gap that is currently unmet and could be potential opportunity, it identifies the potential for the Exporter (Country) among 190 countries, against the general trade analysis, which identifies the biggest importer or exporter.
To discover high-growth global markets and optimize your business strategy:
Click Here
Pricing
- Single User License$ 1,995
- Department License$ 2,400
- Site License$ 3,120
- Global License$ 3,795

Leadership Perspectives from Industry Events
Search
Thought Leadership and Analyst Meet


Our Clients
6WResearch In News
- India Export Attractiveness Tracker 2026
- India Air Conditioner Market Set for Strong Rebound in 2026 After Weather-Led Correction and GST-Driven Recovery: 6Wresearch
- ADAS in India: How Automatic Emergency Braking, Blind Spot Detection & Driver Monitoring are Transforming Road Safety
- Doha a strategic location for EV manufacturing hub: IPA Qatar
- Demand for luxury TVs surging in the GCC, says Samsung
- Empowering Growth: The Thriving Journey of Bangladesh’s Cable Industry
Latest Reports
- Qatar Access and Home Network Market (2026-2032)
- Nicaragua RPG Gaming Market (2026-2032)
- New Zealand RPG Gaming Market (2026-2032)
- Netherlands RPG Gaming Market (2026-2032)
- Nauru RPG Gaming Market (2026-2032)
- Namibia RPG Gaming Market (2026-2032)
- Mozambique RPG Gaming Market (2026-2032)
- Montenegro RPG Gaming Market (2026-2032)
- Mongolia RPG Gaming Market (2026-2032)
- Monaco RPG Gaming Market (2026-2032)
Industry Events and Analyst Meet

EV India Expo 2026

HIMTEX 2026

India Refining Summit 2026

India EV Show 2026

EV tech India Expo 2026
Whitepaper
- Middle East & Africa Commercial Security Market Click here to view more.
- Middle East & Africa Fire Safety Systems & Equipment Market Click here to view more.
- GCC Drone Market Click here to view more.
- Middle East Lighting Fixture Market Click here to view more.
- GCC Physical & Perimeter Security Market Click here to view more.