Indonesia Computer Power Cable Assemblies Market (2026-2032) | Industry, Size, Forecast, Analysis, Trends, Outlook, Value, Companies, Growth, Share, Revenue
Market Forecast By Types (4-Pin Molex, 20-Pin ATX, 26-Pin MDR, 26-Pin SDR), By Applications (PC, Laptop, Super Computer, Others) And Competitive Landscape
| Product Code: ETC032448 | Publication Date: Jul 2023 | Updated Date: Jun 2026 | Product Type: Report | |
| Publisher: 6Wresearch | Author: Ravi Bhandari | No. of Pages: 70 | No. of Figures: 35 | No. of Tables: 5 |
Indonesia Computer Power Cable Assemblies Market Summary
The indonesia computer power cable assemblies market was estimated at USD 150 Million in 2025 and is projected to reach USD 197 Million by 2032, growing at a CAGR of 5.6% from 2026 to 2032.
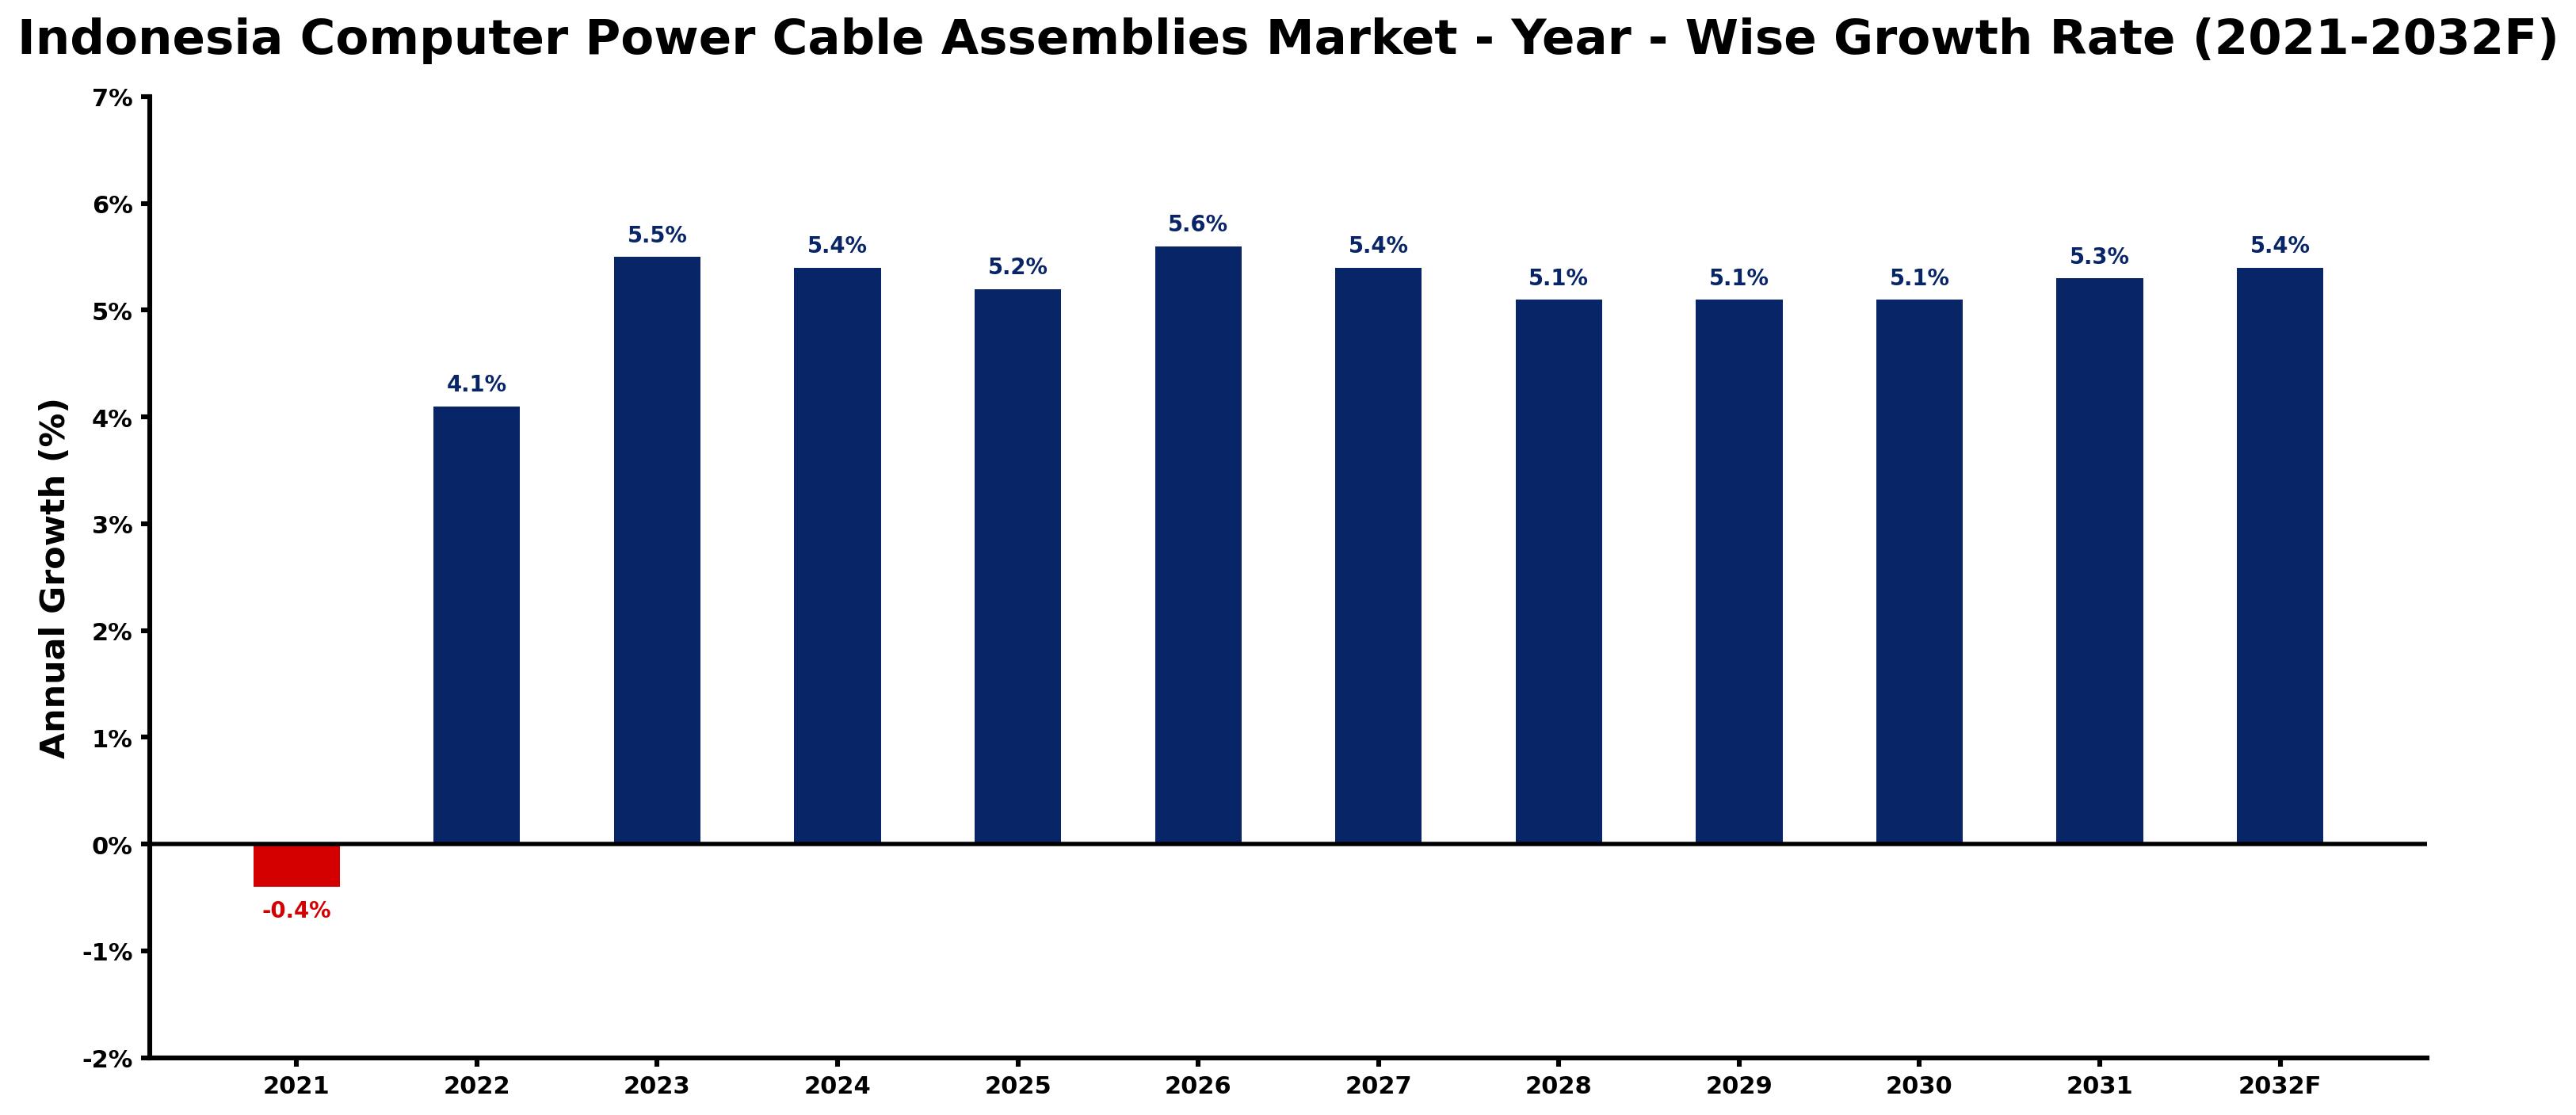
Indonesia Computer Power Cable Assemblies Market Growth Rate Analysis (2021-2032)
The Indonesia Computer Power Cable Assemblies Market is experiencing a notable upward trend, as evidenced by its growth from -0.4% in 2021 to an anticipated 5.5% in 2023. This rebound can be attributed to increased consumer demand for electronic devices, alongside significant investments in infrastructure and industrial automation. The growth is expected to continue at rates of 5.4% in 2024 and 5.2% in 2025, driven by digitalization efforts and the transition toward more energy-efficient technologies. Fluctuations, such as the decline in 2021, were influenced by economic slowdowns, but the subsequent recovery reflects improving market conditions and government policies favoring technology adoption, ensuring sustained expansion through 2032.
Indonesia Computer Power Cable Assemblies Market Year-wise Growth Rate and Key Drivers
This graph highlights how the Indonesia Computer Power Cable Assemblies Market has steadily grown over the past five years, supported by major growth factors.
The table below presents the year wise growth rates along with the key drivers influencing the market
| Year | Growth Rate | Major Drivers |
| 2021 | -0.4% | Intense supply chain disruptions during the pandemic hindered production capabilities and limited product availability. |
| 2022 | 4.1% | Manufacturing activities accelerated, increasing the need for reliable power supply solutions. |
| 2023 | 5.5% | Legacy copper grid failures highlighted the urgent necessity for upgraded power cable assemblies. |
| 2024 | 5.4% | Emerging tech companies expanded operations, necessitating robust and efficient power solutions. |
| 2025 | 5.2% | Corporate sustainability goals prompted investments in high-quality, eco-friendly electrical components. |
| 2026 | 5.6% | Urbanization trends pushed for modern infrastructure, boosting demand for cable assembly systems. |
| 2027 | 5.4% | E-commerce platforms grew, requiring extensive distribution centers with reliable electrical setups. |
| 2028 | 5.1% | Smart city initiatives introduced modern electrical systems, enhancing power distribution efficiency. |
| 2029 | 5.1% | Regional trade agreements facilitated imports of advanced cable manufacturing technologies. |
| 2030 | 5.1% | Increased consumer electronics demand drove innovations in power cable assembly designs. |
| 2031 | 5.3% | Emerging renewable energy projects mandated specialized cable solutions for optimized energy transfer. |
| 2032 | 5.4% | Investment in educational institutions spurred advancements in electrical engineering and design innovations. |
Note - Market size estimations and growth projections presented in this report are based on 6Wresearch's advanced forecasting approach, validated with industry datasets as of June 2026.
Indonesia Computer Power Cable Assemblies Market Synopsis
The Indonesia Computer Power Cable Assemblies Market is projected to reach 5.6% and witness significant growth during the forecast period (2026-2032). This expansion is primarily driven by the increasing demand for consumer electronics and government initiatives aimed at enhancing digitalization across various sectors. With rapid technological advancements, including the miniaturization of connectors and the rise of high-power cables catering to electric vehicles, the demand for computer power cable assemblies is expected to escalate significantly.
Indonesia Computer Power Cable Assemblies Market Growth Drivers
Several key factors are propelling the growth of the Indonesia Computer Power Cable Assemblies Market. The following points elaborate on these driving forces:
- Increasing consumer spending is a vital contributor, with steadily rising disposable incomes enabling households to invest more in electronic devices that necessitate reliable power cable assemblies.
- The Indonesian government is placing a strong emphasis on digital transformation initiatives such as the eKTP program and the introduction of electronic IDs, which will enhance the investments in IT infrastructure.
- Growing adoption of digital communication technologies across various sectors is resulting in increased requirements for highly efficient and durable computer power cable assemblies.
- Technological advancements are leading to innovations in power cable design, contributing to the development of more compact and efficient solutions that cater to specialized applications.
- As electric vehicles gain popularity, the demand for high-power cable assemblies compatible with charging stations and electric infrastructure is anticipated to surge, further driving market growth.
Indonesia Computer Power Cable Assemblies Market Challenges and Restraints
While the market demonstrates promising growth prospects, it also faces certain challenges that could impact its expansion:
- Cost considerations pose a significant barrier, particularly for small and medium enterprises (SMEs) that may struggle to afford customized cable solutions required for specific applications.
- The limited availability of skilled labor in the electronics sector may hinder the production and innovation capabilities within the computer power cable assembly market.
- Fluctuations in raw material prices can adversely affect the production costs of power cable assemblies, potentially leading manufacturers to adjust pricing strategies, which could impact competitiveness.
- Intense competition and rapid technological changes necessitate constant innovation and investment, posing a challenge for companies to maintain their market positions.
- Regulatory compliance and standards can vary, creating complexities for manufacturers seeking to enter or expand their footprint within the Indonesian market.
Indonesia Computer Power Cable Assemblies Market Government Investment and Initiatives
The Indonesian government has recognized the importance of developing a robust digital economy, leading to a focus on various initiatives that bolster the computer power cable assemblies market:
- The government's commitment to enhancing IT infrastructure is evidenced by substantial public investments aimed at improving connectivity and access to digital services across urban and rural areas.
- Programs that promote the adoption of electronic systems in government services and education sectors are also making significant strides in fostering a conducive environment for technology investments.
- Partnerships with international organizations and private sector stakeholders are being formed to implement national strategies for digital transformation and smart infrastructure development.
- Incentives for research and development in local manufacturing capabilities are aimed at reducing dependence on imports and improving the quality of locally produced power cable assemblies.
- Regulatory frameworks are gradually being established to facilitate the growth of the electronics sector, including policies that support innovation and the adoption of sustainable practices in manufacturing.
Indonesia Computer Power Cable Assemblies Market Latest Developments (May 2025 - June 2026)
Recent developments in the Indonesia Computer Power Cable Assemblies Market reflect the dynamic nature of the industry and its response to evolving technology trends:
- Companies are increasingly adopting advanced manufacturing techniques, including automation and smart technologies, to improve efficiency and reduce production costs.
- Research and development activities are being intensified, particularly focusing on sustainable materials for cable manufacturing that comply with environmental standards.
- Collaborative projects aimed at developing standardized connector solutions for various applications are gaining traction, reflecting the industry's push towards interoperability.
- Market players are expanding their product portfolios to cater specifically to the electric vehicle segment, responding to the growing demand for high-performance charging solutions.
- Investment in training programs for workforce development is being prioritized, addressing the skills gap and fostering a more competent labor force within the electronics manufacturing sector.
Indonesia Computer Power Cable Assemblies Market - Key Attractiveness of the Report
- 10 Years of Market Numbers
- Historical Data Starting from 2022 to 2025
- Base Year: 2025
- Forecast Data until 2032
- Key Performance Indicators Impacting the Market
- Major Upcoming Developments and Projects
Key Highlights of the Report:
- Indonesia Computer Power Cable Assemblies Market Outlook
- Market Size of Indonesia Computer Power Cable Assemblies Market, 2025
- Forecast of Indonesia Computer Power Cable Assemblies Market, 2032F
- Historical Data and Forecast of Indonesia Computer Power Cable Assemblies Revenues & Volume for the Period 2022-2032F
- Indonesia Computer Power Cable Assemblies Market Trend Evolution
- Indonesia Computer Power Cable Assemblies Market Drivers and Challenges
- Indonesia Computer Power Cable Assemblies Price Trends
- Indonesia Computer Power Cable Assemblies Porter's Five Forces
- Indonesia Computer Power Cable Assemblies Industry Life Cycle
- Historical Data and Forecast of Indonesia Computer Power Cable Assemblies Market Revenues & Volume By Types for the Period 2022-2032F
- Historical Data and Forecast of Indonesia Computer Power Cable Assemblies Market Revenues & Volume By 4-Pin Molex for the Period 2022-2032F
- Historical Data and Forecast of Indonesia Computer Power Cable Assemblies Market Revenues & Volume By 20-Pin ATX for the Period 2022-2032F
- Historical Data and Forecast of Indonesia Computer Power Cable Assemblies Market Revenues & Volume By 26-Pin MDR for the Period 2022-2032F
- Historical Data and Forecast of Indonesia Computer Power Cable Assemblies Market Revenues & Volume By 26-Pin SDR for the Period 2022-2032F
- Historical Data and Forecast of Indonesia Computer Power Cable Assemblies Market Revenues & Volume By Applications for the Period 2022-2032F
- Historical Data and Forecast of Indonesia Computer Power Cable Assemblies Market Revenues & Volume By PC for the Period 2022-2032F
- Historical Data and Forecast of Indonesia Computer Power Cable Assemblies Market Revenues & Volume By Laptop for the Period 2022-2032F
- Historical Data and Forecast of Indonesia Computer Power Cable Assemblies Market Revenues & Volume By Super Computer for the Period 2022-2032F
- Historical Data and Forecast of Indonesia Computer Power Cable Assemblies Market Revenues & Volume By Others for the Period 2022-2032F
- Indonesia Computer Power Cable Assemblies Import Export Trade Statistics
- Market Opportunity Assessment By Types
- Market Opportunity Assessment By Applications
- Indonesia Computer Power Cable Assemblies Top Companies Market Share
- Indonesia Computer Power Cable Assemblies Competitive Benchmarking By Technical and Operational Parameters
- Indonesia Computer Power Cable Assemblies Company Profiles
- Indonesia Computer Power Cable Assemblies Key Strategic Recommendations
Frequently Asked Questions About the Market Study (FAQs):
The growth is primarily driven by increasing consumer demand for electronics, government digitalization initiatives, and advancements in technology that promote efficient connectivity solutions.
The market encounters challenges such as high costs associated with customized solutions, a skills gap in the labor force, and fluctuating raw material prices that affect production costs.
The Indonesian government is investing in IT infrastructure and creating regulatory frameworks that facilitate growth and encourage innovation within the electronics sector.
Companies are likely to focus on automation in manufacturing, sustainable materials, and training programs, alongside expanding their product offerings to meet the particular needs of the electric vehicle sector.
6Wresearch actively monitors the Indonesia Computer Power Cable Assemblies Market and publishes its comprehensive annual report, highlighting emerging trends, growth drivers, revenue analysis, and forecast outlook. Our insights help businesses to make data-backed strategic decisions with ongoing market dynamics. Our analysts track relevent industries related to the Indonesia Computer Power Cable Assemblies Market, allowing our clients with actionable intelligence and reliable forecasts tailored to emerging regional needs.
Yes, we provide customisation as per your requirements. To learn more, feel free to contact us on sales@6wresearch.com
1 Executive Summary |
2 Introduction |
2.1 Key Highlights of the Report |
2.2 Report Description |
2.3 Market Scope & Segmentation |
2.4 Research Methodology |
2.5 Assumptions |
3 Indonesia Computer Power Cable Assemblies Market Overview |
3.1 Indonesia Country Macro Economic Indicators |
3.2 Indonesia Computer Power Cable Assemblies Market Revenues & Volume, 2022 & 2032F |
3.3 Indonesia Computer Power Cable Assemblies Market - Industry Life Cycle |
3.4 Indonesia Computer Power Cable Assemblies Market - Porter's Five Forces |
3.5 Indonesia Computer Power Cable Assemblies Market Revenues & Volume Share, By Types, 2022 & 2032F |
3.6 Indonesia Computer Power Cable Assemblies Market Revenues & Volume Share, By Applications, 2022 & 2032F |
4 Indonesia Computer Power Cable Assemblies Market Dynamics |
4.1 Impact Analysis |
4.2 Market Drivers |
4.3 Market Restraints |
5 Indonesia Computer Power Cable Assemblies Market Trends |
6 Indonesia Computer Power Cable Assemblies Market, By Types |
6.1 Indonesia Computer Power Cable Assemblies Market, By Types |
6.1.1 Overview and Analysis |
6.1.2 Indonesia Computer Power Cable Assemblies Market Revenues & Volume, By Types, 2022-2032F |
6.1.3 Indonesia Computer Power Cable Assemblies Market Revenues & Volume, By 4-Pin Molex, 2022-2032F |
6.1.4 Indonesia Computer Power Cable Assemblies Market Revenues & Volume, By 20-Pin ATX, 2022-2032F |
6.1.5 Indonesia Computer Power Cable Assemblies Market Revenues & Volume, By 26-Pin MDR, 2022-2032F |
6.1.6 Indonesia Computer Power Cable Assemblies Market Revenues & Volume, By 26-Pin SDR, 2022-2032F |
6.2 Indonesia Computer Power Cable Assemblies Market, By Applications |
6.2.1 Overview and Analysis |
6.2.2 Indonesia Computer Power Cable Assemblies Market Revenues & Volume, By PC, 2022-2032F |
6.2.3 Indonesia Computer Power Cable Assemblies Market Revenues & Volume, By Laptop, 2022-2032F |
6.2.4 Indonesia Computer Power Cable Assemblies Market Revenues & Volume, By Super Computer, 2022-2032F |
6.2.5 Indonesia Computer Power Cable Assemblies Market Revenues & Volume, By Others, 2022-2032F |
7 Indonesia Computer Power Cable Assemblies Market Import-Export Trade Statistics |
7.1 Indonesia Computer Power Cable Assemblies Market Export to Major Countries |
7.2 Indonesia Computer Power Cable Assemblies Market Imports from Major Countries |
8 Indonesia Computer Power Cable Assemblies Market Key Performance Indicators |
9 Indonesia Computer Power Cable Assemblies Market - Opportunity Assessment |
9.1 Indonesia Computer Power Cable Assemblies Market Opportunity Assessment, By Types, 2022 & 2032F |
9.2 Indonesia Computer Power Cable Assemblies Market Opportunity Assessment, By Applications, 2022 & 2032F |
10 Indonesia Computer Power Cable Assemblies Market - Competitive Landscape |
10.1 Indonesia Computer Power Cable Assemblies Market Revenue Share, By Companies, 2025 |
10.2 Indonesia Computer Power Cable Assemblies Market Competitive Benchmarking, By Operating and Technical Parameters |
11 Company Profiles |
12 Recommendations |
13 Disclaimer |
Global Go To Market Strategy - 2030
Export potential enables firms to identify high-growth global markets with greater confidence by combining advanced trade intelligence with a structured quantitative methodology. The framework analyzes emerging demand trends and country-level import patterns while integrating macroeconomic and trade datasets such as GDP and population forecasts, bilateral import–export flows, tariff structures, elasticity differentials between developed and developing economies, geographic distance, and import demand projections. Using weighted trade values from 2020–2024 as the base period to project country-to-country export potential for 2030, these inputs are operationalized through calculated drivers such as gravity model parameters, tariff impact factors, and projected GDP per-capita growth. Through an analysis of hidden potentials, demand hotspots, and market conditions that are most favorable to success, this method enables firms to focus on target countries, maximize returns, and global expansion with data, backed by accuracy.
By factoring in the projected importer demand gap that is currently unmet and could be potential opportunity, it identifies the potential for the Exporter (Country) among 190 countries, against the general trade analysis, which identifies the biggest importer or exporter.
To discover high-growth global markets and optimize your business strategy:
Click Here
Pricing
- Single User License$ 1,995
- Department License$ 2,400
- Site License$ 3,120
- Global License$ 3,795

Leadership Perspectives from Industry Events
Search
Thought Leadership and Analyst Meet


Our Clients
6WResearch In News
- Doha a strategic location for EV manufacturing hub: IPA Qatar
- Demand for luxury TVs surging in the GCC, says Samsung
- Empowering Growth: The Thriving Journey of Bangladesh’s Cable Industry
- Demand for luxury TVs surging in the GCC, says Samsung
- Video call with a traditional healer? Once unthinkable, it’s now common in South Africa
- Intelligent Buildings To Smooth GCC’s Path To Net Zero
Latest Reports
- Cape Verde Portable Hand-Thrown Extinguisher Market (2026-2032)
- Canada Portable Hand-Thrown Extinguisher Market (2026-2032)
- Cameroon Portable Hand-Thrown Extinguisher Market (2026-2032)
- Burundi Portable Hand-Thrown Extinguisher Market (2026-2032)
- Burkina Faso Portable Hand-Thrown Extinguisher Market (2026-2032)
- Bulgaria Portable Hand-Thrown Extinguisher Market (2026-2032)
- Brunei Portable Hand-Thrown Extinguisher Market (2026-2032)
- Botswana Portable Hand-Thrown Extinguisher Market (2026-2032)
- Bosnia and Herzegovina Portable Hand-Thrown Extinguisher Market (2026-2032)
- Bolivia Portable Hand-Thrown Extinguisher Market (2026-2032)
Industry Events and Analyst Meet

HIMTEX 2026

India Refining Summit 2026

India EV Show 2026

EV tech India Expo 2026

Auto Tech Asia 2026
Whitepaper
- Middle East & Africa Commercial Security Market Click here to view more.
- Middle East & Africa Fire Safety Systems & Equipment Market Click here to view more.
- GCC Drone Market Click here to view more.
- Middle East Lighting Fixture Market Click here to view more.
- GCC Physical & Perimeter Security Market Click here to view more.