Indonesia Copper Forged Market (2026-2032) | Value, Outlook, Analysis, Growth, Revenue, Size, Forecast, Industry, Companies, Share & Trends
Market Forecast By Product Types (Closed Die Forging, Open Die Forging, Rolled Ring Forging), By Applications (Automotive, Aerospace, Oil & Gas, Construction, Agriculture, Others) And Competitive Landscape
| Product Code: ETC009228 | Publication Date: Jul 2023 | Updated Date: Jun 2026 | Product Type: Report | |
| Publisher: 6Wresearch | Author: Ravi Bhandari | No. of Pages: 70 | No. of Figures: 35 | No. of Tables: 5 |
Indonesia Copper Forged Market Summary
The indonesia copper forged market was estimated at USD 333 Million in 2025 and is projected to reach USD 443 Million by 2032, growing at a CAGR of 5.4% from 2026 to 2032.
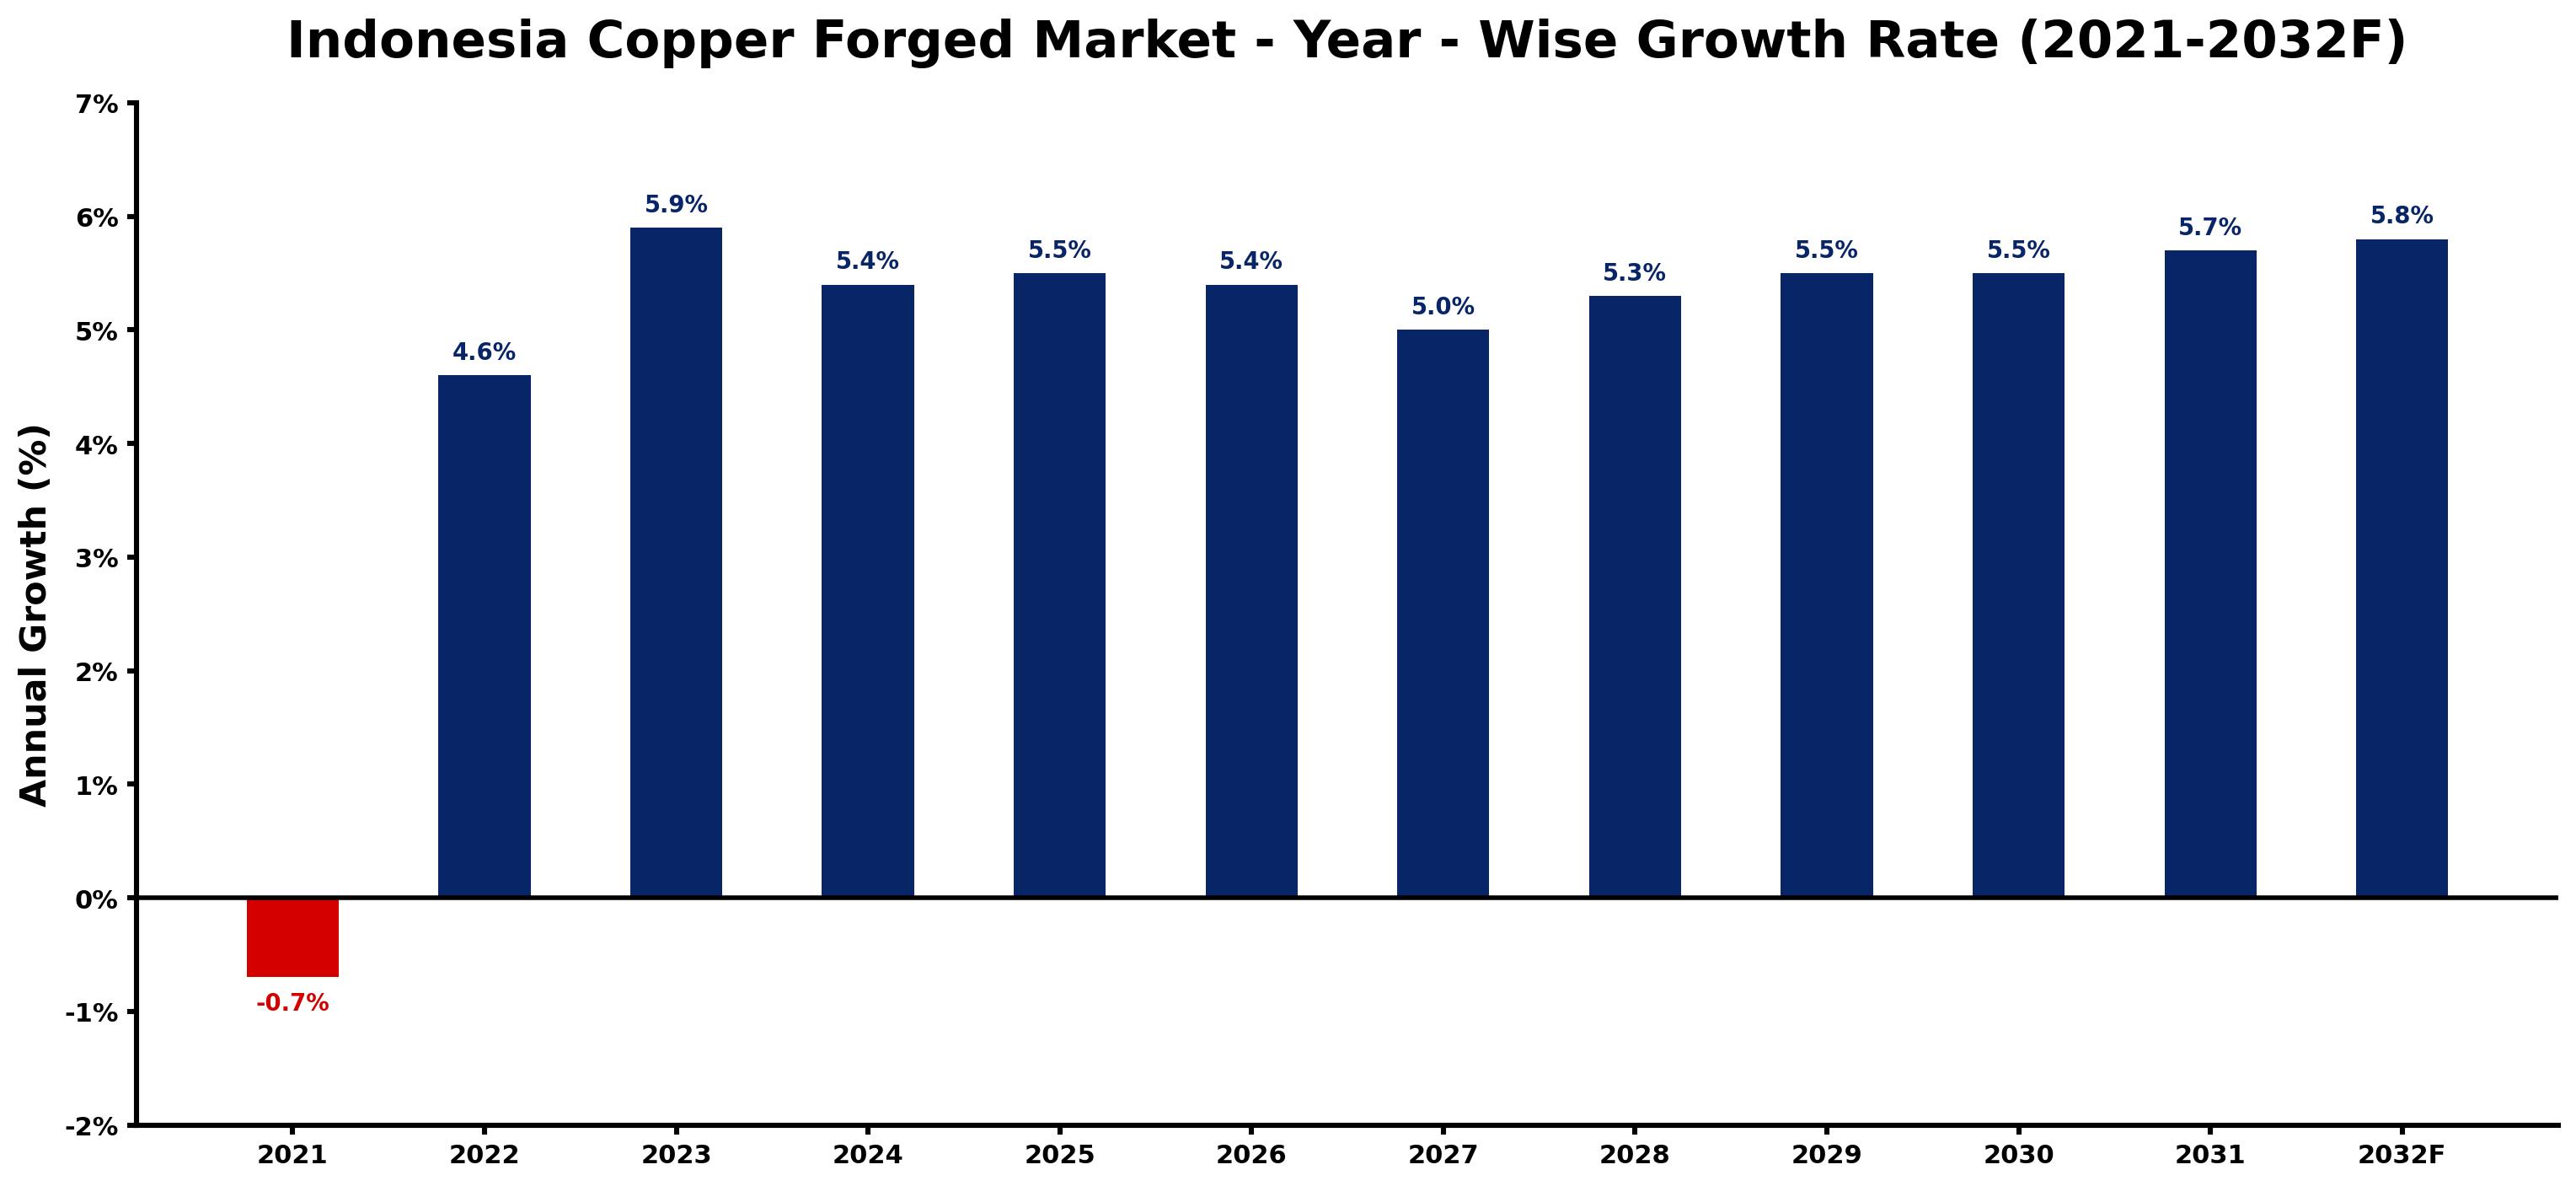
Indonesia Copper Forged Market Growth Rate Analysis (2021-2032)
The Indonesia Copper Forged market has exhibited notable fluctuations recently, beginning with a slight contraction of -0.7% in 2021 due to pandemic-related disruptions. However, recovery initiated in 2022 with a 4.6% growth, propelled by increased consumer demand and significant investments in infrastructure projects. This upward trend has continued into 2023, showing a robust 5.9% growth, driven by rising industrial applications and a shift towards energy-efficient technologies. The market is expected to maintain this momentum, with projected growth rates of around 5.4% to 5.8% through 2032. Factors such as government policies supporting green initiatives and advancements in digitalization are expected to further sustain demand in the coming years.
Indonesia Copper Forged Market Year-wise Growth Rate and Key Drivers
This graph highlights how the Indonesia Copper Forged Market has steadily grown over the past five years, supported by major growth factors.
The table below presents the year wise growth rates along with the key drivers influencing the market
| Year | Growth Rate | Major Drivers |
| 2021 | -0.7% | Decreased global demand for construction materials led to reduced orders for copper forged products in Indonesia. |
| 2022 | 4.6% | Increased urbanization led to higher demand for electrical and plumbing fittings using copper. |
| 2023 | 5.9% | Manufacturers upgraded production processes to enhance efficiency and reduce waste in operations. |
| 2024 | 5.4% | Growing popularity of electric vehicles amplified the need for high-quality copper components. |
| 2025 | 5.5% | Indonesian construction boom utilized copper in renewable energy installations, particularly solar projects. |
| 2026 | 5.4% | Local businesses emphasized sustainability, pushing suppliers toward eco-friendly copper sourcing practices. |
| 2027 | 5.0% | Rural electrification programs created significant opportunities for copper forged products in remote areas. |
| 2028 | 5.3% | International trade agreements boosted copper import/export, enhancing market competitiveness and pricing. |
| 2029 | 5.5% | Technological advancement in manufacturing introduced innovative copper forging techniques and materials. |
| 2030 | 5.5% | Infrastructure upgrades in urban centers heightened the requirements for durable copper applications. |
| 2031 | 5.7% | Partnerships between industries fostered shared knowledge, improving copper product development and usage. |
| 2032 | 5.8% | The shift towards smart grids required advanced copper solutions for efficiency and connectivity. |
Note - Market size estimations and growth projections presented in this report are based on 6Wresearch's advanced forecasting approach, validated with industry datasets as of June 2026.
Indonesia Copper Forged Market Synopsis
The Indonesia Copper Forged Market is projected to reach 5.4% and witness significant growth during the forecast period (2026-2032). As a major global player in copper production, Indonesia has seen its copper output increase substantially over the last decade, driven by escalating demand from neighboring Asian nations, particularly China. This rise in production has translated to a corresponding growth in the forged copper sector within the country.
Indonesia Copper Forged Market Growth Drivers
Several critical factors are propelling the growth of the Indonesia Copper Forged Market:
- The increasing global demand for copper, particularly in sectors like automotive manufacturing and renewable energy, is a significant driver for the market. The versatility of copper makes it an essential material in various applications, leading to heightened production needs.
- Strong international demand from China and other Asian countries has positively influenced Indonesia's copper exports. This trend supports the ongoing expansion of the country's forged copper capabilities to meet global supply requirements.
- Government initiatives to bolster investment in mining and metallurgy are crucial. Policies aimed at enhancing the business environment for local and foreign players in the industry encourage growth across the entire copper value chain.
- The rising prices of copper in response to demand fluctuations have increased profitability for businesses involved in copper forging. Stakeholders are more willing to invest as a result of favorable pricing dynamics.
- Technological advancements in production and forging methods enhance operational efficiency, thereby allowing Indonesian manufacturers to compete more effectively on an international scale.
Indonesia Copper Forged Market Challenges and Restraints
Despite its potential, the Indonesia Copper Forged Market faces notable challenges that could hinder growth:
- The high-cost structure associated with copper mining is a significant barrier. Much of Indonesia's copper is located deep underground, resulting in high extraction costs compared to other countries with more accessible mineral deposits.
- There is a shortage of skilled labor in the mining and forging sectors. The reliance on automation in industrial processes has led to a decrease in manual skill levels, posing a challenge for companies that require specialized craftsmanship in copper forging.
- Environmental regulations and sustainability concerns related to mining activities can increase operational complexities and costs, leading to potential project delays or cancellations.
- Global market fluctuations and economic uncertainties can impact demand for forged copper products, creating volatility in sales and revenue for manufacturers.
- Infrastructure challenges in remote mining regions may limit operational efficiency and increase logistics costs for transporting raw materials and finished products.
Indonesia Copper Forged Market Government Investment and Initiatives
The Indonesian government has been proactive in fostering the growth of the copper forged market through several investment and policy initiatives:
- Investment incentives have been introduced to attract foreign direct investment (FDI) into the mining sector. These initiatives aim to create an enabling environment for both domestic and international players in the forged copper market.
- Enhancements to regulatory frameworks have streamlined processes for obtaining mining permits, facilitating quicker project initiation and development timelines.
- The government has also focused on improving infrastructure, such as transport links, to support mining operations and enhance supply chain efficiency.
- Policies aimed at localizing the supply chain are being implemented, encouraging the use of domestic resources and expertise, which can reduce costs and stimulate local economies.
- Public investments in education and vocational training programs are being prioritized to address the skills gap in the labor market, thereby ensuring a steady supply of qualified personnel in the copper forging industry.
Indonesia Copper Forged Market Latest Developments (May 2025 - June 2026)
In the period from May 2025 to June 2026, the Indonesia Copper Forged Market has witnessed several noteworthy developments:
- Increased operational efficiencies have been reported as companies adopt newer, more innovative technologies in the forging process, enhancing output quality and reducing costs.
- Global market trends indicate a sustained rise in copper prices, prompting increased investment in domestic production capacity and infrastructure in Indonesia.
- The government has launched new initiatives aimed at further increasing export capabilities, making it more competitive in the regional and global markets.
- Focus on sustainability has intensified, with several companies implementing greener practices in their operations, responding to both regulatory pressures and consumer preferences for environmentally friendly products.
- Collaborations between local manufacturers and international partners have emerged, aimed at knowledge transfer and enhancing technological capabilities within the industry.
Indonesia Copper Forged Market - Key Attractiveness of the Report
- 10 Years of Market Numbers
- Historical Data Starting from 2022 to 2025
- Base Year: 2025
- Forecast Data until 2032
- Key Performance Indicators Impacting the Market
- Major Upcoming Developments and Projects
Key Highlights of the Report:
- Indonesia Copper Forged Market Outlook
- Market Size of Indonesia Copper Forged Market, 2025
- Forecast of Indonesia Copper Forged Market, 2032
- Historical Data and Forecast of Indonesia Copper Forged Revenues & Volume for the Period 2022-2032F
- Indonesia Copper Forged Market Trend Evolution
- Indonesia Copper Forged Market Drivers and Challenges
- Indonesia Copper Forged Price Trends
- Indonesia Copper Forged Porter's Five Forces
- Indonesia Copper Forged Industry Life Cycle
- Historical Data and Forecast of Indonesia Copper Forged Market Revenues & Volume By Product Types for the Period 2022-2032F
- Historical Data and Forecast of Indonesia Copper Forged Market Revenues & Volume By Closed Die Forging for the Period 2022-2032F
- Historical Data and Forecast of Indonesia Copper Forged Market Revenues & Volume By Open Die Forging for the Period 2022-2032F
- Historical Data and Forecast of Indonesia Copper Forged Market Revenues & Volume By Rolled Ring Forging for the Period 2022-2032F
- Historical Data and Forecast of Indonesia Copper Forged Market Revenues & Volume By Applications for the Period 2022-2032F
- Historical Data and Forecast of Indonesia Copper Forged Market Revenues & Volume By Automotive for the Period 2022-2032F
- Historical Data and Forecast of Indonesia Copper Forged Market Revenues & Volume By Aerospace for the Period 2022-2032F
- Historical Data and Forecast of Indonesia Copper Forged Market Revenues & Volume By Oil & Gas for the Period 2022-2032F
- Historical Data and Forecast of Indonesia Copper Forged Market Revenues & Volume By Construction for the Period 2022-2032F
- Historical Data and Forecast of Indonesia Copper Forged Market Revenues & Volume By Agriculture for the Period 2022-2032F
- Historical Data and Forecast of Indonesia Copper Forged Market Revenues & Volume By Others for the Period 2022-2032F
- Indonesia Copper Forged Import Export Trade Statistics
- Market Opportunity Assessment By Product Types
- Market Opportunity Assessment By Applications
- Indonesia Copper Forged Top Companies Market Share
- Indonesia Copper Forged Competitive Benchmarking By Technical and Operational Parameters
- Indonesia Copper Forged Company Profiles
- Indonesia Copper Forged Key Strategic Recommendations
Frequently Asked Questions About the Market Study (FAQs):
The growth is primarily driven by increasing global demand for copper, supportive government policies, and rising export capabilities.
Major challenges include high operational costs and a lack of skilled labor, which can hinder competitiveness.
The government is providing investment incentives, streamlining regulations, and investing in infrastructure and education to enhance industry capabilities.
Recent developments include the adoption of advanced technologies, increased focus on sustainability, and strategic partnerships to enhance production capabilities.
6Wresearch actively monitors the Indonesia Copper Forged Market and publishes its comprehensive annual report, highlighting emerging trends, growth drivers, revenue analysis, and forecast outlook. Our insights help businesses to make data-backed strategic decisions with ongoing market dynamics. Our analysts track relevent industries related to the Indonesia Copper Forged Market, allowing our clients with actionable intelligence and reliable forecasts tailored to emerging regional needs.
Yes, we provide customisation as per your requirements. To learn more, feel free to contact us on sales@6wresearch.com
1 Executive Summary |
2 Introduction |
2.1 Key Highlights of the Report |
2.2 Report Description |
2.3 Market Scope & Segmentation |
2.4 Research Methodology |
2.5 Assumptions |
3 Indonesia Copper Forged Market Overview |
3.1 Indonesia Country Macro Economic Indicators |
3.2 Indonesia Copper Forged Market Revenues & Volume, 2022 & 2032F |
3.3 Indonesia Copper Forged Market - Industry Life Cycle |
3.4 Indonesia Copper Forged Market - Porter's Five Forces |
3.5 Indonesia Copper Forged Market Revenues & Volume Share, By Product Types, 2022 & 2032F |
3.6 Indonesia Copper Forged Market Revenues & Volume Share, By Applications, 2022 & 2032F |
4 Indonesia Copper Forged Market Dynamics |
4.1 Impact Analysis |
4.2 Market Drivers |
4.2.1 Increasing demand for copper products in various industries such as construction, automotive, and electronics |
4.2.2 Growth in infrastructure development projects in Indonesia driving the need for copper forged products |
4.2.3 Technological advancements leading to the development of innovative copper forged products |
4.3 Market Restraints |
4.3.1 Fluctuating prices of raw materials impacting production costs |
4.3.2 Competition from alternative materials like aluminum and steel affecting market share |
4.3.3 Environmental regulations and sustainability concerns influencing production processes |
5 Indonesia Copper Forged Market Trends |
6 Indonesia Copper Forged Market, By Types |
6.1 Indonesia Copper Forged Market, By Product Types |
6.1.1 Overview and Analysis |
6.1.2 Indonesia Copper Forged Market Revenues & Volume, By Product Types, 2022-2032F |
6.1.3 Indonesia Copper Forged Market Revenues & Volume, By Closed Die Forging, 2022-2032F |
6.1.4 Indonesia Copper Forged Market Revenues & Volume, By Open Die Forging, 2022-2032F |
6.1.5 Indonesia Copper Forged Market Revenues & Volume, By Rolled Ring Forging, 2022-2032F |
6.2 Indonesia Copper Forged Market, By Applications |
6.2.1 Overview and Analysis |
6.2.2 Indonesia Copper Forged Market Revenues & Volume, By Automotive, 2022-2032F |
6.2.3 Indonesia Copper Forged Market Revenues & Volume, By Aerospace, 2022-2032F |
6.2.4 Indonesia Copper Forged Market Revenues & Volume, By Oil & Gas, 2022-2032F |
6.2.5 Indonesia Copper Forged Market Revenues & Volume, By Construction, 2022-2032F |
6.2.6 Indonesia Copper Forged Market Revenues & Volume, By Agriculture, 2022-2032F |
6.2.7 Indonesia Copper Forged Market Revenues & Volume, By Others, 2022-2032F |
7 Indonesia Copper Forged Market Import-Export Trade Statistics |
7.1 Indonesia Copper Forged Market Export to Major Countries |
7.2 Indonesia Copper Forged Market Imports from Major Countries |
8 Indonesia Copper Forged Market Key Performance Indicators |
8.1 Percentage of revenue derived from new product innovations |
8.2 Number of partnerships or collaborations with key industry players |
8.3 Rate of adoption of advanced manufacturing technologies in the production process |
9 Indonesia Copper Forged Market - Opportunity Assessment |
9.1 Indonesia Copper Forged Market Opportunity Assessment, By Product Types, 2022 & 2032F |
9.2 Indonesia Copper Forged Market Opportunity Assessment, By Applications, 2022 & 2032F |
10 Indonesia Copper Forged Market - Competitive Landscape |
10.1 Indonesia Copper Forged Market Revenue Share, By Companies, 2025 |
10.2 Indonesia Copper Forged Market Competitive Benchmarking, By Operating and Technical Parameters |
11 Company Profiles |
12 Recommendations |
13 Disclaimer |
Global Go To Market Strategy - 2030
Export potential enables firms to identify high-growth global markets with greater confidence by combining advanced trade intelligence with a structured quantitative methodology. The framework analyzes emerging demand trends and country-level import patterns while integrating macroeconomic and trade datasets such as GDP and population forecasts, bilateral import–export flows, tariff structures, elasticity differentials between developed and developing economies, geographic distance, and import demand projections. Using weighted trade values from 2020–2024 as the base period to project country-to-country export potential for 2030, these inputs are operationalized through calculated drivers such as gravity model parameters, tariff impact factors, and projected GDP per-capita growth. Through an analysis of hidden potentials, demand hotspots, and market conditions that are most favorable to success, this method enables firms to focus on target countries, maximize returns, and global expansion with data, backed by accuracy.
By factoring in the projected importer demand gap that is currently unmet and could be potential opportunity, it identifies the potential for the Exporter (Country) among 190 countries, against the general trade analysis, which identifies the biggest importer or exporter.
To discover high-growth global markets and optimize your business strategy:
Click Here
Pricing
- Single User License$ 1,995
- Department License$ 2,400
- Site License$ 3,120
- Global License$ 3,795

Leadership Perspectives from Industry Events
Search
Thought Leadership and Analyst Meet


Our Clients
6WResearch In News
- India Air Conditioner Market Set for Strong Rebound in 2026 After Weather-Led Correction and GST-Driven Recovery: 6Wresearch
- ADAS in India: How Automatic Emergency Braking, Blind Spot Detection & Driver Monitoring are Transforming Road Safety
- Doha a strategic location for EV manufacturing hub: IPA Qatar
- Demand for luxury TVs surging in the GCC, says Samsung
- Empowering Growth: The Thriving Journey of Bangladesh’s Cable Industry
- Demand for luxury TVs surging in the GCC, says Samsung
Latest Reports
- Poland Fire Protection Systems Market (2026-2032)
- Cape Verde Portable Hand-Thrown Extinguisher Market (2026-2032)
- Canada Portable Hand-Thrown Extinguisher Market (2026-2032)
- Cameroon Portable Hand-Thrown Extinguisher Market (2026-2032)
- Burundi Portable Hand-Thrown Extinguisher Market (2026-2032)
- Burkina Faso Portable Hand-Thrown Extinguisher Market (2026-2032)
- Bulgaria Portable Hand-Thrown Extinguisher Market (2026-2032)
- Brunei Portable Hand-Thrown Extinguisher Market (2026-2032)
- Botswana Portable Hand-Thrown Extinguisher Market (2026-2032)
- Bosnia and Herzegovina Portable Hand-Thrown Extinguisher Market (2026-2032)
Industry Events and Analyst Meet

HIMTEX 2026

India Refining Summit 2026

India EV Show 2026

EV tech India Expo 2026

Auto Tech Asia 2026
Whitepaper
- Middle East & Africa Commercial Security Market Click here to view more.
- Middle East & Africa Fire Safety Systems & Equipment Market Click here to view more.
- GCC Drone Market Click here to view more.
- Middle East Lighting Fixture Market Click here to view more.
- GCC Physical & Perimeter Security Market Click here to view more.