Indonesia Custom Belts Market (2026-2032) Outlook | Share, Analysis, Companies, Revenue, Value, Forecast, Trends, Industry, Growth & Size
Market Forecast By Type (Cowhide, Sheepskin, Crocodile Skin, Other), By Application (Man, Woman, Children) And Competitive Landscape
| Product Code: ETC277048 | Publication Date: Aug 2023 | Updated Date: Mar 2026 | Product Type: Market Research Report | |
| Publisher: 6Wresearch | Author: Ravi Bhandari | No. of Pages: 75 | No. of Figures: 35 | No. of Tables: 20 |
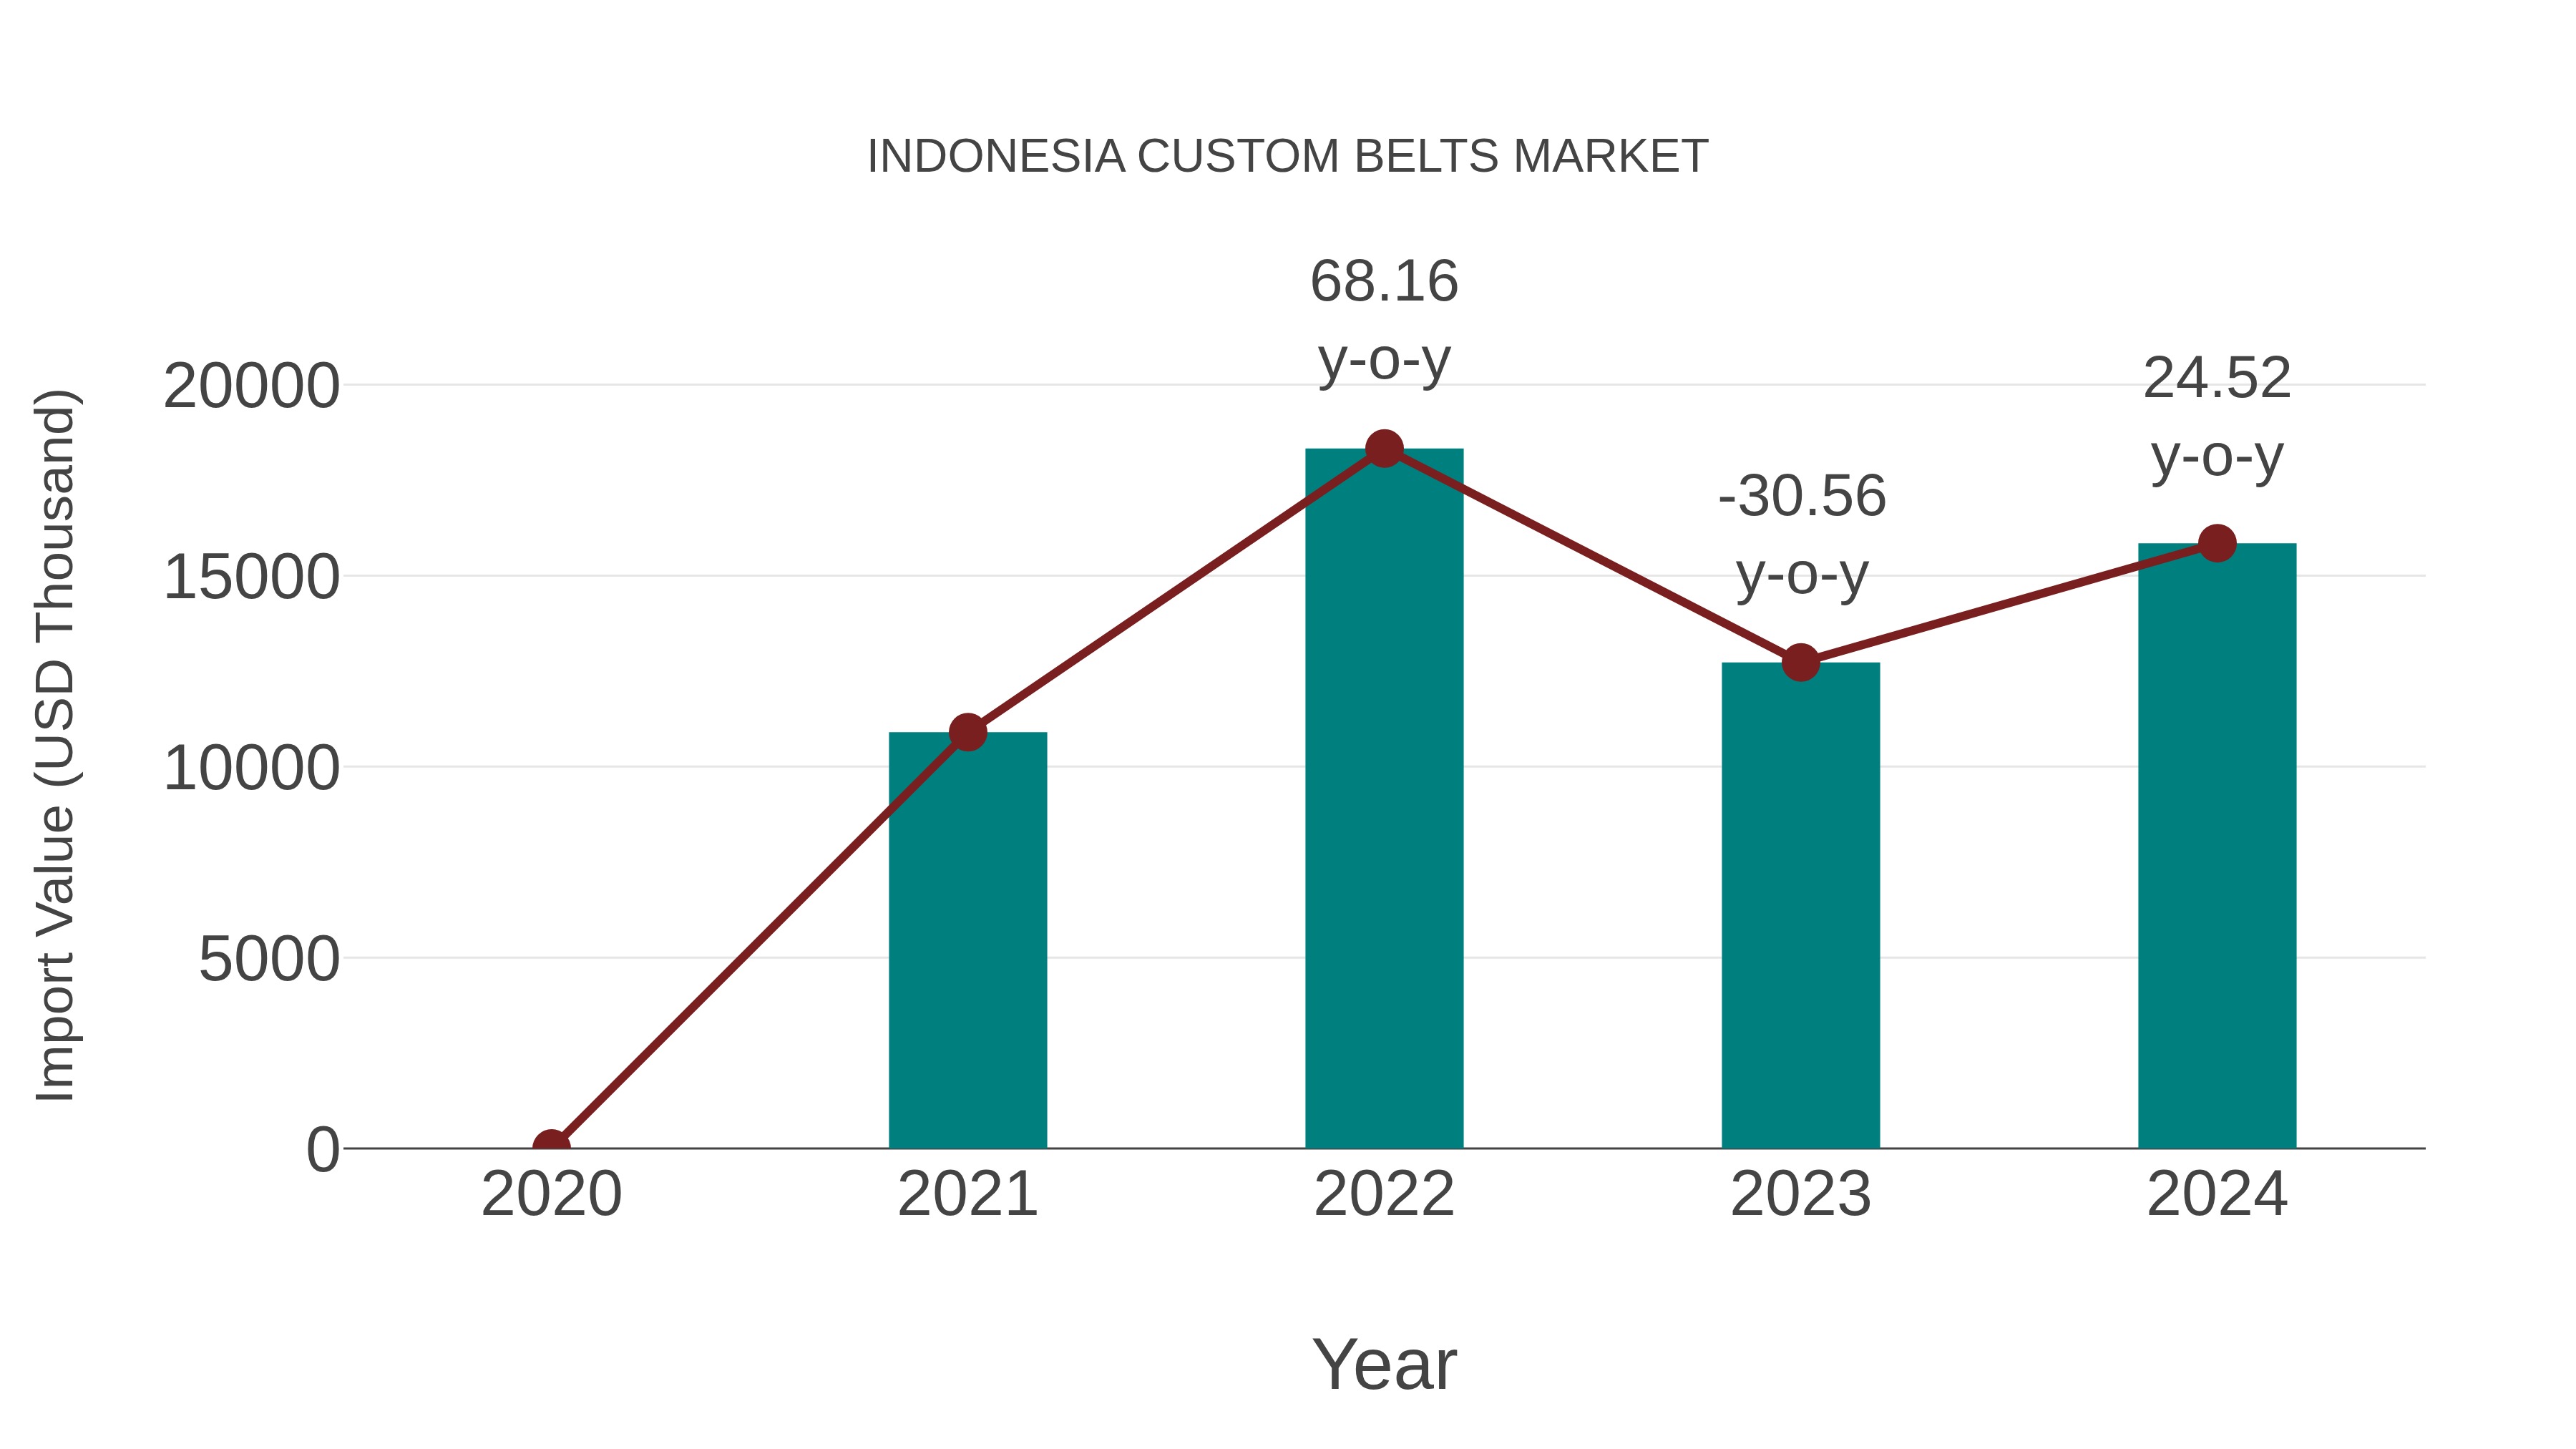
Indonesia Custom Belts Market: Import Trend Analysis
In the Indonesia custom belts market, the import trend showed significant growth from 2023 to 2024, with a growth rate of 24.52%. The compound annual growth rate (CAGR) for imports between 2020 and 2024 was 13.29%. This uptrend could be attributed to a surge in consumer demand for unique and high-quality belt products, indicating a positive import momentum in the market.
Indonesia Custom Belts Market Synopsis
According to data from 6Wresearch, the custom belts market in Indonesia was estimated at $11 million US dollars in 2025. This represents a 5. 1% growth compared to 2025. The majority of this market is made up of small- and medium-sized enterprises that produce around 80% of total revenue for the industry. The remaining 20% comes mainly from large international companies like Gucci, Prada and Louis Vuitton that have opened stores in Indonesia in recent years.
Drivers of the Market
The custom belts market could be driven by fashion trends, personalization, and consumer preferences for unique accessories. As disposable income rises and fashion-consciousness grows, consumers might seek custom-designed belts as a form of self-expression.
Challenges of the Market
The Indonesia Custom Belts market offers personalization and fashion appeal. However, it faces challenges related to competition from mass-produced belts, fluctuating consumer trends, and economic uncertainties affecting discretionary spending. Maintaining a balance between offering unique designs and controlling production costs while ensuring product durability and quality is a persistent challenge.
COVID-19 Impact on the Market
The Indonesia Custom Belts market felt the effects of the COVID-19 pandemic as fashion trends and consumer preferences shifted. While traditional brick-and-mortar retail faced constraints, online platforms gained prominence for custom belt purchases. The market adapted by emphasizing personalized designs, online shopping experiences, and flexible sizing options to cater to changing consumer demands.
Key Highlights of the Report:
- Indonesia Custom Belts Market Outlook
- Market Size of Indonesia Custom Belts Market, 2025
- Forecast of Indonesia Custom Belts Market, 2032
- Historical Data and Forecast of Indonesia Custom Belts Revenues & Volume for the Period 2022-2032F
- Indonesia Custom Belts Market Trend Evolution
- Indonesia Custom Belts Market Drivers and Challenges
- Indonesia Custom Belts Price Trends
- Indonesia Custom Belts Porter's Five Forces
- Indonesia Custom Belts Industry Life Cycle
- Historical Data and Forecast of Indonesia Custom Belts Market Revenues & Volume By Type for the Period 2022-2032F
- Historical Data and Forecast of Indonesia Custom Belts Market Revenues & Volume By Cowhide for the Period 2022-2032F
- Historical Data and Forecast of Indonesia Custom Belts Market Revenues & Volume By Sheepskin for the Period 2022-2032F
- Historical Data and Forecast of Indonesia Custom Belts Market Revenues & Volume By Crocodile Skin for the Period 2022-2032F
- Historical Data and Forecast of Indonesia Custom Belts Market Revenues & Volume By Other for the Period 2022-2032F
- Historical Data and Forecast of Indonesia Custom Belts Market Revenues & Volume By Application for the Period 2022-2032F
- Historical Data and Forecast of Indonesia Custom Belts Market Revenues & Volume By Man for the Period 2022-2032F
- Historical Data and Forecast of Indonesia Custom Belts Market Revenues & Volume By Woman for the Period 2022-2032F
- Historical Data and Forecast of Indonesia Custom Belts Market Revenues & Volume By Children for the Period 2022-2032F
- Indonesia Custom Belts Import Export Trade Statistics
- Market Opportunity Assessment By Type
- Market Opportunity Assessment By Application
- Indonesia Custom Belts Top Companies Market Share
- Indonesia Custom Belts Competitive Benchmarking By Technical and Operational Parameters
- Indonesia Custom Belts Company Profiles
- Indonesia Custom Belts Key Strategic Recommendations
Indonesia Custom Belts Market (2026-2032): FAQs
6Wresearch actively monitors the Indonesia Custom Belts Market and publishes its comprehensive annual report, highlighting emerging trends, growth drivers, revenue analysis, and forecast outlook. Our insights help businesses to make data-backed strategic decisions with ongoing market dynamics. Our analysts track relevent industries related to the Indonesia Custom Belts Market, allowing our clients with actionable intelligence and reliable forecasts tailored to emerging regional needs.
Yes, we provide customisation as per your requirements. To learn more, feel free to contact us on sales@6wresearch.com
1 Executive Summary |
2 Introduction |
2.1 Key Highlights of the Report |
2.2 Report Description |
2.3 Market Scope & Segmentation |
2.4 Research Methodology |
2.5 Assumptions |
3 Indonesia Custom Belts Market Overview |
3.1 Indonesia Country Macro Economic Indicators |
3.2 Indonesia Custom Belts Market Revenues & Volume, 2022 & 2032F |
3.3 Indonesia Custom Belts Market - Industry Life Cycle |
3.4 Indonesia Custom Belts Market - Porter's Five Forces |
3.5 Indonesia Custom Belts Market Revenues & Volume Share, By Type, 2022 & 2032F |
3.6 Indonesia Custom Belts Market Revenues & Volume Share, By Application, 2022 & 2032F |
4 Indonesia Custom Belts Market Dynamics |
4.1 Impact Analysis |
4.2 Market Drivers |
4.2.1 Growing fashion consciousness among Indonesian consumers |
4.2.2 Increasing disposable income leading to higher spending on fashion accessories |
4.2.3 Rise in demand for personalized and unique products in the fashion industry |
4.3 Market Restraints |
4.3.1 Competition from mass-produced belts at lower price points |
4.3.2 Economic fluctuations impacting consumer purchasing power |
5 Indonesia Custom Belts Market Trends |
6 Indonesia Custom Belts Market, By Types |
6.1 Indonesia Custom Belts Market, By Type |
6.1.1 Overview and Analysis |
6.1.2 Indonesia Custom Belts Market Revenues & Volume, By Type, 2022-2032F |
6.1.3 Indonesia Custom Belts Market Revenues & Volume, By Cowhide, 2022-2032F |
6.1.4 Indonesia Custom Belts Market Revenues & Volume, By Sheepskin, 2022-2032F |
6.1.5 Indonesia Custom Belts Market Revenues & Volume, By Crocodile Skin, 2022-2032F |
6.1.6 Indonesia Custom Belts Market Revenues & Volume, By Other, 2022-2032F |
6.2 Indonesia Custom Belts Market, By Application |
6.2.1 Overview and Analysis |
6.2.2 Indonesia Custom Belts Market Revenues & Volume, By Man, 2022-2032F |
6.2.3 Indonesia Custom Belts Market Revenues & Volume, By Woman, 2022-2032F |
6.2.4 Indonesia Custom Belts Market Revenues & Volume, By Children, 2022-2032F |
7 Indonesia Custom Belts Market Import-Export Trade Statistics |
7.1 Indonesia Custom Belts Market Export to Major Countries |
7.2 Indonesia Custom Belts Market Imports from Major Countries |
8 Indonesia Custom Belts Market Key Performance Indicators |
8.1 Number of new custom belt designs introduced per quarter |
8.2 Percentage of repeat customers purchasing custom belts |
8.3 Average order value for custom belts sold |
9 Indonesia Custom Belts Market - Opportunity Assessment |
9.1 Indonesia Custom Belts Market Opportunity Assessment, By Type, 2022 & 2032F |
9.2 Indonesia Custom Belts Market Opportunity Assessment, By Application, 2022 & 2032F |
10 Indonesia Custom Belts Market - Competitive Landscape |
10.1 Indonesia Custom Belts Market Revenue Share, By Companies, 2025 |
10.2 Indonesia Custom Belts Market Competitive Benchmarking, By Operating and Technical Parameters |
11 Company Profiles |
12 Recommendations |
13 Disclaimer |
Global Go To Market Strategy - 2030
Export potential enables firms to identify high-growth global markets with greater confidence by combining advanced trade intelligence with a structured quantitative methodology. The framework analyzes emerging demand trends and country-level import patterns while integrating macroeconomic and trade datasets such as GDP and population forecasts, bilateral import–export flows, tariff structures, elasticity differentials between developed and developing economies, geographic distance, and import demand projections. Using weighted trade values from 2020–2024 as the base period to project country-to-country export potential for 2030, these inputs are operationalized through calculated drivers such as gravity model parameters, tariff impact factors, and projected GDP per-capita growth. Through an analysis of hidden potentials, demand hotspots, and market conditions that are most favorable to success, this method enables firms to focus on target countries, maximize returns, and global expansion with data, backed by accuracy.
By factoring in the projected importer demand gap that is currently unmet and could be potential opportunity, it identifies the potential for the Exporter (Country) among 190 countries, against the general trade analysis, which identifies the biggest importer or exporter.
To discover high-growth global markets and optimize your business strategy:
Click Here
Pricing
- Single User License$ 1,995
- Department License$ 2,400
- Site License$ 3,120
- Global License$ 3,795

Leadership Perspectives from Industry Events
Search
Thought Leadership and Analyst Meet


Our Clients
6WResearch In News
- India Air Conditioner Market Set for Strong Rebound in 2026 After Weather-Led Correction and GST-Driven Recovery: 6Wresearch
- ADAS in India: How Automatic Emergency Braking, Blind Spot Detection & Driver Monitoring are Transforming Road Safety
- Doha a strategic location for EV manufacturing hub: IPA Qatar
- Demand for luxury TVs surging in the GCC, says Samsung
- Empowering Growth: The Thriving Journey of Bangladesh’s Cable Industry
- Demand for luxury TVs surging in the GCC, says Samsung
Latest Reports
- Poland Fire Protection Systems Market (2026-2032)
- Cape Verde Portable Hand-Thrown Extinguisher Market (2026-2032)
- Canada Portable Hand-Thrown Extinguisher Market (2026-2032)
- Cameroon Portable Hand-Thrown Extinguisher Market (2026-2032)
- Burundi Portable Hand-Thrown Extinguisher Market (2026-2032)
- Burkina Faso Portable Hand-Thrown Extinguisher Market (2026-2032)
- Bulgaria Portable Hand-Thrown Extinguisher Market (2026-2032)
- Brunei Portable Hand-Thrown Extinguisher Market (2026-2032)
- Botswana Portable Hand-Thrown Extinguisher Market (2026-2032)
- Bosnia and Herzegovina Portable Hand-Thrown Extinguisher Market (2026-2032)
Industry Events and Analyst Meet

HIMTEX 2026

India Refining Summit 2026

India EV Show 2026

EV tech India Expo 2026

Auto Tech Asia 2026
Whitepaper
- Middle East & Africa Commercial Security Market Click here to view more.
- Middle East & Africa Fire Safety Systems & Equipment Market Click here to view more.
- GCC Drone Market Click here to view more.
- Middle East Lighting Fixture Market Click here to view more.
- GCC Physical & Perimeter Security Market Click here to view more.