Indonesia Cutting Wheels Market (2026-2032) Outlook | Trends, Forecast, Companies, Industry, Value, Size, Analysis, Revenue, Growth & Share
Market Forecast By Wheel Type (Straight Cutting Wheels, Depressed Center Cutting Wheels), By Disc Material (Cast Iron, Steel, Other Materials), By Abrasive Type (Aluminum Oxide, Silicon Carbide, Aluminum Zirconium, Seeded Gel, Diamond Cutting Wheels), By Grit Size (Coarse (8-24 CAMI Units), Medium (30-60), Fine (70-180), Very Fine (220-600)), By Application (Metal Cutting, Masonry, Ceramic Cutting, Notching), By End-use Industry (Transportation, Construction, Metal Working, Shipbuilding) And Competitive Landscape
| Product Code: ETC288988 | Publication Date: Aug 2022 | Updated Date: Mar 2026 | Product Type: Market Research Report | |
| Publisher: 6Wresearch | Author: Ravi Bhandari | No. of Pages: 75 | No. of Figures: 35 | No. of Tables: 20 |
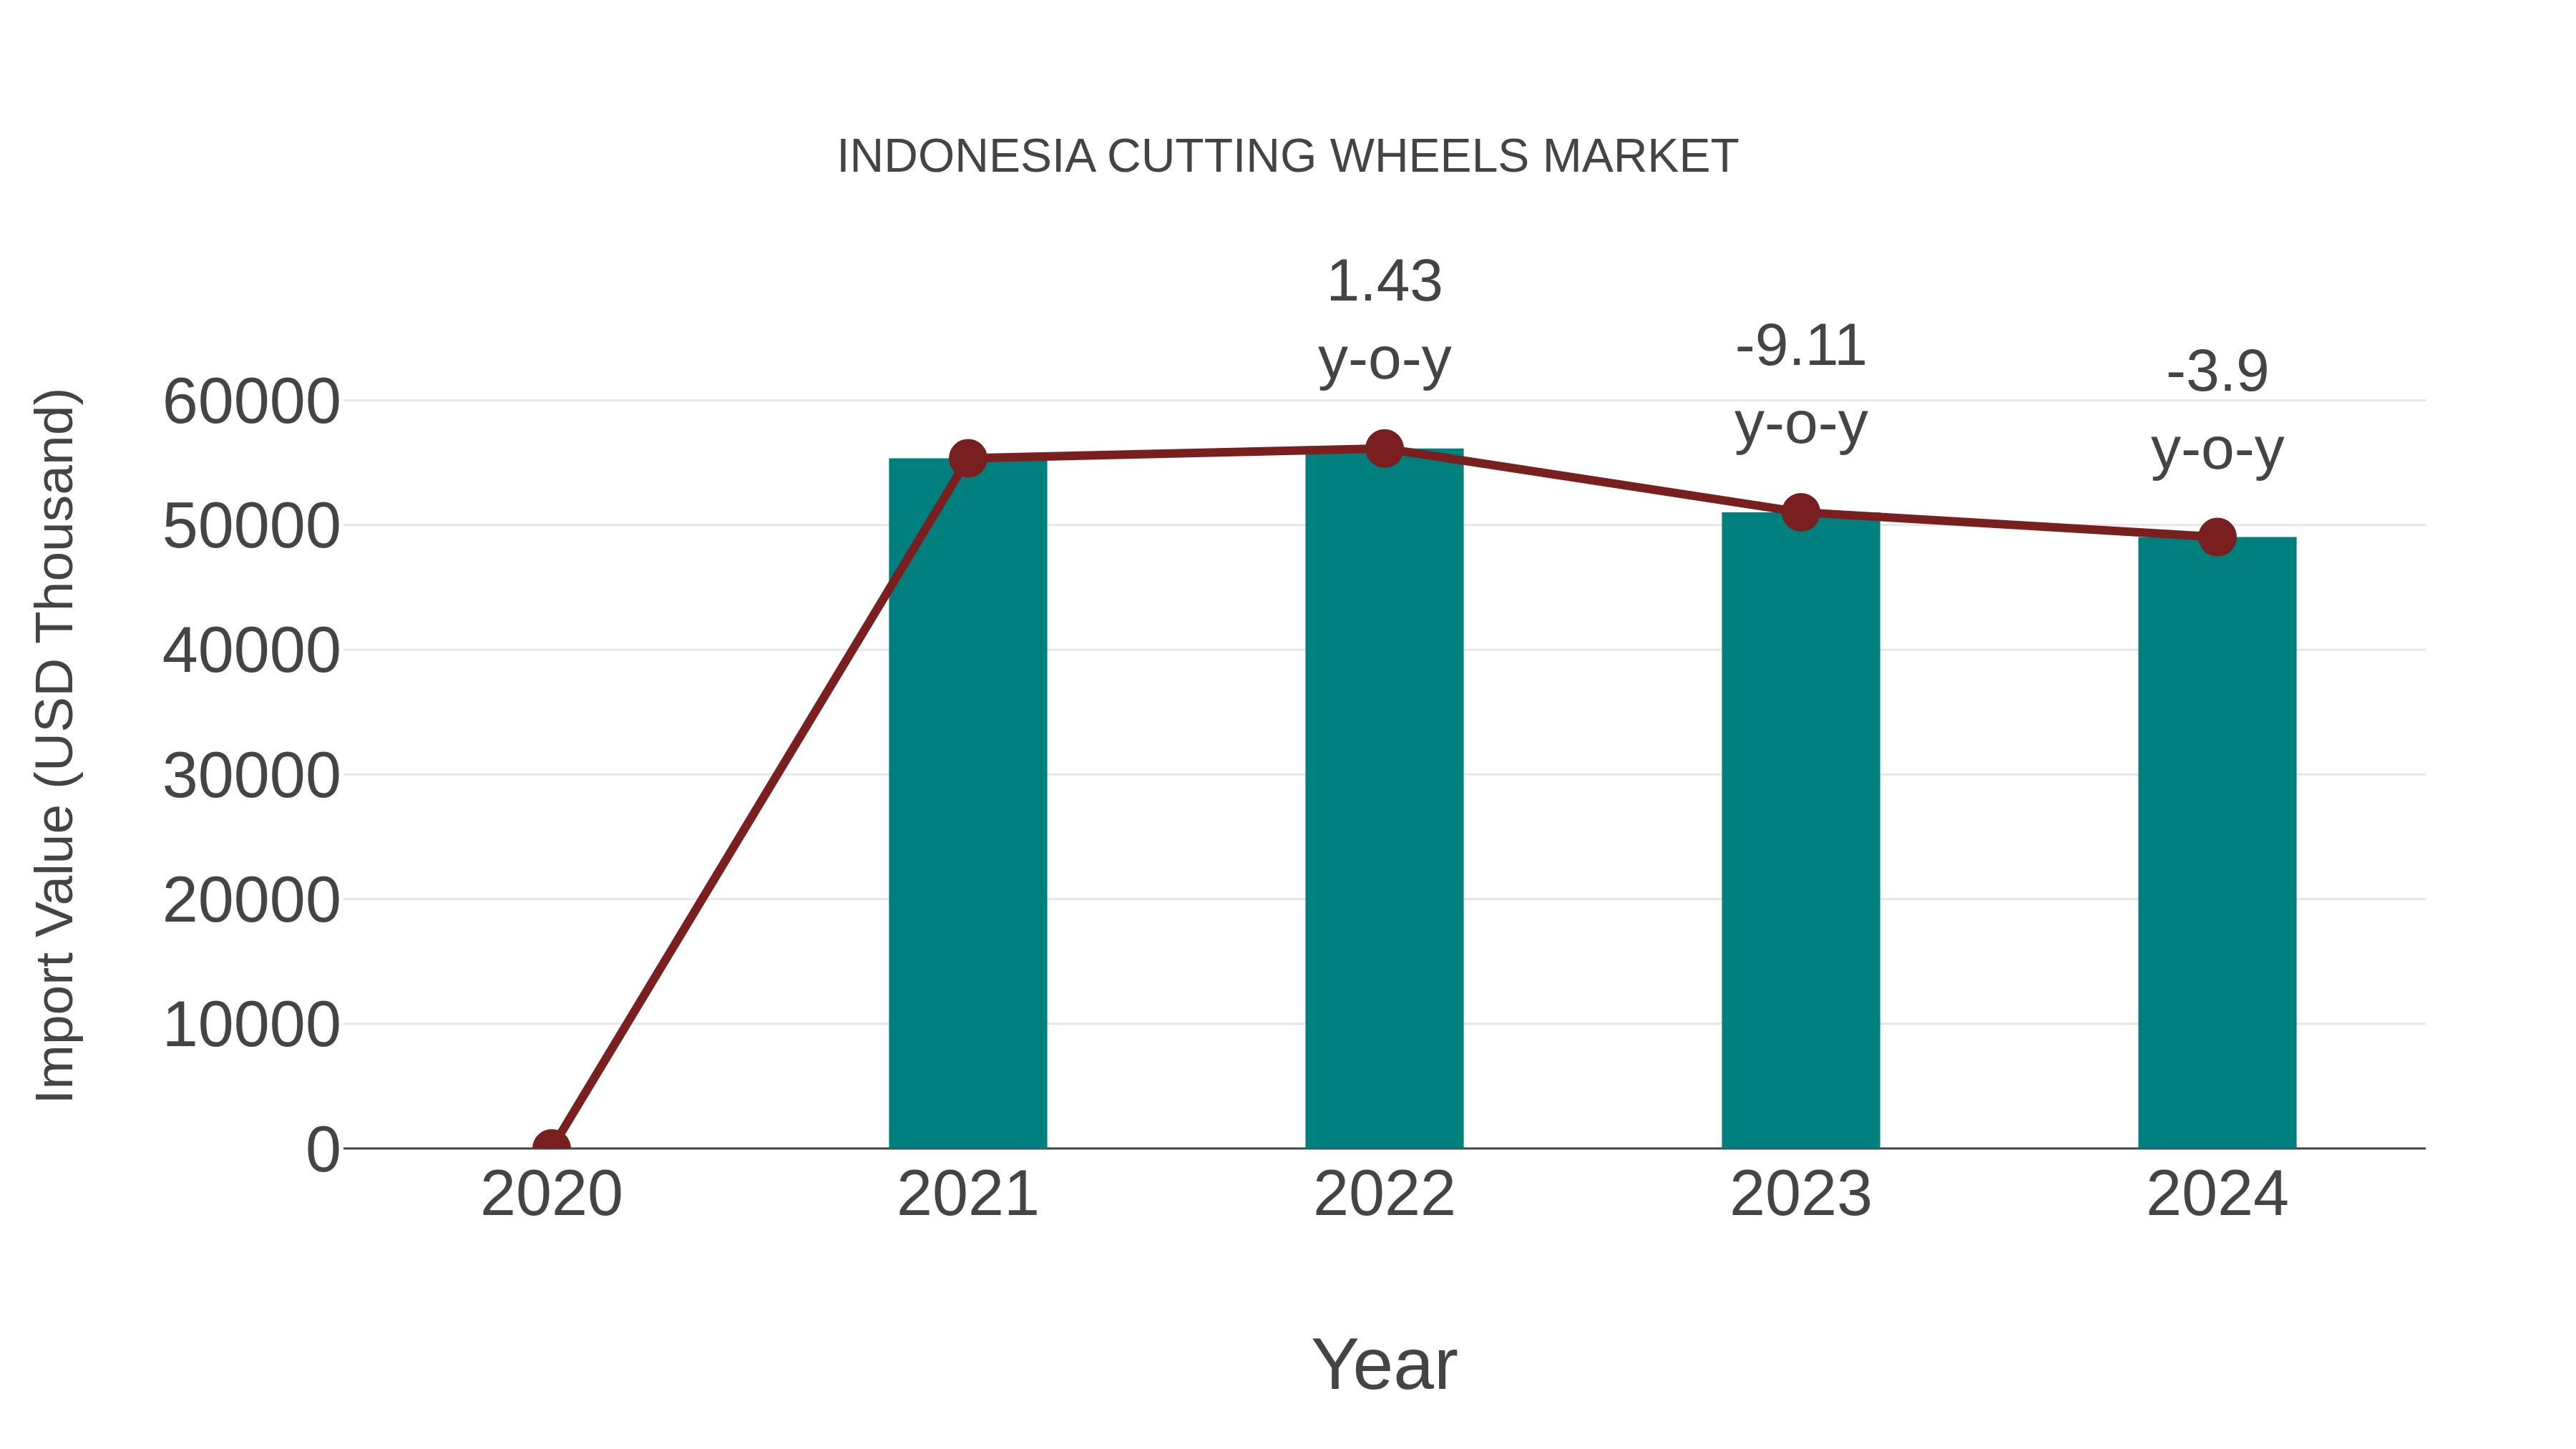
Indonesia Cutting Wheels Market: Import Trend Analysis
In the Indonesia cutting wheels market, the import trend showed a decline, with a growth rate of -3.9% from 2023 to 2024. The compound annual growth rate (CAGR) for 2020-2024 stood at -3.96%. This negative import momentum could be attributed to shifts in demand patterns or changes in trade policies impacting market stability.
Indonesia Cutting Wheels Market Synopsis
The cutting wheels market in Indonesia has grown considerably over the last few years. In 2018, it was valued at around US$ 127 million and is estimated to reach a value of US$ 290 million by 2025, registering a compound annual growth rate (CAGR) of 11.5% during the forecast period 2025-2031. The increasing demand for power tools such as angle grinders among end-users is driving the growth of this market.
Drivers of the Market
The cutting wheels market in Indonesia is likely to be driven by factors such as industrial growth, construction activities, and infrastructure development. As the manufacturing sector expands and construction projects increase, the demand for cutting wheels used in metalworking, fabrication, and construction processes is expected to rise.
Challenges of the Market
In the Indonesia cutting wheels market, there is potential for growth driven by industrial development and construction projects. The demand for cutting equipment is expected to rise as infrastructure projects expand, but the market may face challenges related to pricing pressures and competition from alternative cutting methods.
COVID-19 Impact on the Market
As lockdowns and restrictions were imposed, demand for cutting wheels decreased due to reduced construction activities and project postponements. However, as the situation gradually improved, the market witnessed a resurgence in demand driven by infrastructure development and construction projects aiming to stimulate economic recovery.
Key Players in the Market
Major players in the cutting wheels market include PT. Mitra Abrasive Mandiri, PT. YLI Industry, and PT. Saint Gobain Indonesia.
Key Highlights of the Report:
- Indonesia Cutting Wheels Market Outlook
- Market Size of Indonesia Cutting Wheels Market, 2025
- Forecast of Indonesia Cutting Wheels Market, 2032
- Historical Data and Forecast of Indonesia Cutting Wheels Revenues & Volume for the Period 2022-2032F
- Indonesia Cutting Wheels Market Trend Evolution
- Indonesia Cutting Wheels Market Drivers and Challenges
- Indonesia Cutting Wheels Price Trends
- Indonesia Cutting Wheels Porter's Five Forces
- Indonesia Cutting Wheels Industry Life Cycle
- Historical Data and Forecast of Indonesia Cutting Wheels Market Revenues & Volume By Wheel Type for the Period 2022-2032F
- Historical Data and Forecast of Indonesia Cutting Wheels Market Revenues & Volume By Straight Cutting Wheels for the Period 2022-2032F
- Historical Data and Forecast of Indonesia Cutting Wheels Market Revenues & Volume By Depressed Center Cutting Wheels for the Period 2022-2032F
- Historical Data and Forecast of Indonesia Cutting Wheels Market Revenues & Volume By Disc Material for the Period 2022-2032F
- Historical Data and Forecast of Indonesia Cutting Wheels Market Revenues & Volume By Cast Iron for the Period 2022-2032F
- Historical Data and Forecast of Indonesia Cutting Wheels Market Revenues & Volume By Steel for the Period 2022-2032F
- Historical Data and Forecast of Indonesia Cutting Wheels Market Revenues & Volume By Other Materials for the Period 2022-2032F
- Historical Data and Forecast of Indonesia Cutting Wheels Market Revenues & Volume By Abrasive Type for the Period 2022-2032F
- Historical Data and Forecast of Indonesia Cutting Wheels Market Revenues & Volume By Aluminum Oxide for the Period 2022-2032F
- Historical Data and Forecast of Indonesia Cutting Wheels Market Revenues & Volume By Silicon Carbide for the Period 2022-2032F
- Historical Data and Forecast of Indonesia Cutting Wheels Market Revenues & Volume By Aluminum Zirconium for the Period 2022-2032F
- Historical Data and Forecast of Indonesia Cutting Wheels Market Revenues & Volume By Seeded Gel for the Period 2022-2032F
- Historical Data and Forecast of Indonesia Cutting Wheels Market Revenues & Volume By Diamond Cutting Wheels for the Period 2022-2032F
- Historical Data and Forecast of Indonesia Cutting Wheels Market Revenues & Volume By Grit Size for the Period 2022-2032F
- Historical Data and Forecast of Indonesia Cutting Wheels Market Revenues & Volume By Coarse (8-24 CAMI Units) for the Period 2022-2032F
- Historical Data and Forecast of Indonesia Cutting Wheels Market Revenues & Volume By Medium (30-60) for the Period 2022-2032F
- Historical Data and Forecast of Indonesia Cutting Wheels Market Revenues & Volume By Fine (70-180) for the Period 2022-2032F
- Historical Data and Forecast of Indonesia Cutting Wheels Market Revenues & Volume By Very Fine (220-600) for the Period 2022-2032F
- Historical Data and Forecast of Indonesia Cutting Wheels Market Revenues & Volume By Application for the Period 2022-2032F
- Historical Data and Forecast of Indonesia Cutting Wheels Market Revenues & Volume By Metal Cutting for the Period 2022-2032F
- Historical Data and Forecast of Indonesia Cutting Wheels Market Revenues & Volume By Masonry for the Period 2022-2032F
- Historical Data and Forecast of Indonesia Cutting Wheels Market Revenues & Volume By Ceramic Cutting for the Period 2022-2032F
- Historical Data and Forecast of Indonesia Cutting Wheels Market Revenues & Volume By Notching for the Period 2022-2032F
- Historical Data and Forecast of Indonesia Cutting Wheels Market Revenues & Volume By End-use Industry for the Period 2022-2032F
- Historical Data and Forecast of Indonesia Cutting Wheels Market Revenues & Volume By Transportation for the Period 2022-2032F
- Historical Data and Forecast of Indonesia Cutting Wheels Market Revenues & Volume By Construction for the Period 2022-2032F
- Historical Data and Forecast of Indonesia Cutting Wheels Market Revenues & Volume By Metal Working for the Period 2022-2032F
- Historical Data and Forecast of Indonesia Cutting Wheels Market Revenues & Volume By Shipbuilding for the Period 2022-2032F
- Indonesia Cutting Wheels Import Export Trade Statistics
- Market Opportunity Assessment By Wheel Type
- Market Opportunity Assessment By Disc Material
- Market Opportunity Assessment By Abrasive Type
- Market Opportunity Assessment By Grit Size
- Market Opportunity Assessment By Application
- Market Opportunity Assessment By End-use Industry
- Indonesia Cutting Wheels Top Companies Market Share
- Indonesia Cutting Wheels Competitive Benchmarking By Technical and Operational Parameters
- Indonesia Cutting Wheels Company Profiles
- Indonesia Cutting Wheels Key Strategic Recommendations
Indonesia Cutting Wheels Market (2026-2032): FAQs
6Wresearch actively monitors the Indonesia Cutting Wheels Market and publishes its comprehensive annual report, highlighting emerging trends, growth drivers, revenue analysis, and forecast outlook. Our insights help businesses to make data-backed strategic decisions with ongoing market dynamics. Our analysts track relevent industries related to the Indonesia Cutting Wheels Market, allowing our clients with actionable intelligence and reliable forecasts tailored to emerging regional needs.
Yes, we provide customisation as per your requirements. To learn more, feel free to contact us on sales@6wresearch.com
1 Executive Summary |
2 Introduction |
2.1 Key Highlights of the Report |
2.2 Report Description |
2.3 Market Scope & Segmentation |
2.4 Research Methodology |
2.5 Assumptions |
3 Indonesia Cutting Wheels Market Overview |
3.1 Indonesia Country Macro Economic Indicators |
3.2 Indonesia Cutting Wheels Market Revenues & Volume, 2022 & 2032F |
3.3 Indonesia Cutting Wheels Market - Industry Life Cycle |
3.4 Indonesia Cutting Wheels Market - Porter's Five Forces |
3.5 Indonesia Cutting Wheels Market Revenues & Volume Share, By Wheel Type, 2022 & 2032F |
3.6 Indonesia Cutting Wheels Market Revenues & Volume Share, By Disc Material, 2022 & 2032F |
3.7 Indonesia Cutting Wheels Market Revenues & Volume Share, By Abrasive Type, 2022 & 2032F |
3.8 Indonesia Cutting Wheels Market Revenues & Volume Share, By Grit Size , 2022 & 2032F |
3.9 Indonesia Cutting Wheels Market Revenues & Volume Share, By Application, 2022 & 2032F |
3.10 Indonesia Cutting Wheels Market Revenues & Volume Share, By End-use Industry, 2022 & 2032F |
4 Indonesia Cutting Wheels Market Dynamics |
4.1 Impact Analysis |
4.2 Market Drivers |
4.2.1 Growth in the construction industry in Indonesia leading to increased demand for cutting wheels. |
4.2.2 Expansion of manufacturing sector in the country driving the usage of cutting wheels. |
4.2.3 Increase in infrastructure projects in Indonesia boosting the market for cutting wheels. |
4.3 Market Restraints |
4.3.1 Fluctuations in raw material prices affecting the production costs of cutting wheels. |
4.3.2 Intense competition among cutting wheel manufacturers leading to price wars. |
4.3.3 Stringent government regulations pertaining to safety standards impacting the market. |
5 Indonesia Cutting Wheels Market Trends |
6 Indonesia Cutting Wheels Market, By Types |
6.1 Indonesia Cutting Wheels Market, By Wheel Type |
6.1.1 Overview and Analysis |
6.1.2 Indonesia Cutting Wheels Market Revenues & Volume, By Wheel Type, 2022-2032F |
6.1.3 Indonesia Cutting Wheels Market Revenues & Volume, By Straight Cutting Wheels, 2022-2032F |
6.1.4 Indonesia Cutting Wheels Market Revenues & Volume, By Depressed Center Cutting Wheels, 2022-2032F |
6.2 Indonesia Cutting Wheels Market, By Disc Material |
6.2.1 Overview and Analysis |
6.2.2 Indonesia Cutting Wheels Market Revenues & Volume, By Cast Iron, 2022-2032F |
6.2.3 Indonesia Cutting Wheels Market Revenues & Volume, By Steel, 2022-2032F |
6.2.4 Indonesia Cutting Wheels Market Revenues & Volume, By Other Materials, 2022-2032F |
6.3 Indonesia Cutting Wheels Market, By Abrasive Type |
6.3.1 Overview and Analysis |
6.3.2 Indonesia Cutting Wheels Market Revenues & Volume, By Aluminum Oxide, 2022-2032F |
6.3.3 Indonesia Cutting Wheels Market Revenues & Volume, By Silicon Carbide, 2022-2032F |
6.3.4 Indonesia Cutting Wheels Market Revenues & Volume, By Aluminum Zirconium, 2022-2032F |
6.3.5 Indonesia Cutting Wheels Market Revenues & Volume, By Seeded Gel, 2022-2032F |
6.3.6 Indonesia Cutting Wheels Market Revenues & Volume, By Diamond Cutting Wheels, 2022-2032F |
6.4 Indonesia Cutting Wheels Market, By Grit Size |
6.4.1 Overview and Analysis |
6.4.2 Indonesia Cutting Wheels Market Revenues & Volume, By Coarse (8-24 CAMI Units), 2022-2032F |
6.4.3 Indonesia Cutting Wheels Market Revenues & Volume, By Medium (30-60), 2022-2032F |
6.4.4 Indonesia Cutting Wheels Market Revenues & Volume, By Fine (70-180), 2022-2032F |
6.4.5 Indonesia Cutting Wheels Market Revenues & Volume, By Very Fine (220-600), 2022-2032F |
6.5 Indonesia Cutting Wheels Market, By Application |
6.5.1 Overview and Analysis |
6.5.2 Indonesia Cutting Wheels Market Revenues & Volume, By Metal Cutting, 2022-2032F |
6.5.3 Indonesia Cutting Wheels Market Revenues & Volume, By Masonry, 2022-2032F |
6.5.4 Indonesia Cutting Wheels Market Revenues & Volume, By Ceramic Cutting, 2022-2032F |
6.5.5 Indonesia Cutting Wheels Market Revenues & Volume, By Notching, 2022-2032F |
6.6 Indonesia Cutting Wheels Market, By End-use Industry |
6.6.1 Overview and Analysis |
6.6.2 Indonesia Cutting Wheels Market Revenues & Volume, By Transportation, 2022-2032F |
6.6.3 Indonesia Cutting Wheels Market Revenues & Volume, By Construction, 2022-2032F |
6.6.4 Indonesia Cutting Wheels Market Revenues & Volume, By Metal Working, 2022-2032F |
6.6.5 Indonesia Cutting Wheels Market Revenues & Volume, By Shipbuilding, 2022-2032F |
7 Indonesia Cutting Wheels Market Import-Export Trade Statistics |
7.1 Indonesia Cutting Wheels Market Export to Major Countries |
7.2 Indonesia Cutting Wheels Market Imports from Major Countries |
8 Indonesia Cutting Wheels Market Key Performance Indicators |
8.1 Average selling price (ASP) of cutting wheels. |
8.2 Number of new product innovations in the cutting wheels market. |
8.3 Adoption rate of advanced cutting wheel technologies in Indonesia. |
9 Indonesia Cutting Wheels Market - Opportunity Assessment |
9.1 Indonesia Cutting Wheels Market Opportunity Assessment, By Wheel Type, 2022 & 2032F |
9.2 Indonesia Cutting Wheels Market Opportunity Assessment, By Disc Material, 2022 & 2032F |
9.3 Indonesia Cutting Wheels Market Opportunity Assessment, By Abrasive Type, 2022 & 2032F |
9.4 Indonesia Cutting Wheels Market Opportunity Assessment, By Grit Size , 2022 & 2032F |
9.5 Indonesia Cutting Wheels Market Opportunity Assessment, By Application, 2022 & 2032F |
9.6 Indonesia Cutting Wheels Market Opportunity Assessment, By End-use Industry, 2022 & 2032F |
10 Indonesia Cutting Wheels Market - Competitive Landscape |
10.1 Indonesia Cutting Wheels Market Revenue Share, By Companies, 2025 |
10.2 Indonesia Cutting Wheels Market Competitive Benchmarking, By Operating and Technical Parameters |
11 Company Profiles |
12 Recommendations |
13 Disclaimer |
Global Go To Market Strategy - 2030
Export potential enables firms to identify high-growth global markets with greater confidence by combining advanced trade intelligence with a structured quantitative methodology. The framework analyzes emerging demand trends and country-level import patterns while integrating macroeconomic and trade datasets such as GDP and population forecasts, bilateral import–export flows, tariff structures, elasticity differentials between developed and developing economies, geographic distance, and import demand projections. Using weighted trade values from 2020–2024 as the base period to project country-to-country export potential for 2030, these inputs are operationalized through calculated drivers such as gravity model parameters, tariff impact factors, and projected GDP per-capita growth. Through an analysis of hidden potentials, demand hotspots, and market conditions that are most favorable to success, this method enables firms to focus on target countries, maximize returns, and global expansion with data, backed by accuracy.
By factoring in the projected importer demand gap that is currently unmet and could be potential opportunity, it identifies the potential for the Exporter (Country) among 190 countries, against the general trade analysis, which identifies the biggest importer or exporter.
To discover high-growth global markets and optimize your business strategy:
Click Here
Pricing
- Single User License$ 1,995
- Department License$ 2,400
- Site License$ 3,120
- Global License$ 3,795

Leadership Perspectives from Industry Events
Search
Thought Leadership and Analyst Meet


Our Clients
6WResearch In News
- India Export Attractiveness Tracker 2026
- India Air Conditioner Market Set for Strong Rebound in 2026 After Weather-Led Correction and GST-Driven Recovery: 6Wresearch
- ADAS in India: How Automatic Emergency Braking, Blind Spot Detection & Driver Monitoring are Transforming Road Safety
- Doha a strategic location for EV manufacturing hub: IPA Qatar
- Demand for luxury TVs surging in the GCC, says Samsung
- Empowering Growth: The Thriving Journey of Bangladesh’s Cable Industry
Latest Reports
- Qatar Access and Home Network Market (2026-2032)
- Nicaragua RPG Gaming Market (2026-2032)
- New Zealand RPG Gaming Market (2026-2032)
- Netherlands RPG Gaming Market (2026-2032)
- Nauru RPG Gaming Market (2026-2032)
- Namibia RPG Gaming Market (2026-2032)
- Mozambique RPG Gaming Market (2026-2032)
- Montenegro RPG Gaming Market (2026-2032)
- Mongolia RPG Gaming Market (2026-2032)
- Monaco RPG Gaming Market (2026-2032)
Industry Events and Analyst Meet

EV India Expo 2026

HIMTEX 2026

India Refining Summit 2026

India EV Show 2026

EV tech India Expo 2026
Whitepaper
- Middle East & Africa Commercial Security Market Click here to view more.
- Middle East & Africa Fire Safety Systems & Equipment Market Click here to view more.
- GCC Drone Market Click here to view more.
- Middle East Lighting Fixture Market Click here to view more.
- GCC Physical & Perimeter Security Market Click here to view more.