Indonesia Detergents Market (2026-2032) Outlook | Size, Trends, Share, Revenue, Companies, Growth, Analysis, Industry, Forecast & Value
Market Forecast By Type (Anionic Detergents, Cationic Detergents, Non-ionic Detergents, Zwitterionic (Amphoteric) Detergents), By Application (Laundry Cleaning Products, Household Cleaning Products, Dishwashing Products, Fuel Additives, Biological Reagent, Other Applications) And Competitive Landscape
| Product Code: ETC220588 | Publication Date: Aug 2023 | Updated Date: Mar 2026 | Product Type: Market Research Report | |
| Publisher: 6Wresearch | Author: Ravi Bhandari | No. of Pages: 75 | No. of Figures: 35 | No. of Tables: 20 |
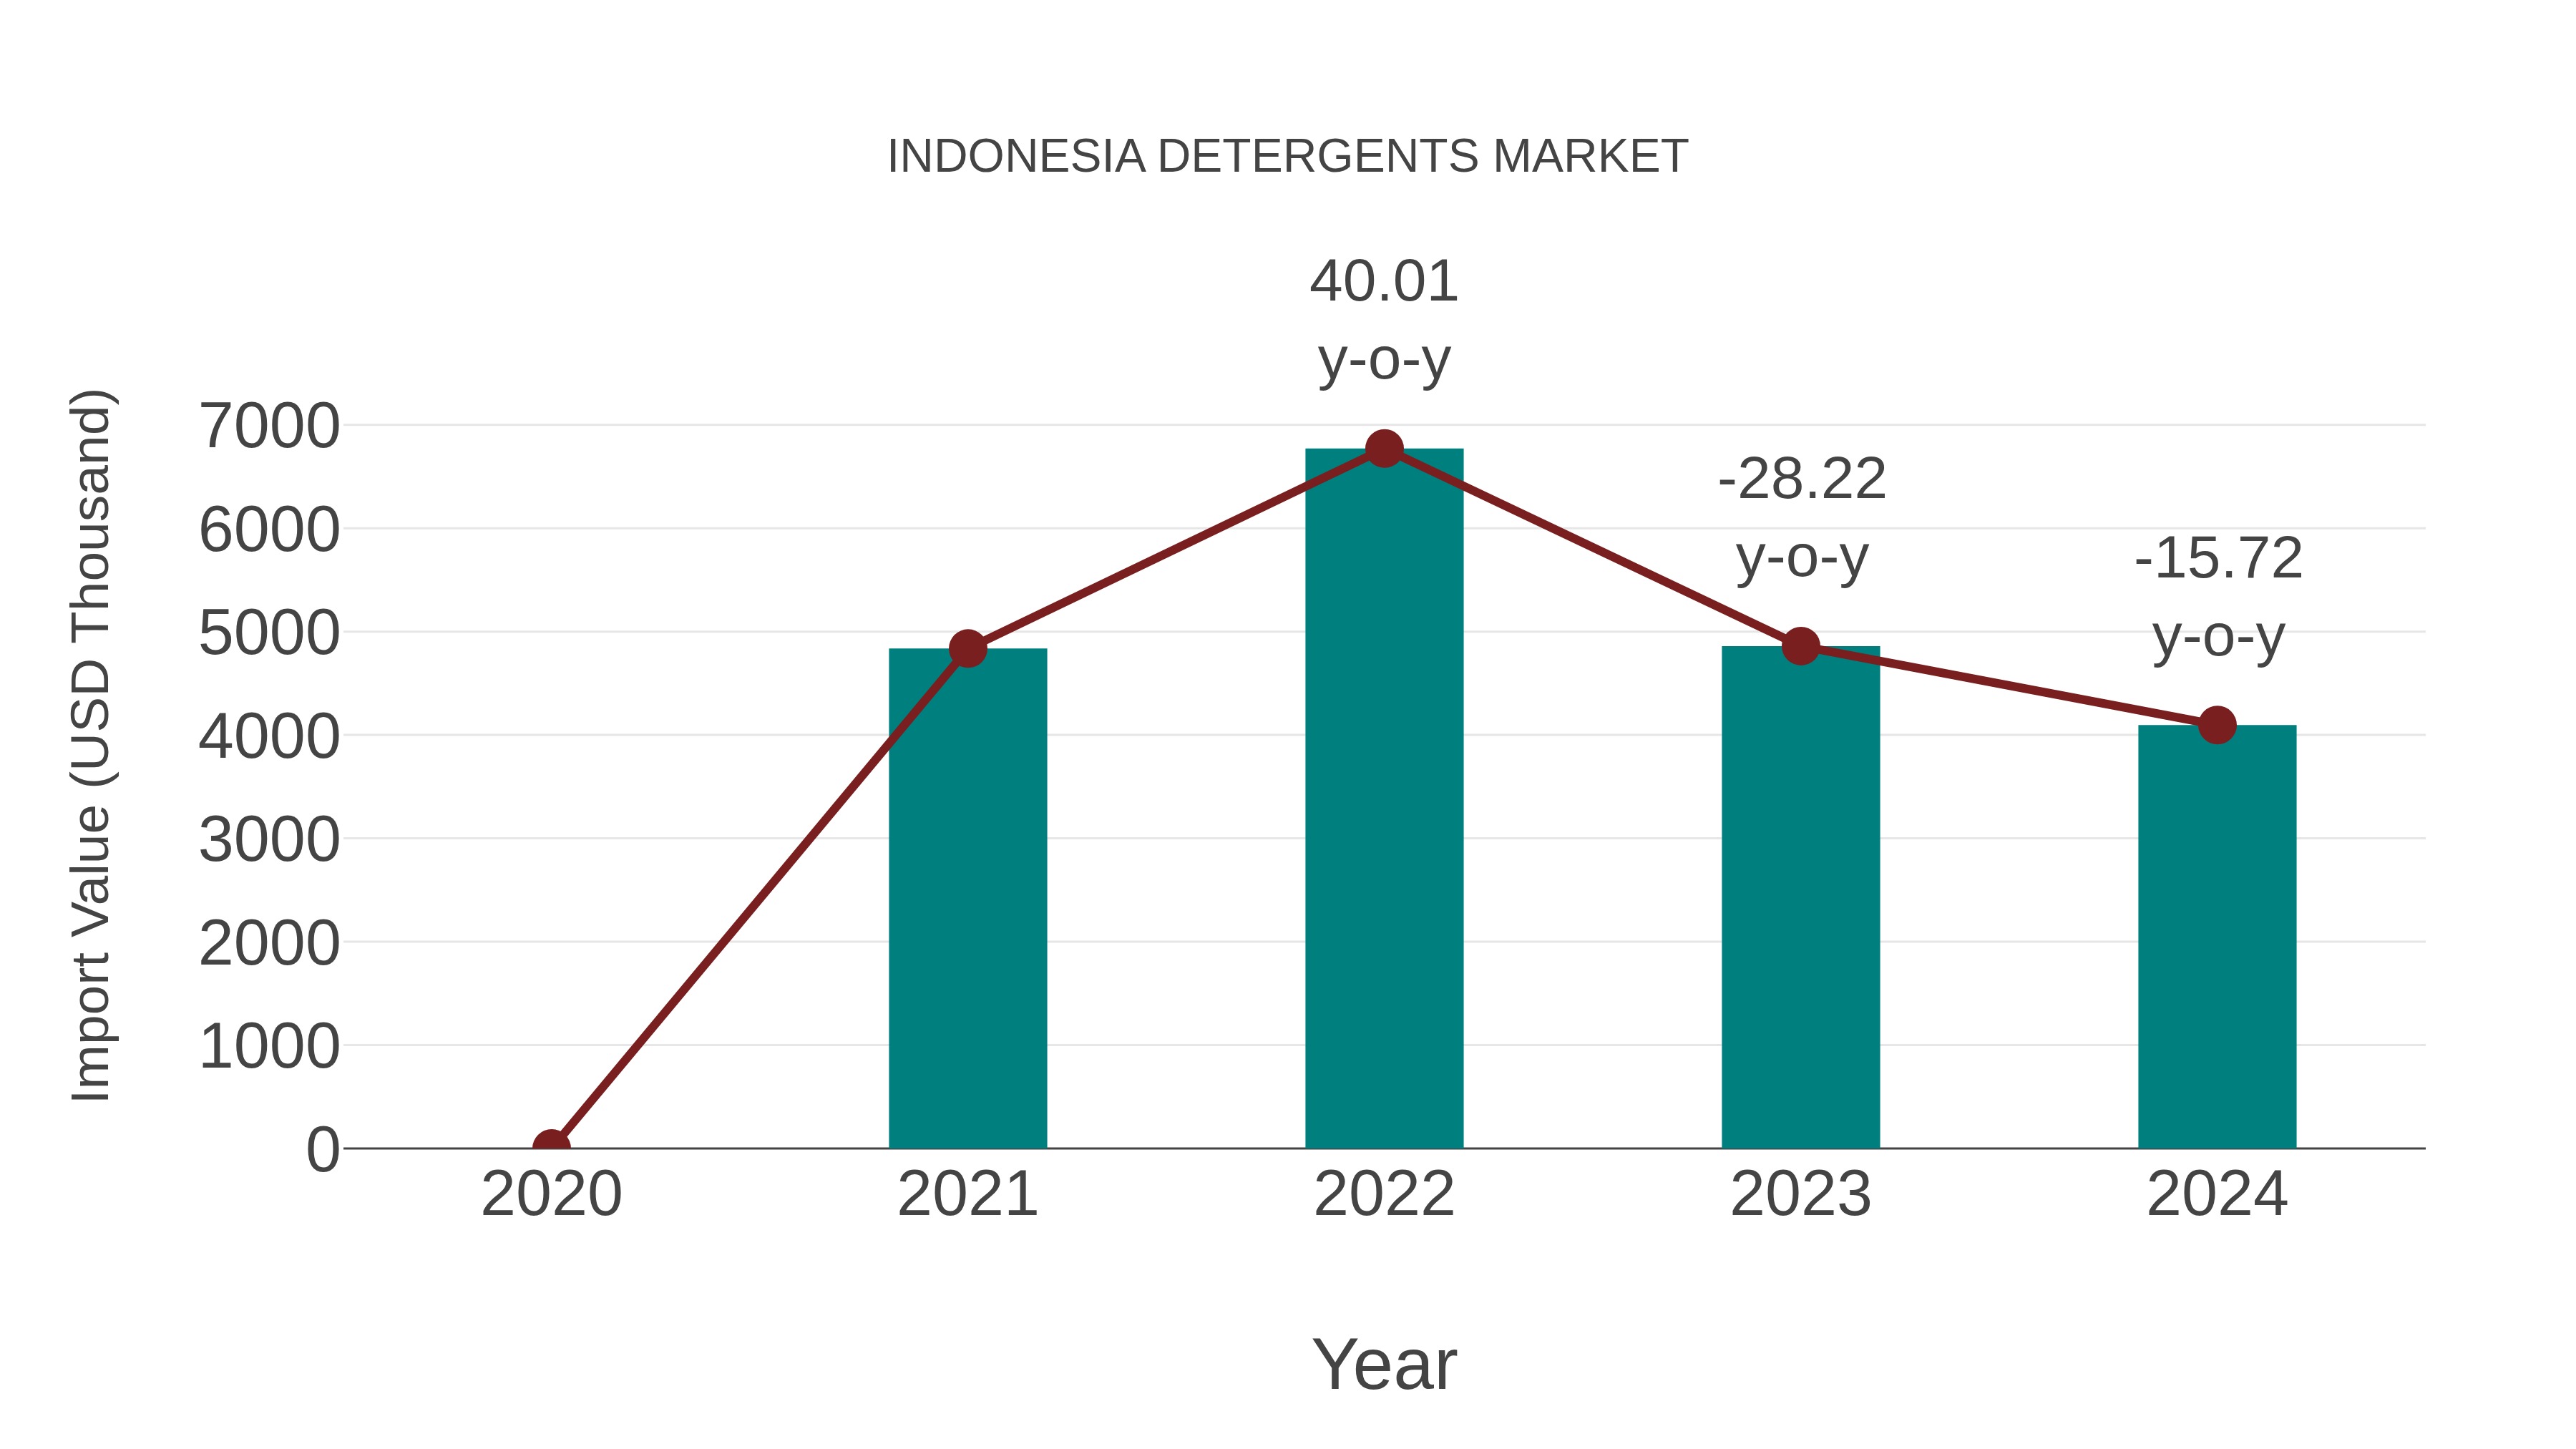
Indonesia Detergents Market: Import Trend Analysis
In the Indonesia detergents market, the import trend experienced a decline from 2023 to 2024, with a growth rate of -15.72%. The compound annual growth rate (CAGR) for imports in the period 2020-2024 stood at -5.39%. This decline may be attributed to shifts in consumer preferences or changes in trade policies impacting import volumes.
Indonesia Detergents Market Synopsis
In the household products sector, the Indonesia detergents market remains a robust and competitive industry. As urbanization and modern lifestyles continue to shape consumer preferences, the demand for detergents and cleaning products has increased.
Drivers of the Market
The detergents market in Indonesia is witnessing steady growth due to several key drivers. Firstly, the increasing awareness of hygiene and cleanliness among the population is a major factor. As disposable incomes rise and living standards improve, consumers are willing to spend on quality detergents to maintain cleanliness in their households. Secondly, the rapid urbanization and growth of the middle-class population have led to an increase in the number of households, creating a higher demand for detergents in the country. Moreover, the introduction of innovative and specialized detergents for various purposes, such as eco-friendly detergents and those designed for specific fabrics or surfaces, is driving market growth. Consumers are seeking detergents that not only clean effectively but also align with their environmental and fabric care concerns.
Challenges of the Market
The Indonesia Detergents Market faces challenges due to the presence of various alternative cleaning products and methods. With the growing interest in eco-friendly and sustainable solutions, consumers might opt for natural cleaning agents, which could affect the demand for traditional chemical detergents. Furthermore, competition among different detergent brands and manufacturers could lead to price wars and reduced profit margins.
COVID-19 Impact on the Market
The detergents market in Indonesia is substantial due to the country`s large population and urbanization. The market has experienced growth due to increasing hygiene awareness and the demand for laundry and cleaning products.
Key Highlights of the Report:
- Indonesia Detergents Market Outlook
- Market Size of Indonesia Detergents Market, 2025
- Forecast of Indonesia Detergents Market, 2032
- Historical Data and Forecast of Indonesia Detergents Revenues & Volume for the Period 2022-2032F
- Indonesia Detergents Market Trend Evolution
- Indonesia Detergents Market Drivers and Challenges
- Indonesia Detergents Price Trends
- Indonesia Detergents Porter's Five Forces
- Indonesia Detergents Industry Life Cycle
- Historical Data and Forecast of Indonesia Detergents Market Revenues & Volume By Type for the Period 2022-2032F
- Historical Data and Forecast of Indonesia Detergents Market Revenues & Volume By Anionic Detergents for the Period 2022-2032F
- Historical Data and Forecast of Indonesia Detergents Market Revenues & Volume By Cationic Detergents for the Period 2022-2032F
- Historical Data and Forecast of Indonesia Detergents Market Revenues & Volume By Non-ionic Detergents for the Period 2022-2032F
- Historical Data and Forecast of Indonesia Detergents Market Revenues & Volume By Zwitterionic (Amphoteric) Detergents for the Period 2022-2032F
- Historical Data and Forecast of Indonesia Detergents Market Revenues & Volume By Application for the Period 2022-2032F
- Historical Data and Forecast of Indonesia Detergents Market Revenues & Volume By Laundry Cleaning Products for the Period 2022-2032F
- Historical Data and Forecast of Indonesia Detergents Market Revenues & Volume By Household Cleaning Products for the Period 2022-2032F
- Historical Data and Forecast of Indonesia Detergents Market Revenues & Volume By Dishwashing Products for the Period 2022-2032F
- Historical Data and Forecast of Indonesia Detergents Market Revenues & Volume By Fuel Additives for the Period 2022-2032F
- Historical Data and Forecast of Indonesia Detergents Market Revenues & Volume By Biological Reagent for the Period 2022-2032F
- Historical Data and Forecast of Indonesia Detergents Market Revenues & Volume By Other Applications for the Period 2022-2032F
- Indonesia Detergents Import Export Trade Statistics
- Market Opportunity Assessment By Type
- Market Opportunity Assessment By Application
- Indonesia Detergents Top Companies Market Share
- Indonesia Detergents Competitive Benchmarking By Technical and Operational Parameters
- Indonesia Detergents Company Profiles
- Indonesia Detergents Key Strategic Recommendations
Indonesia Detergents Market (2026-2032): FAQs
6Wresearch actively monitors the Indonesia Detergents Market and publishes its comprehensive annual report, highlighting emerging trends, growth drivers, revenue analysis, and forecast outlook. Our insights help businesses to make data-backed strategic decisions with ongoing market dynamics. Our analysts track relevent industries related to the Indonesia Detergents Market, allowing our clients with actionable intelligence and reliable forecasts tailored to emerging regional needs.
Yes, we provide customisation as per your requirements. To learn more, feel free to contact us on sales@6wresearch.com
1 Executive Summary |
2 Introduction |
2.1 Key Highlights of the Report |
2.2 Report Description |
2.3 Market Scope & Segmentation |
2.4 Research Methodology |
2.5 Assumptions |
3 Indonesia Detergents Market Overview |
3.1 Indonesia Country Macro Economic Indicators |
3.2 Indonesia Detergents Market Revenues & Volume, 2022 & 2032F |
3.3 Indonesia Detergents Market - Industry Life Cycle |
3.4 Indonesia Detergents Market - Porter's Five Forces |
3.5 Indonesia Detergents Market Revenues & Volume Share, By Type, 2022 & 2032F |
3.6 Indonesia Detergents Market Revenues & Volume Share, By Application, 2022 & 2032F |
4 Indonesia Detergents Market Dynamics |
4.1 Impact Analysis |
4.2 Market Drivers |
4.2.1 Increasing awareness about personal hygiene and cleanliness. |
4.2.2 Growing urbanization leading to higher demand for household cleaning products. |
4.2.3 Rising disposable income, leading to higher spending on detergents. |
4.2.4 Innovation in product formulations and packaging. |
4.2.5 Government initiatives promoting cleanliness and hygiene. |
4.3 Market Restraints |
4.3.1 Price volatility of raw materials impacting production costs. |
4.3.2 Competition from alternative cleaning products such as eco-friendly detergents. |
4.3.3 Regulatory challenges and environmental concerns related to chemical ingredients. |
4.3.4 Economic downturn affecting consumer spending on non-essential goods. |
4.3.5 Distribution challenges in reaching remote or rural areas. |
5 Indonesia Detergents Market Trends |
6 Indonesia Detergents Market, By Types |
6.1 Indonesia Detergents Market, By Type |
6.1.1 Overview and Analysis |
6.1.2 Indonesia Detergents Market Revenues & Volume, By Type, 2022-2032F |
6.1.3 Indonesia Detergents Market Revenues & Volume, By Anionic Detergents, 2022-2032F |
6.1.4 Indonesia Detergents Market Revenues & Volume, By Cationic Detergents, 2022-2032F |
6.1.5 Indonesia Detergents Market Revenues & Volume, By Non-ionic Detergents, 2022-2032F |
6.1.6 Indonesia Detergents Market Revenues & Volume, By Zwitterionic (Amphoteric) Detergents, 2022-2032F |
6.2 Indonesia Detergents Market, By Application |
6.2.1 Overview and Analysis |
6.2.2 Indonesia Detergents Market Revenues & Volume, By Laundry Cleaning Products, 2022-2032F |
6.2.3 Indonesia Detergents Market Revenues & Volume, By Household Cleaning Products, 2022-2032F |
6.2.4 Indonesia Detergents Market Revenues & Volume, By Dishwashing Products, 2022-2032F |
6.2.5 Indonesia Detergents Market Revenues & Volume, By Fuel Additives, 2022-2032F |
6.2.6 Indonesia Detergents Market Revenues & Volume, By Biological Reagent, 2022-2032F |
6.2.7 Indonesia Detergents Market Revenues & Volume, By Other Applications, 2022-2032F |
7 Indonesia Detergents Market Import-Export Trade Statistics |
7.1 Indonesia Detergents Market Export to Major Countries |
7.2 Indonesia Detergents Market Imports from Major Countries |
8 Indonesia Detergents Market Key Performance Indicators |
8.1 Consumer satisfaction scores related to product effectiveness and fragrance. |
8.2 Market penetration in different regions or consumer segments. |
8.3 Customer retention rates and repeat purchase behavior. |
8.4 Adoption rates of new product formulations or packaging innovations. |
8.5 Environmental impact metrics such as carbon footprint reduction or use of sustainable ingredients. |
9 Indonesia Detergents Market - Opportunity Assessment |
9.1 Indonesia Detergents Market Opportunity Assessment, By Type, 2022 & 2032F |
9.2 Indonesia Detergents Market Opportunity Assessment, By Application, 2022 & 2032F |
10 Indonesia Detergents Market - Competitive Landscape |
10.1 Indonesia Detergents Market Revenue Share, By Companies, 2025 |
10.2 Indonesia Detergents Market Competitive Benchmarking, By Operating and Technical Parameters |
11 Company Profiles |
12 Recommendations |
13 Disclaimer |
Global Go To Market Strategy - 2030
Export potential enables firms to identify high-growth global markets with greater confidence by combining advanced trade intelligence with a structured quantitative methodology. The framework analyzes emerging demand trends and country-level import patterns while integrating macroeconomic and trade datasets such as GDP and population forecasts, bilateral import–export flows, tariff structures, elasticity differentials between developed and developing economies, geographic distance, and import demand projections. Using weighted trade values from 2020–2024 as the base period to project country-to-country export potential for 2030, these inputs are operationalized through calculated drivers such as gravity model parameters, tariff impact factors, and projected GDP per-capita growth. Through an analysis of hidden potentials, demand hotspots, and market conditions that are most favorable to success, this method enables firms to focus on target countries, maximize returns, and global expansion with data, backed by accuracy.
By factoring in the projected importer demand gap that is currently unmet and could be potential opportunity, it identifies the potential for the Exporter (Country) among 190 countries, against the general trade analysis, which identifies the biggest importer or exporter.
To discover high-growth global markets and optimize your business strategy:
Click Here
Pricing
- Single User License$ 1,995
- Department License$ 2,400
- Site License$ 3,120
- Global License$ 3,795

Leadership Perspectives from Industry Events
Search
Thought Leadership and Analyst Meet


Our Clients
6WResearch In News
- India Air Conditioner Market Set for Strong Rebound in 2026 After Weather-Led Correction and GST-Driven Recovery: 6Wresearch
- ADAS in India: How Automatic Emergency Braking, Blind Spot Detection & Driver Monitoring are Transforming Road Safety
- Doha a strategic location for EV manufacturing hub: IPA Qatar
- Demand for luxury TVs surging in the GCC, says Samsung
- Empowering Growth: The Thriving Journey of Bangladesh’s Cable Industry
- Demand for luxury TVs surging in the GCC, says Samsung
Latest Reports
- Poland Fire Protection Systems Market (2026-2032)
- Cape Verde Portable Hand-Thrown Extinguisher Market (2026-2032)
- Canada Portable Hand-Thrown Extinguisher Market (2026-2032)
- Cameroon Portable Hand-Thrown Extinguisher Market (2026-2032)
- Burundi Portable Hand-Thrown Extinguisher Market (2026-2032)
- Burkina Faso Portable Hand-Thrown Extinguisher Market (2026-2032)
- Bulgaria Portable Hand-Thrown Extinguisher Market (2026-2032)
- Brunei Portable Hand-Thrown Extinguisher Market (2026-2032)
- Botswana Portable Hand-Thrown Extinguisher Market (2026-2032)
- Bosnia and Herzegovina Portable Hand-Thrown Extinguisher Market (2026-2032)
Industry Events and Analyst Meet

HIMTEX 2026

India Refining Summit 2026

India EV Show 2026

EV tech India Expo 2026

Auto Tech Asia 2026
Whitepaper
- Middle East & Africa Commercial Security Market Click here to view more.
- Middle East & Africa Fire Safety Systems & Equipment Market Click here to view more.
- GCC Drone Market Click here to view more.
- Middle East Lighting Fixture Market Click here to view more.
- GCC Physical & Perimeter Security Market Click here to view more.