Indonesia Energy Saving & Fluorescent Market (2026-2032) | Forecast, Outlook, Industry, Size, Share, Revenue, Analysis, Trends, Value, Growth & Companies
Market Forecast By Sources (High-Intensity Discharge Lamps (HID), Linear Fluorescent Lamps (LFL), Light Emitting Diodes (LED)), By Applications (Commercial, Residential, Government) And Competitive Landscape
| Product Code: ETC005088 | Publication Date: Jul 2023 | Updated Date: Jun 2026 | Product Type: Report | |
| Publisher: 6Wresearch | Author: Ravi Bhandari | No. of Pages: 70 | No. of Figures: 35 | No. of Tables: 5 |
Indonesia Energy Saving & Fluorescent Market Summary
The indonesia energy saving & fluorescent market was estimated at USD 458 Million in 2025 and is projected to reach USD 608 Million by 2032, growing at a CAGR of 5.3% from 2026 to 2032.
Indonesia Energy Saving & Fluorescent Market Growth Rate Analysis (2021-2032)
The Indonesian energy saving and fluorescent market has exhibited a notable rebound after experiencing a slight decline of 0.4% in 2021. Driven by heightened consumer awareness around energy efficiency and government policies promoting sustainable practices, the market expanded by 4.6% in 2022 and further accelerated to 5.7% in 2023. This growth trajectory is underpinned by significant investments in infrastructure and technology to support the energy transition. As we move towards 2024, projections indicate a sustained growth rate of around 5.3%, reflecting increased demand for energy-efficient lighting solutions amid ongoing digitalization efforts. Fluctuations in growth rates beyond 2023 appear to stabilize around 5%, showing resilience in the face of evolving market dynamics.
Indonesia Energy Saving & Fluorescent Market Year-wise Growth Rate and Key Drivers
This graph highlights how the Indonesia Energy Saving & Fluorescent Market has steadily grown over the past five years, supported by major growth factors.
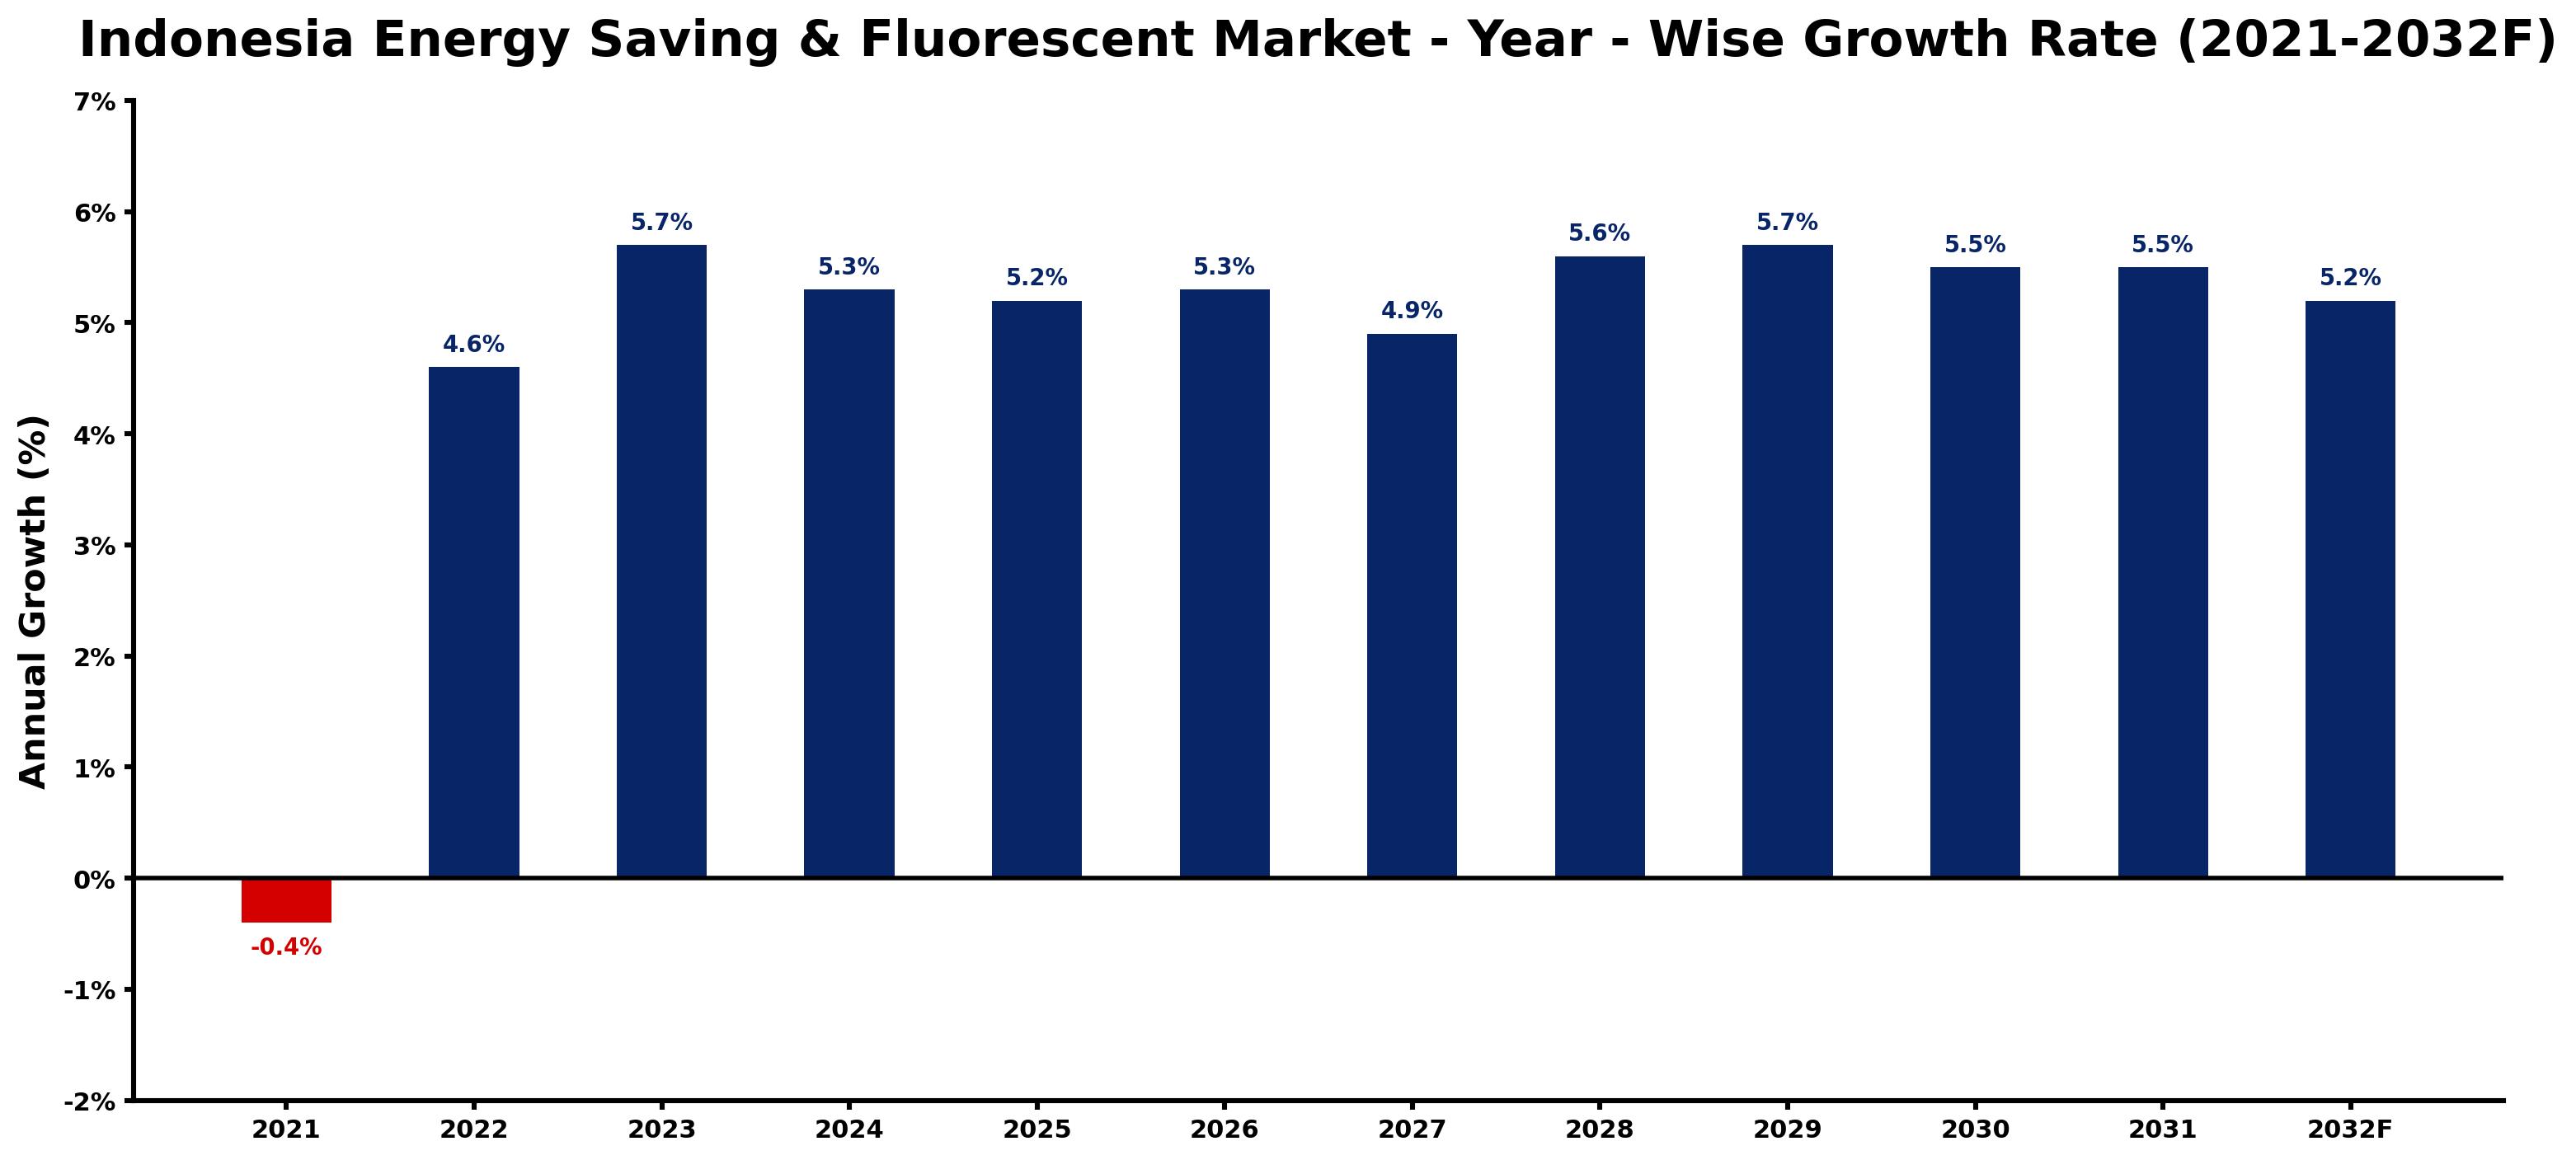
The table below presents the year wise growth rates along with the key drivers influencing the market
| Year | Growth Rate | Major Drivers |
| 2021 | -0.4% | Increased restrictions on traditional lighting technologies hindered market accessibility, stymieing growth prospects in Indonesia. |
| 2022 | 4.6% | Consumer interest in sustainability influences purchasing decisions across diverse demographics. |
| 2023 | 5.7% | Increased disposable income enables households to invest in energy saving solutions. |
| 2024 | 5.3% | Technological innovations enhance the performance of fluorescent lighting significantly. |
| 2025 | 5.2% | Retail expansion in cities promotes energy-efficient lighting options for businesses. |
| 2026 | 5.3% | Urbanization trends elevate the demand for sustainable energy solutions in metropolitan areas. |
| 2027 | 4.9% | Partnerships between manufacturers and retailers expand product reach and visibility. |
| 2028 | 5.6% | Rural electrification projects introduce energy-saving options to remote communities. |
| 2029 | 5.7% | Environmental awareness campaigns drive consumer preference towards eco-friendly lighting solutions. |
| 2030 | 5.5% | Smart home technology integration influences consumer purchasing behavior significantly. |
| 2031 | 5.5% | Competitive pricing strategies from manufacturers stimulate market consumption and growth. |
| 2032 | 5.2% | Global sustainability trends necessitate energy efficiency in local construction practices. |
Note - Market size estimations and growth projections presented in this report are based on 6Wresearch's advanced forecasting approach, validated with industry datasets as of June 2026.
Indonesia Energy Saving & Fluorescent Market Synopsis
The Indonesia Energy Saving Fluorescent Market is projected to reach 5.3% and witness significant growth during the forecast period (2026-2032). The market is characterized by an upward trajectory, fueled by the increasing adoption of energy-efficient technologies and a growing consumer awareness regarding sustainable lighting solutions. Several factors, including government initiatives aimed at promoting energy conservation and the widespread adoption of LED technology, are expected to play pivotal roles in shaping market dynamics.
Indonesia Energy Saving & Fluorescent Market Growth Drivers
The expansion of the Indonesia Energy Saving & Fluorescent Market can be attributed to several key drivers:
- The increasing adoption of LED lighting solutions stands out as a primary driver. With their high efficiency and low power consumption, LEDs represent a significant shift from traditional incandescent bulbs, offering savings of up to 80% in energy use. This transition is occurring across both commercial and residential sectors within Indonesia.
- Government initiatives toward energy conservation are crucial in driving demand. By implementing tax incentives and subsidies, the Indonesian government is actively promoting the use of energy-efficient fluorescent lamps. This approach encourages businesses and households to invest in eco-friendly lighting alternatives.
- Consumer awareness of energy-efficient lighting has risen dramatically, leading to increased demand for lighting solutions that not only reduce electricity bills but also contribute to environmental sustainability. Educational campaigns and public outreach initiatives have further enhanced this awareness.
- Regulatory policies mandating the use of eco-friendly lighting in new buildings have intensified market penetration. Such regulations support the transition to greener technologies and promote larger-scale adoption among consumers.
- Technological advancements continue to improve the efficiency of fluorescent and energy-saving lighting solutions. Innovations in design and materials ensure that these products not only perform better but are also more affordable for the average consumer.
Indonesia Energy Saving & Fluorescent Market Challenges and Restraints
Despite promising growth prospects, the Indonesia Energy Saving & Fluorescent Market faces several challenges that may impact widespread adoption:
- High initial investment costs represent a significant barrier. The advanced technology used in energy-efficient lighting often comes with a higher price tag compared to traditional options, which can deter budget-conscious consumers.
- There exists a lack of familiarity with new technologies among some segments of the population. This can lead to hesitance in adopting energy-saving lighting solutions, particularly in rural communities where traditional lighting is still prevalent.
- Market competition from low-cost, traditional lighting products may hinder the adoption of energy-saving alternatives. The affordability of conventional lighting can make it difficult for advanced solutions to gain a foothold in certain consumer demographics.
- Supply chain challenges can impede growth. Fluctuations in availability and prices of raw materials needed for energy-efficient lighting can affect production and ultimately impact market supply.
- Limited after-sales service and support for energy-efficient products can create challenges for consumers, limiting their overall satisfaction and willingness to invest in such solutions.
Indonesia Energy Saving & Fluorescent Market Government Investment and Initiatives
The Indonesian government has made significant strides to enhance the growth of the Energy Saving & Fluorescent Market. Key initiatives include:
- Implementation of tax incentives aimed at both manufacturers and consumers, which lowers the overall cost barrier associated with the purchase of energy-efficient lighting solutions.
- Promotion of public awareness campaigns that emphasize the importance of energy conservation and the advantages of energy-saving lighting solutions.
- Introduction of policies mandating eco-friendly lighting systems in new infrastructure projects, thereby ensuring that sustainable solutions are incorporated into future developments.
- Collaboration with international agencies to enhance funding and technological exchange, ultimately promoting the research and development of advanced lighting solutions.
- Establishment of vocational training programs aimed at equipping local technicians and engineers with the skills needed to support the energy-efficient lighting industry.
Indonesia Energy Saving & Fluorescent Market Latest Developments (May 2025 - June 2026)
Recent developments in the Indonesia Energy Saving & Fluorescent Market from May 2025 to June 2026 have emphasized a strong industry direction towards sustainability. Notable trends include increased partnerships between public entities and private companies to enhance the distribution of energy-efficient products. Furthermore, market participants are focusing on improving product accessibility through online platforms, thereby reaching wider customer bases. Research and development efforts are increasingly being directed towards the innovation of new technologies, with a focus on enhancing product longevity and performance. The ongoing rise in consumer demand for sustainable solutions is anticipated to foster further advancements and adaptations in product offerings.
Indonesia Energy Saving & Fluorescent Market - Key Attractiveness of the Report
- 10 Years of Market Numbers
- Historical Data Starting from 2022 to 2025
- Base Year: 2025
- Forecast Data until 2032
- Key Performance Indicators Impacting the Market
- Major Upcoming Developments and Projects
Key Highlights of the Report:
- Indonesia Energy Saving & Fluorescent Market Outlook
- Market Size of Indonesia Energy Saving & Fluorescent Market, 2025
- Forecast of Indonesia Energy Saving & Fluorescent Market, 2032
- Historical Data and Forecast of Indonesia Energy Saving & Fluorescent Revenues & Volume for the Period 2022-2032
- Indonesia Energy Saving & Fluorescent Market Trend Evolution
- Indonesia Energy Saving & Fluorescent Market Drivers and Challenges
- Indonesia Energy Saving & Fluorescent Price Trends
- Indonesia Energy Saving & Fluorescent Porter's Five Forces
- Indonesia Energy Saving & Fluorescent Industry Life Cycle
- Historical Data and Forecast of Indonesia Energy Saving & Fluorescent Market Revenues & Volume By Sources for the Period 2022-2032
- Historical Data and Forecast of Indonesia Energy Saving & Fluorescent Market Revenues & Volume By High-Intensity Discharge Lamps (HID) for the Period 2022-2032
- Historical Data and Forecast of Indonesia Energy Saving & Fluorescent Market Revenues & Volume By Linear Fluorescent Lamps (LFL) for the Period 2022-2032
- Historical Data and Forecast of Indonesia Energy Saving & Fluorescent Market Revenues & Volume By Light Emitting Diodes (LED) for the Period 2022-2032
- Historical Data and Forecast of Indonesia Energy Saving & Fluorescent Market Revenues & Volume By Applications for the Period 2022-2032
- Historical Data and Forecast of Indonesia Energy Saving & Fluorescent Market Revenues & Volume By Commercial for the Period 2022-2032
- Historical Data and Forecast of Indonesia Energy Saving & Fluorescent Market Revenues & Volume By Residential for the Period 2022-2032
- Historical Data and Forecast of Indonesia Energy Saving & Fluorescent Market Revenues & Volume By Government for the Period 2022-2032
- Indonesia Energy Saving & Fluorescent Import Export Trade Statistics
- Market Opportunity Assessment By Sources
- Market Opportunity Assessment By Applications
- Indonesia Energy Saving & Fluorescent Top Companies Market Share
- Indonesia Energy Saving & Fluorescent Competitive Benchmarking By Technical and Operational Parameters
- Indonesia Energy Saving & Fluorescent Company Profiles
- Indonesia Energy Saving & Fluorescent Key Strategic Recommendations
Frequently Asked Questions About the Market Study (FAQs):
The growth is primarily driven by the increasing adoption of LED lighting, government initiatives, and rising consumer awareness regarding energy-efficient solutions.
Key challenges include high initial investment costs, lack of familiarity with technology, and competition from traditional lighting solutions.
The government has introduced tax incentives, public awareness campaigns, and mandated eco-friendly lighting policies to foster market growth.
Future trends include technological innovations, enhanced distribution through online platforms, and an ongoing emphasis on sustainability in product development.
6Wresearch actively monitors the Indonesia Energy Saving & Fluorescent Market and publishes its comprehensive annual report, highlighting emerging trends, growth drivers, revenue analysis, and forecast outlook. Our insights help businesses to make data-backed strategic decisions with ongoing market dynamics. Our analysts track relevent industries related to the Indonesia Energy Saving & Fluorescent Market, allowing our clients with actionable intelligence and reliable forecasts tailored to emerging regional needs.
Yes, we provide customisation as per your requirements. To learn more, feel free to contact us on sales@6wresearch.com
| 1 Executive Summary |
| 2 Introduction |
| 2.1 Key Highlights of the Report |
| 2.2 Report Description |
| 2.3 Market Scope & Segmentation |
| 2.4 Research Methodology |
| 2.5 Assumptions |
| 3 Indonesia Energy Saving & Fluorescent Market Overview |
| 3.1 Indonesia Country Macro Economic Indicators |
| 3.2 Indonesia Energy Saving & Fluorescent Market Revenues & Volume, 2022 & 2032F |
| 3.3 Indonesia Energy Saving & Fluorescent Market - Industry Life Cycle |
| 3.4 Indonesia Energy Saving & Fluorescent Market - Porter's Five Forces |
| 3.5 Indonesia Energy Saving & Fluorescent Market Revenues & Volume Share, By Sources, 2022 & 2032F |
| 3.6 Indonesia Energy Saving & Fluorescent Market Revenues & Volume Share, By Applications, 2022 & 2032F |
| 4 Indonesia Energy Saving & Fluorescent Market Dynamics |
| 4.1 Impact Analysis |
| 4.2 Market Drivers |
| 4.3 Market Restraints |
| 5 Indonesia Energy Saving & Fluorescent Market Trends |
| 6 Indonesia Energy Saving & Fluorescent Market, By Types |
| 6.1 Indonesia Energy Saving & Fluorescent Market, By Sources |
| 6.1.1 Overview and Analysis |
| 6.1.2 Indonesia Energy Saving & Fluorescent Market Revenues & Volume, By Sources, 2022-2032F |
| 6.1.3 Indonesia Energy Saving & Fluorescent Market Revenues & Volume, By High-Intensity Discharge Lamps (HID), 2022-2032F |
| 6.1.4 Indonesia Energy Saving & Fluorescent Market Revenues & Volume, By Linear Fluorescent Lamps (LFL), 2022-2032F |
| 6.1.5 Indonesia Energy Saving & Fluorescent Market Revenues & Volume, By Light Emitting Diodes (LED), 2022-2032F |
| 6.2 Indonesia Energy Saving & Fluorescent Market, By Applications |
| 6.2.1 Overview and Analysis |
| 6.2.2 Indonesia Energy Saving & Fluorescent Market Revenues & Volume, By Commercial, 2022-2032F |
| 6.2.3 Indonesia Energy Saving & Fluorescent Market Revenues & Volume, By Residential, 2022-2032F |
| 6.2.4 Indonesia Energy Saving & Fluorescent Market Revenues & Volume, By Government, 2022-2032F |
| 7 Indonesia Energy Saving & Fluorescent Market Import-Export Trade Statistics |
| 7.1 Indonesia Energy Saving & Fluorescent Market Export to Major Countries |
| 7.2 Indonesia Energy Saving & Fluorescent Market Imports from Major Countries |
| 8 Indonesia Energy Saving & Fluorescent Market Key Performance Indicators |
| 9 Indonesia Energy Saving & Fluorescent Market - Opportunity Assessment |
| 9.1 Indonesia Energy Saving & Fluorescent Market Opportunity Assessment, By Sources, 2022 & 2032F |
| 9.2 Indonesia Energy Saving & Fluorescent Market Opportunity Assessment, By Applications, 2022 & 2032F |
| 10 Indonesia Energy Saving & Fluorescent Market - Competitive Landscape |
| 10.1 Indonesia Energy Saving & Fluorescent Market Revenue Share, By Companies, 2025 |
| 10.2 Indonesia Energy Saving & Fluorescent Market Competitive Benchmarking, By Operating and Technical Parameters |
| 11 Company Profiles |
| 12 Recommendations |
| 13 Disclaimer |
Global Go To Market Strategy - 2030
Export potential enables firms to identify high-growth global markets with greater confidence by combining advanced trade intelligence with a structured quantitative methodology. The framework analyzes emerging demand trends and country-level import patterns while integrating macroeconomic and trade datasets such as GDP and population forecasts, bilateral import–export flows, tariff structures, elasticity differentials between developed and developing economies, geographic distance, and import demand projections. Using weighted trade values from 2020–2024 as the base period to project country-to-country export potential for 2030, these inputs are operationalized through calculated drivers such as gravity model parameters, tariff impact factors, and projected GDP per-capita growth. Through an analysis of hidden potentials, demand hotspots, and market conditions that are most favorable to success, this method enables firms to focus on target countries, maximize returns, and global expansion with data, backed by accuracy.
By factoring in the projected importer demand gap that is currently unmet and could be potential opportunity, it identifies the potential for the Exporter (Country) among 190 countries, against the general trade analysis, which identifies the biggest importer or exporter.
To discover high-growth global markets and optimize your business strategy:
Click Here
Pricing
- Single User License$ 1,995
- Department License$ 2,400
- Site License$ 3,120
- Global License$ 3,795

Leadership Perspectives from Industry Events
Search
Thought Leadership and Analyst Meet


Our Clients
6WResearch In News
- India Air Conditioner Market Set for Strong Rebound in 2026 After Weather-Led Correction and GST-Driven Recovery: 6Wresearch
- ADAS in India: How Automatic Emergency Braking, Blind Spot Detection & Driver Monitoring are Transforming Road Safety
- Doha a strategic location for EV manufacturing hub: IPA Qatar
- Demand for luxury TVs surging in the GCC, says Samsung
- Empowering Growth: The Thriving Journey of Bangladesh’s Cable Industry
- Demand for luxury TVs surging in the GCC, says Samsung
Latest Reports
- Poland Fire Protection Systems Market (2026-2032)
- Cape Verde Portable Hand-Thrown Extinguisher Market (2026-2032)
- Canada Portable Hand-Thrown Extinguisher Market (2026-2032)
- Cameroon Portable Hand-Thrown Extinguisher Market (2026-2032)
- Burundi Portable Hand-Thrown Extinguisher Market (2026-2032)
- Burkina Faso Portable Hand-Thrown Extinguisher Market (2026-2032)
- Bulgaria Portable Hand-Thrown Extinguisher Market (2026-2032)
- Brunei Portable Hand-Thrown Extinguisher Market (2026-2032)
- Botswana Portable Hand-Thrown Extinguisher Market (2026-2032)
- Bosnia and Herzegovina Portable Hand-Thrown Extinguisher Market (2026-2032)
Industry Events and Analyst Meet

HIMTEX 2026

India Refining Summit 2026

India EV Show 2026

EV tech India Expo 2026

Auto Tech Asia 2026
Whitepaper
- Middle East & Africa Commercial Security Market Click here to view more.
- Middle East & Africa Fire Safety Systems & Equipment Market Click here to view more.
- GCC Drone Market Click here to view more.
- Middle East Lighting Fixture Market Click here to view more.
- GCC Physical & Perimeter Security Market Click here to view more.