Indonesia Fire Clay Market (2026-2032) Outlook | Forecast, Value, Companies, Analysis, Industry, Share, Trends, Growth, Size & Revenue
Market Forecast By Product (Flint, Semi-Flint, Semi-Plastic Fire, Plastic Fire), By Application (Fire Bricks, Utensils, Frances, Other), By End User (Residential, Commercial, Industrial, Others) And Competitive Landscape
| Product Code: ETC324988 | Publication Date: Aug 2022 | Updated Date: Mar 2026 | Product Type: Market Research Report | |
| Publisher: 6Wresearch | Author: Ravi Bhandari | No. of Pages: 75 | No. of Figures: 35 | No. of Tables: 20 |
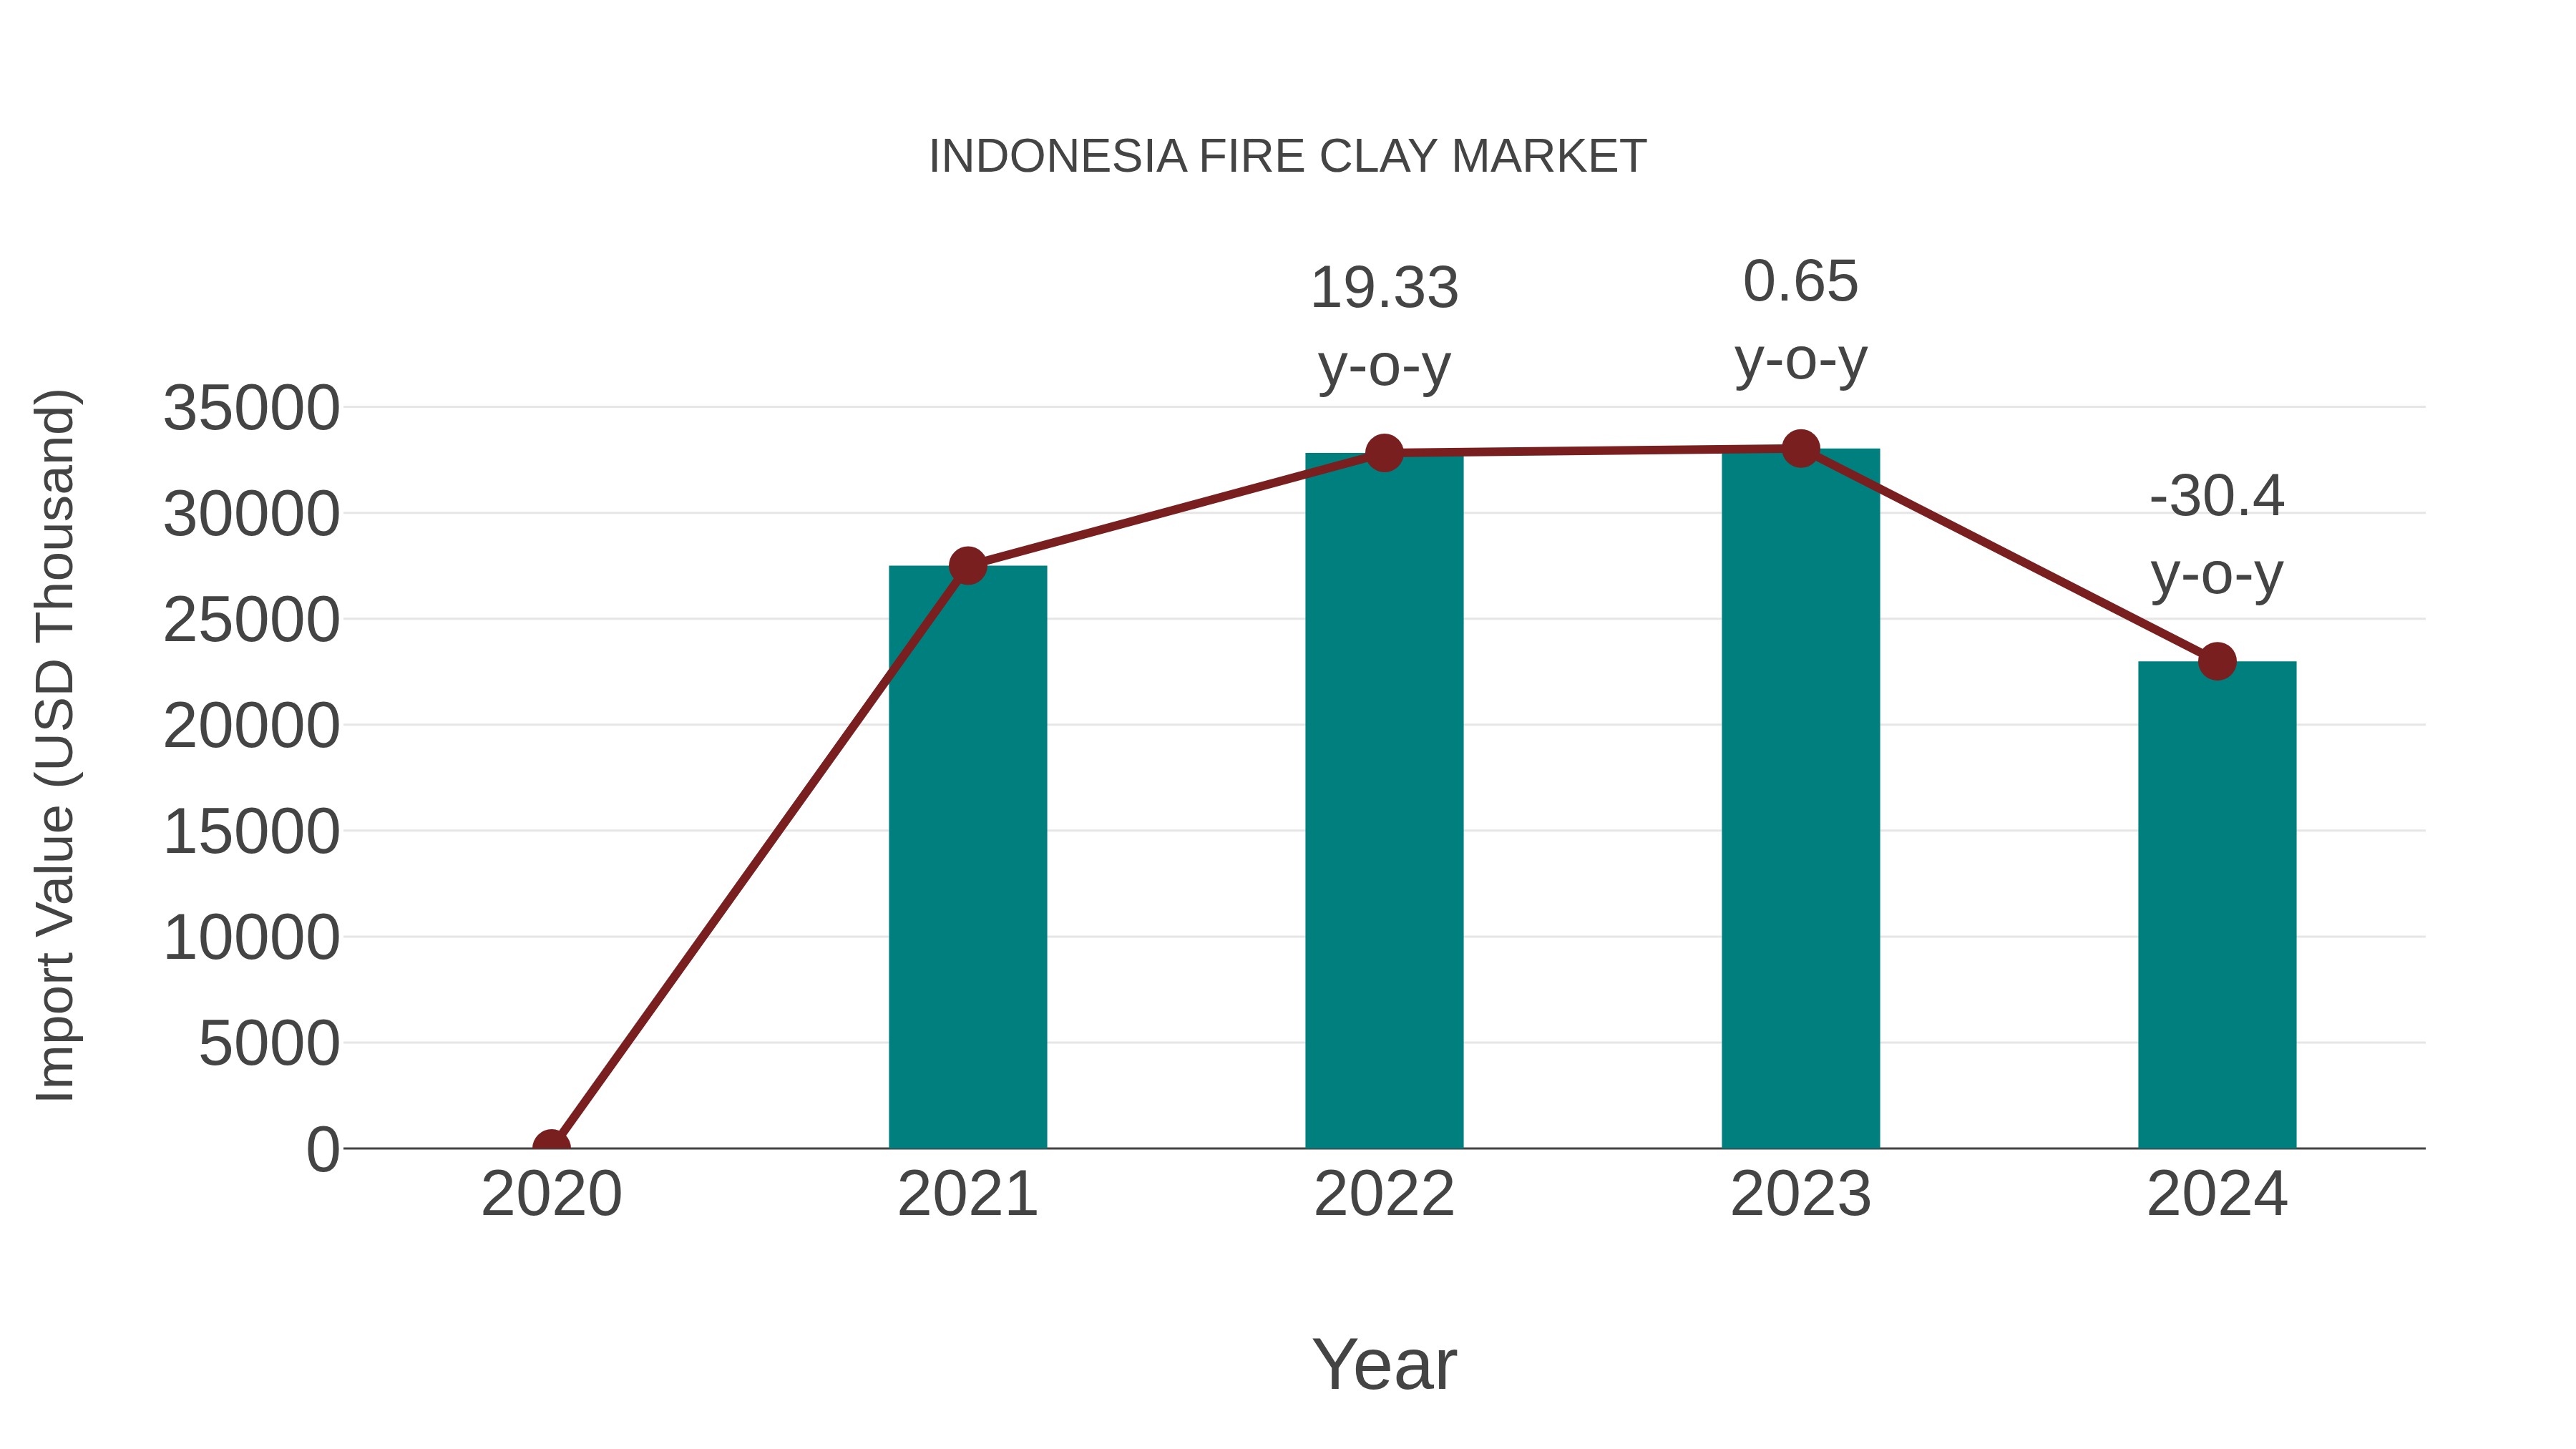
Indonesia Fire Clay Market: Import Trend Analysis
Indonesia`s import trend for the fire clay market experienced a notable decline in 2024, with a growth rate of -30.4% compared to the previous year. The compound annual growth rate (CAGR) for the period 2020-2024 stood at -5.8%. This downturn could be attributed to shifting demand dynamics or changes in trade policies impacting market stability.
Indonesia Fire Clay Market Synopsis
The fire clay market in Indonesia was valued at US$ 11 million in 2018 and is expected to register a CAGR of 7.1% during the forecast period owing to surging demand form refractory industry as well as construction activities across residential segment where these clays are extensively used on account of their features such as resistance against temperature variations along with excellent thermal properties making them ideal material suitable for lining furnaces around gas boilers or other heating appliances thereby driving its expansion over coming years. Additionally backfill insulation provided by these materials helps reduce energy costs while also finding application within pottery industry owing to it?s high degree of plasticity allowing molding into intricate shapes which makes it suitable for ceramics production thus propelling its sales over foreseeable future. Furthermore various government initiatives encouraging new constructions projects coupled with favorable tax policies implemented recently providing subsidies related to raw material purchasing will further act favorably towards promoting this business space.
Drivers of the Market
The Indonesia fire clay market is poised for growth due to the increasing demand for refractory materials in industries such as construction, metallurgy, and manufacturing. The robust expansion of these sectors, driven by infrastructure development and industrialization, fuels the need for fire-resistant materials like fire clay. Its exceptional thermal insulating properties and resistance to high temperatures make it an essential component in various applications, including furnace linings, kilns, and firebricks.
Challenges of the Market
The Indonesia Fire Clay market faces several challenges that have the potential to impact its growth and development. One key challenge is the fluctuating availability of high-quality fire clay reserves within the country. The inconsistent supply of suitable raw materials can lead to production disruptions and hinder the manufacturing of fire-resistant products. Additionally, the industry grapples with environmental concerns related to mining and processing fire clay, as these operations can have adverse effects on local ecosystems and communities.
COVID-19 Impact on the Market
The Indonesia Fire Clay market experienced disruptions due to the pandemic. Lockdowns, supply chain interruptions, and reduced construction activities impacted the demand for fire clay used in refractory applications. As construction projects were delayed or scaled back, the demand for fire clay products, such as bricks and tiles used in high-temperature environments, saw a decline. However, as economic activities gradually resumed and infrastructure projects restarted, the market began to show signs of recovery.
Key Players in the Market
In the Indonesia Fire Clay market, key players include established companies like PT Semen Indonesia (Persero) Tbk and PT Indoporlen, which are known for producing high-quality fire-resistant clay materials used in various industries such as construction and manufacturing.
Key Highlights of the Report:
- Indonesia Fire Clay Market Outlook
- Market Size of Indonesia Fire Clay Market, 2025
- Forecast of Indonesia Fire Clay Market, 2032
- Historical Data and Forecast of Indonesia Fire Clay Revenues & Volume for the Period 2022-2032F
- Indonesia Fire Clay Market Trend Evolution
- Indonesia Fire Clay Market Drivers and Challenges
- Indonesia Fire Clay Price Trends
- Indonesia Fire Clay Porter's Five Forces
- Indonesia Fire Clay Industry Life Cycle
- Historical Data and Forecast of Indonesia Fire Clay Market Revenues & Volume By Product for the Period 2022-2032F
- Historical Data and Forecast of Indonesia Fire Clay Market Revenues & Volume By Flint for the Period 2022-2032F
- Historical Data and Forecast of Indonesia Fire Clay Market Revenues & Volume By Semi-Flint for the Period 2022-2032F
- Historical Data and Forecast of Indonesia Fire Clay Market Revenues & Volume By Semi-Plastic Fire for the Period 2022-2032F
- Historical Data and Forecast of Indonesia Fire Clay Market Revenues & Volume By Plastic Fire for the Period 2022-2032F
- Historical Data and Forecast of Indonesia Fire Clay Market Revenues & Volume By Application for the Period 2022-2032F
- Historical Data and Forecast of Indonesia Fire Clay Market Revenues & Volume By Fire Bricks for the Period 2022-2032F
- Historical Data and Forecast of Indonesia Fire Clay Market Revenues & Volume By Utensils for the Period 2022-2032F
- Historical Data and Forecast of Indonesia Fire Clay Market Revenues & Volume By Frances for the Period 2022-2032F
- Historical Data and Forecast of Indonesia Fire Clay Market Revenues & Volume By Other for the Period 2022-2032F
- Historical Data and Forecast of Indonesia Fire Clay Market Revenues & Volume By End User for the Period 2022-2032F
- Historical Data and Forecast of Indonesia Fire Clay Market Revenues & Volume By Residential for the Period 2022-2032F
- Historical Data and Forecast of Indonesia Fire Clay Market Revenues & Volume By Commercial for the Period 2022-2032F
- Historical Data and Forecast of Indonesia Fire Clay Market Revenues & Volume By Industrial for the Period 2022-2032F
- Historical Data and Forecast of Indonesia Fire Clay Market Revenues & Volume By Others for the Period 2022-2032F
- Indonesia Fire Clay Import Export Trade Statistics
- Market Opportunity Assessment By Product
- Market Opportunity Assessment By Application
- Market Opportunity Assessment By End User
- Indonesia Fire Clay Top Companies Market Share
- Indonesia Fire Clay Competitive Benchmarking By Technical and Operational Parameters
- Indonesia Fire Clay Company Profiles
- Indonesia Fire Clay Key Strategic Recommendations
Indonesia Fire Clay Market (2026-2032): FAQs
6Wresearch actively monitors the Indonesia Fire Clay Market and publishes its comprehensive annual report, highlighting emerging trends, growth drivers, revenue analysis, and forecast outlook. Our insights help businesses to make data-backed strategic decisions with ongoing market dynamics. Our analysts track relevent industries related to the Indonesia Fire Clay Market, allowing our clients with actionable intelligence and reliable forecasts tailored to emerging regional needs.
Yes, we provide customisation as per your requirements. To learn more, feel free to contact us on sales@6wresearch.com
1 Executive Summary |
2 Introduction |
2.1 Key Highlights of the Report |
2.2 Report Description |
2.3 Market Scope & Segmentation |
2.4 Research Methodology |
2.5 Assumptions |
3 Indonesia Fire Clay Market Overview |
3.1 Indonesia Country Macro Economic Indicators |
3.2 Indonesia Fire Clay Market Revenues & Volume, 2022 & 2032F |
3.3 Indonesia Fire Clay Market - Industry Life Cycle |
3.4 Indonesia Fire Clay Market - Porter's Five Forces |
3.5 Indonesia Fire Clay Market Revenues & Volume Share, By Product, 2022 & 2032F |
3.6 Indonesia Fire Clay Market Revenues & Volume Share, By Application, 2022 & 2032F |
3.7 Indonesia Fire Clay Market Revenues & Volume Share, By End User, 2022 & 2032F |
4 Indonesia Fire Clay Market Dynamics |
4.1 Impact Analysis |
4.2 Market Drivers |
4.2.1 Increasing demand for fire clay in the construction industry for refractory applications. |
4.2.2 Growth in the manufacturing sector leading to higher demand for fire clay products. |
4.2.3 Rising focus on infrastructure development projects in Indonesia driving the demand for fire clay. |
4.3 Market Restraints |
4.3.1 Fluctuating prices of raw materials impacting the production costs of fire clay. |
4.3.2 Environmental regulations and concerns regarding the mining and processing of fire clay. |
4.3.3 Competition from alternative materials like alumina and silica affecting the market for fire clay. |
5 Indonesia Fire Clay Market Trends |
6 Indonesia Fire Clay Market, By Types |
6.1 Indonesia Fire Clay Market, By Product |
6.1.1 Overview and Analysis |
6.1.2 Indonesia Fire Clay Market Revenues & Volume, By Product, 2022-2032F |
6.1.3 Indonesia Fire Clay Market Revenues & Volume, By Flint, 2022-2032F |
6.1.4 Indonesia Fire Clay Market Revenues & Volume, By Semi-Flint, 2022-2032F |
6.1.5 Indonesia Fire Clay Market Revenues & Volume, By Semi-Plastic Fire, 2022-2032F |
6.1.6 Indonesia Fire Clay Market Revenues & Volume, By Plastic Fire, 2022-2032F |
6.2 Indonesia Fire Clay Market, By Application |
6.2.1 Overview and Analysis |
6.2.2 Indonesia Fire Clay Market Revenues & Volume, By Fire Bricks, 2022-2032F |
6.2.3 Indonesia Fire Clay Market Revenues & Volume, By Utensils, 2022-2032F |
6.2.4 Indonesia Fire Clay Market Revenues & Volume, By Frances, 2022-2032F |
6.2.5 Indonesia Fire Clay Market Revenues & Volume, By Other, 2022-2032F |
6.3 Indonesia Fire Clay Market, By End User |
6.3.1 Overview and Analysis |
6.3.2 Indonesia Fire Clay Market Revenues & Volume, By Residential, 2022-2032F |
6.3.3 Indonesia Fire Clay Market Revenues & Volume, By Commercial, 2022-2032F |
6.3.4 Indonesia Fire Clay Market Revenues & Volume, By Industrial, 2022-2032F |
6.3.5 Indonesia Fire Clay Market Revenues & Volume, By Others, 2022-2032F |
7 Indonesia Fire Clay Market Import-Export Trade Statistics |
7.1 Indonesia Fire Clay Market Export to Major Countries |
7.2 Indonesia Fire Clay Market Imports from Major Countries |
8 Indonesia Fire Clay Market Key Performance Indicators |
8.1 Average selling price of fire clay products. |
8.2 Number of infrastructure projects utilizing fire clay products. |
8.3 Percentage of market share of fire clay products in the refractory industry. |
8.4 Innovation rate in fire clay products development. |
8.5 Customer satisfaction levels with fire clay products. |
9 Indonesia Fire Clay Market - Opportunity Assessment |
9.1 Indonesia Fire Clay Market Opportunity Assessment, By Product, 2022 & 2032F |
9.2 Indonesia Fire Clay Market Opportunity Assessment, By Application, 2022 & 2032F |
9.3 Indonesia Fire Clay Market Opportunity Assessment, By End User, 2022 & 2032F |
10 Indonesia Fire Clay Market - Competitive Landscape |
10.1 Indonesia Fire Clay Market Revenue Share, By Companies, 2025 |
10.2 Indonesia Fire Clay Market Competitive Benchmarking, By Operating and Technical Parameters |
11 Company Profiles |
12 Recommendations |
13 Disclaimer |
Global Go To Market Strategy - 2030
Export potential enables firms to identify high-growth global markets with greater confidence by combining advanced trade intelligence with a structured quantitative methodology. The framework analyzes emerging demand trends and country-level import patterns while integrating macroeconomic and trade datasets such as GDP and population forecasts, bilateral import–export flows, tariff structures, elasticity differentials between developed and developing economies, geographic distance, and import demand projections. Using weighted trade values from 2020–2024 as the base period to project country-to-country export potential for 2030, these inputs are operationalized through calculated drivers such as gravity model parameters, tariff impact factors, and projected GDP per-capita growth. Through an analysis of hidden potentials, demand hotspots, and market conditions that are most favorable to success, this method enables firms to focus on target countries, maximize returns, and global expansion with data, backed by accuracy.
By factoring in the projected importer demand gap that is currently unmet and could be potential opportunity, it identifies the potential for the Exporter (Country) among 190 countries, against the general trade analysis, which identifies the biggest importer or exporter.
To discover high-growth global markets and optimize your business strategy:
Click Here
Pricing
- Single User License$ 1,995
- Department License$ 2,400
- Site License$ 3,120
- Global License$ 3,795

Leadership Perspectives from Industry Events
Search
Thought Leadership and Analyst Meet


Our Clients
6WResearch In News
- India Air Conditioner Market Set for Strong Rebound in 2026 After Weather-Led Correction and GST-Driven Recovery: 6Wresearch
- ADAS in India: How Automatic Emergency Braking, Blind Spot Detection & Driver Monitoring are Transforming Road Safety
- Doha a strategic location for EV manufacturing hub: IPA Qatar
- Demand for luxury TVs surging in the GCC, says Samsung
- Empowering Growth: The Thriving Journey of Bangladesh’s Cable Industry
- Demand for luxury TVs surging in the GCC, says Samsung
Latest Reports
- Poland Fire Protection Systems Market (2026-2032)
- Cape Verde Portable Hand-Thrown Extinguisher Market (2026-2032)
- Canada Portable Hand-Thrown Extinguisher Market (2026-2032)
- Cameroon Portable Hand-Thrown Extinguisher Market (2026-2032)
- Burundi Portable Hand-Thrown Extinguisher Market (2026-2032)
- Burkina Faso Portable Hand-Thrown Extinguisher Market (2026-2032)
- Bulgaria Portable Hand-Thrown Extinguisher Market (2026-2032)
- Brunei Portable Hand-Thrown Extinguisher Market (2026-2032)
- Botswana Portable Hand-Thrown Extinguisher Market (2026-2032)
- Bosnia and Herzegovina Portable Hand-Thrown Extinguisher Market (2026-2032)
Industry Events and Analyst Meet

HIMTEX 2026

India Refining Summit 2026

India EV Show 2026

EV tech India Expo 2026

Auto Tech Asia 2026
Whitepaper
- Middle East & Africa Commercial Security Market Click here to view more.
- Middle East & Africa Fire Safety Systems & Equipment Market Click here to view more.
- GCC Drone Market Click here to view more.
- Middle East Lighting Fixture Market Click here to view more.
- GCC Physical & Perimeter Security Market Click here to view more.