Indonesia Fish Market (2026-2032) Outlook | Trends, Forecast, Analysis, Size, Share, Value, Growth, Industry, Companies & Revenue
Market Forecast By Fish Type (Inland Fishes, Marine Fishes, Shrimps, Scampi), By Product Type (Fresh, Frozen, Canned, Others), By Distribution Channel (Retail, Institutional), By Sector (Organised, Unorganised) And Competitive Landscape
| Product Code: ETC292348 | Publication Date: Aug 2022 | Updated Date: Mar 2026 | Product Type: Market Research Report | |
| Publisher: 6Wresearch | Author: Ravi Bhandari | No. of Pages: 75 | No. of Figures: 35 | No. of Tables: 20 |
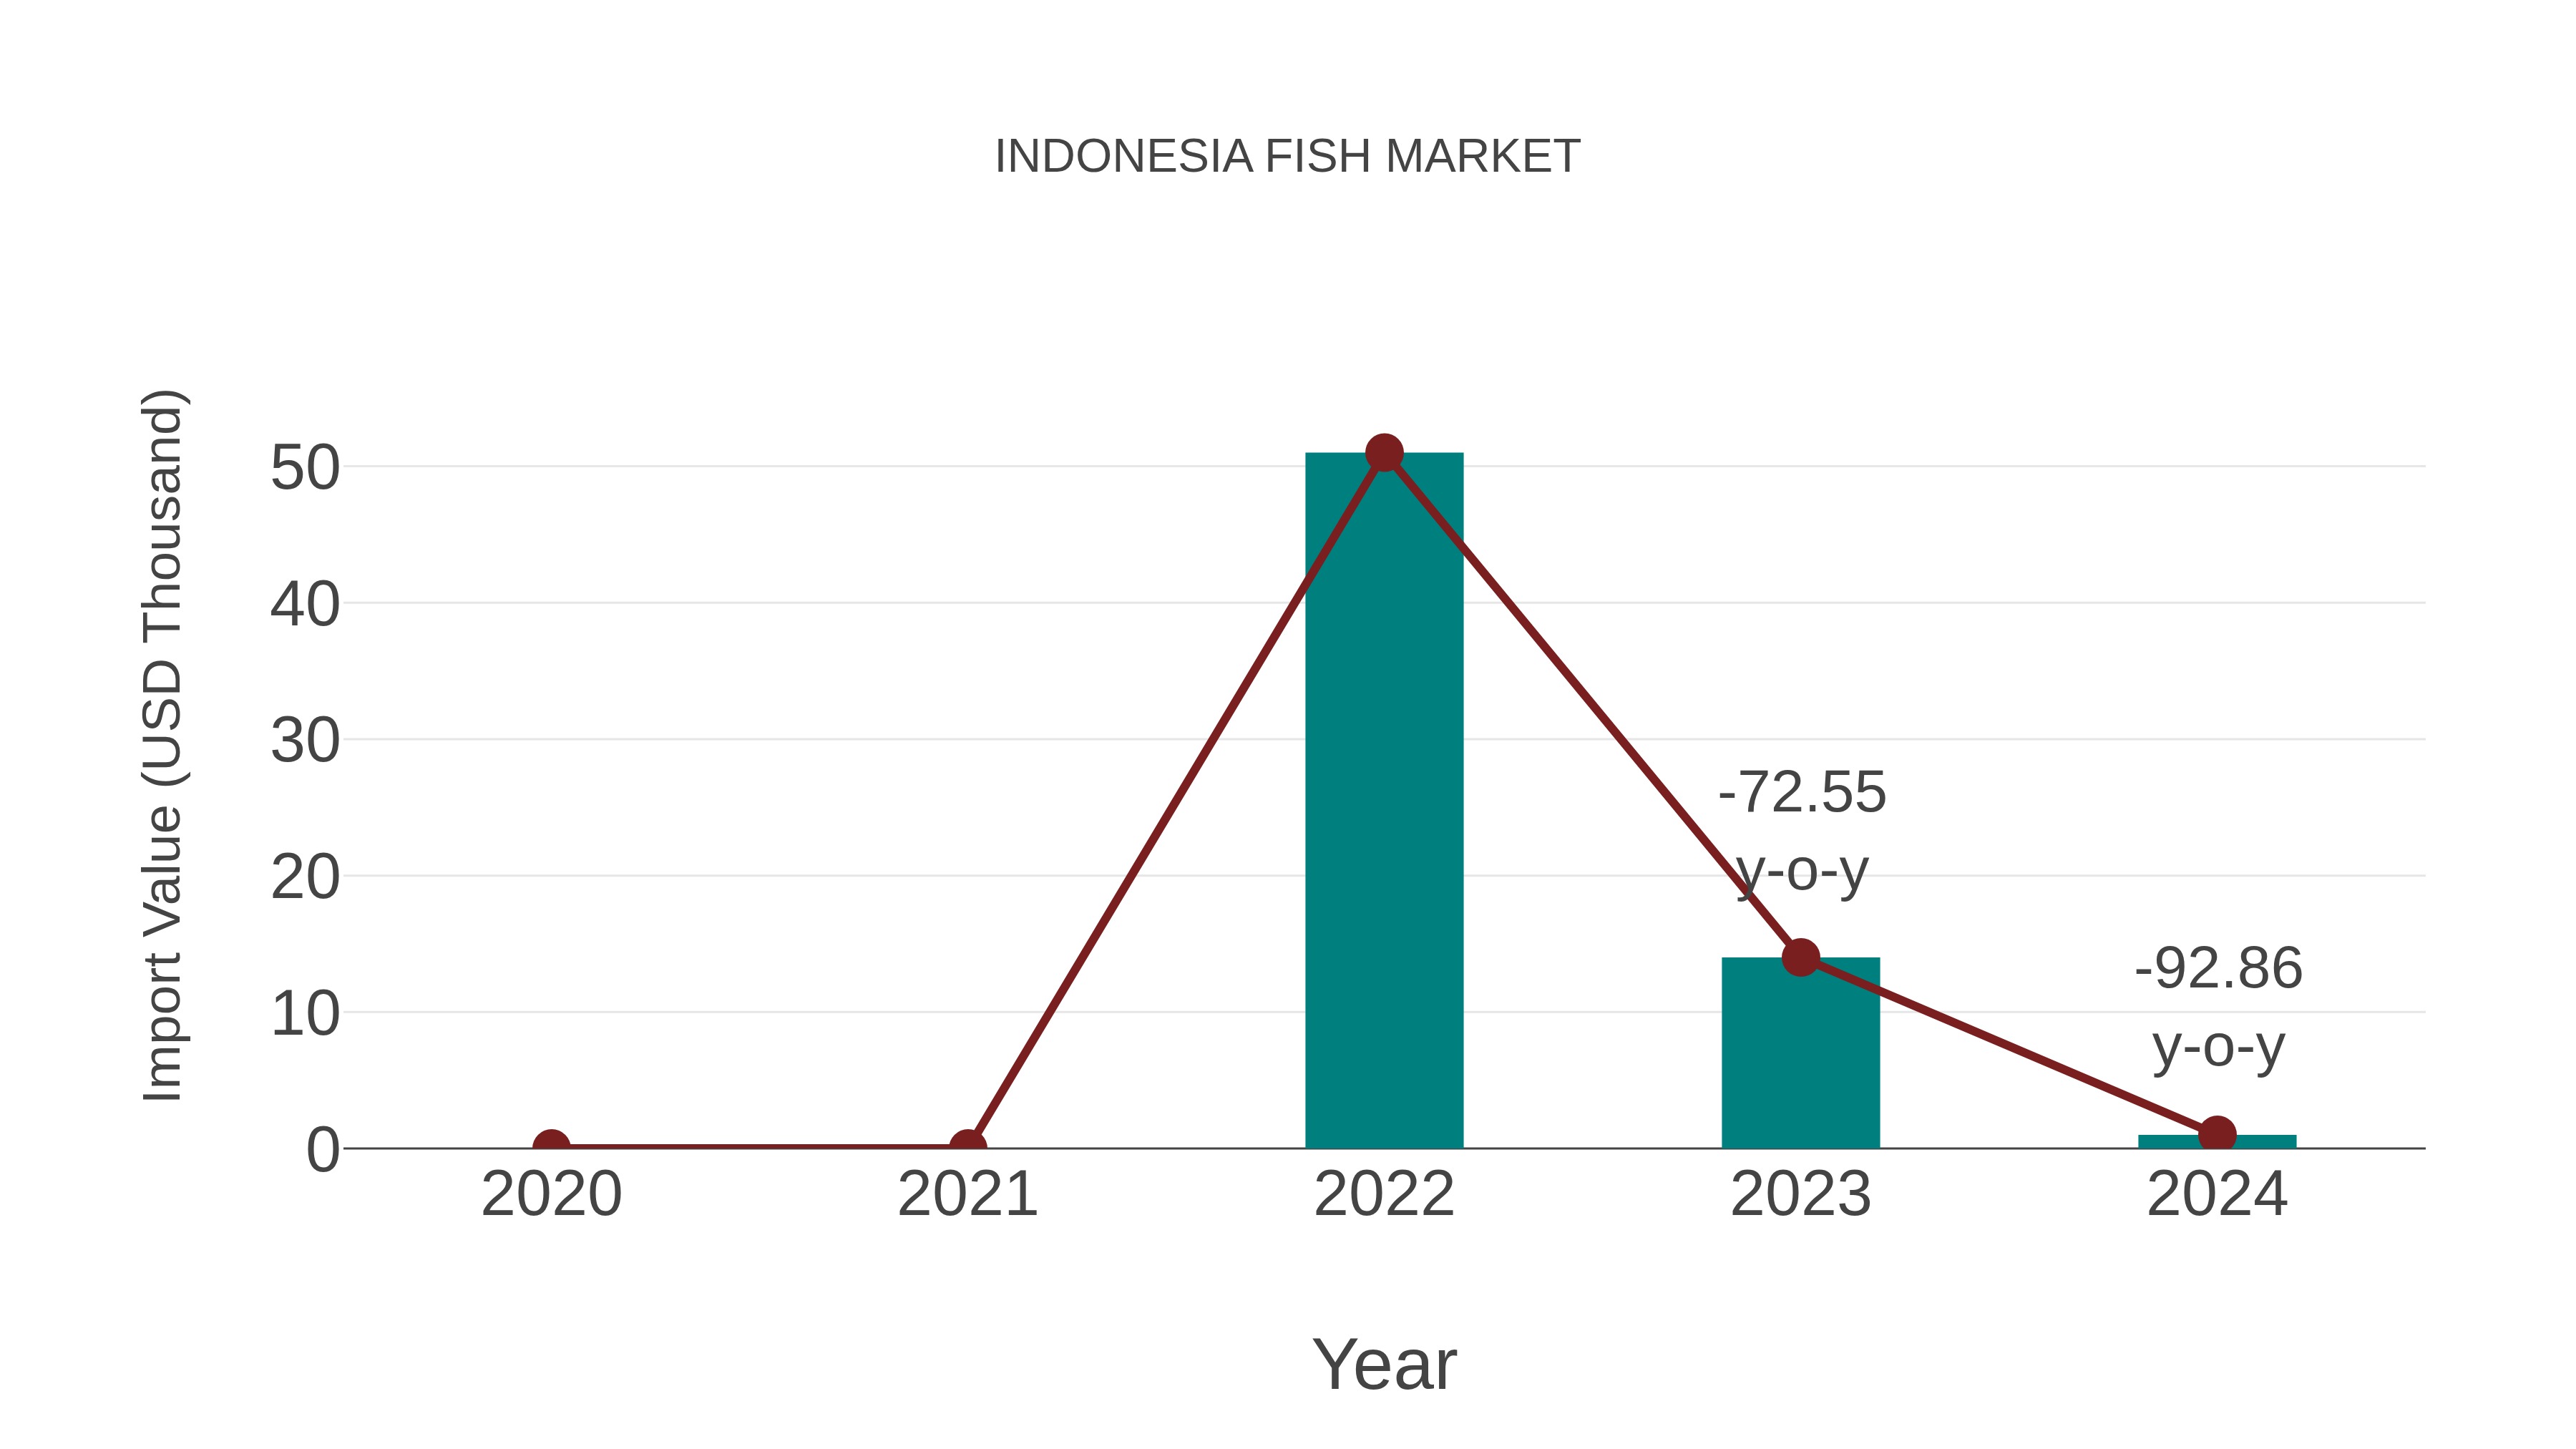
Indonesia Fish Market: Import Trend Analysis
In the Indonesia fish market, the import trend saw a decline from 2023 to 2024, with a growth rate of -6.45%. However, the compound annual growth rate (CAGR) for the period 2020-2024 stood at a robust 28.73%. This dip in import momentum could be attributed to shifting demand patterns or changes in trade policies impacting market stability.
Indonesia Fish Market Synopsis
The fish market in Indonesia was worth an estimated USD 7 billion in 2025 and is expected to witness a CAGR of 8.1% during 2025-2031. The country?s fishing industry accounts for around 2.1% of its total GDP and provides employment opportunities for millions of people across the archipelago nation`s coastal areas as well as its inland water bodies such as rivers, lakes, reservoirs, swamps and other natural habitats suitable for aquaculture activities like fish farming or breeding. Factors such as increasing marine capture production along with improving export prospects due to favorable climatic conditions will drive the growth of this sector during 2025-2031.
Drivers of the Market
Growing population, increasing disposable income, changing dietary preferences, and a strong seafood export industry are driving the demand for fish in Indonesia.
Challenges of the Market
The challenge for the fish market lies in maintaining a consistent supply chain and ensuring the quality and safety of fish products to meet domestic and international standards. Sustainability practices in fishing may also become an area of concern.
COVID-19 Impact on the Market
Lockdowns and restrictions on movement might have disrupted supply chains and impacted both the capture and distribution of fish products.
Key Players in the Market
The fish market involves the buying and selling of various types of fish and seafood. PT Intimas Surya, PT Suri Tani Pemuka, and PT Citra Mina Abadi. These are some major players operating in the market.
Key Highlights of the Report:
- Indonesia Fish Market Outlook
- Market Size of Indonesia Fish Market, 2025
- Forecast of Indonesia Fish Market, 2032
- Historical Data and Forecast of Indonesia Fish Revenues & Volume for the Period 2022-2032F
- Indonesia Fish Market Trend Evolution
- Indonesia Fish Market Drivers and Challenges
- Indonesia Fish Price Trends
- Indonesia Fish Porter's Five Forces
- Indonesia Fish Industry Life Cycle
- Historical Data and Forecast of Indonesia Fish Market Revenues & Volume By Fish Type for the Period 2022-2032F
- Historical Data and Forecast of Indonesia Fish Market Revenues & Volume By Inland Fishes for the Period 2022-2032F
- Historical Data and Forecast of Indonesia Fish Market Revenues & Volume By Marine Fishes for the Period 2022-2032F
- Historical Data and Forecast of Indonesia Fish Market Revenues & Volume By Shrimps for the Period 2022-2032F
- Historical Data and Forecast of Indonesia Fish Market Revenues & Volume By Scampi for the Period 2022-2032F
- Historical Data and Forecast of Indonesia Fish Market Revenues & Volume By Product Type for the Period 2022-2032F
- Historical Data and Forecast of Indonesia Fish Market Revenues & Volume By Fresh for the Period 2022-2032F
- Historical Data and Forecast of Indonesia Fish Market Revenues & Volume By Frozen for the Period 2022-2032F
- Historical Data and Forecast of Indonesia Fish Market Revenues & Volume By Canned for the Period 2022-2032F
- Historical Data and Forecast of Indonesia Fish Market Revenues & Volume By Others for the Period 2022-2032F
- Historical Data and Forecast of Indonesia Fish Market Revenues & Volume By Distribution Channel for the Period 2022-2032F
- Historical Data and Forecast of Indonesia Fish Market Revenues & Volume By Retail for the Period 2022-2032F
- Historical Data and Forecast of Indonesia Fish Market Revenues & Volume By Institutional for the Period 2022-2032F
- Historical Data and Forecast of Indonesia Fish Market Revenues & Volume By Sector for the Period 2022-2032F
- Historical Data and Forecast of Indonesia Fish Market Revenues & Volume By Organised for the Period 2022-2032F
- Historical Data and Forecast of Indonesia Fish Market Revenues & Volume By Unorganised for the Period 2022-2032F
- Indonesia Fish Import Export Trade Statistics
- Market Opportunity Assessment By Fish Type
- Market Opportunity Assessment By Product Type
- Market Opportunity Assessment By Distribution Channel
- Market Opportunity Assessment By Sector
- Indonesia Fish Top Companies Market Share
- Indonesia Fish Competitive Benchmarking By Technical and Operational Parameters
- Indonesia Fish Company Profiles
- Indonesia Fish Key Strategic Recommendations
Indonesia Fish Market (2026-2032): FAQs
6Wresearch actively monitors the Indonesia Fish Market and publishes its comprehensive annual report, highlighting emerging trends, growth drivers, revenue analysis, and forecast outlook. Our insights help businesses to make data-backed strategic decisions with ongoing market dynamics. Our analysts track relevent industries related to the Indonesia Fish Market, allowing our clients with actionable intelligence and reliable forecasts tailored to emerging regional needs.
Yes, we provide customisation as per your requirements. To learn more, feel free to contact us on sales@6wresearch.com
1 Executive Summary |
2 Introduction |
2.1 Key Highlights of the Report |
2.2 Report Description |
2.3 Market Scope & Segmentation |
2.4 Research Methodology |
2.5 Assumptions |
3 Indonesia Fish Market Overview |
3.1 Indonesia Country Macro Economic Indicators |
3.2 Indonesia Fish Market Revenues & Volume, 2022 & 2032F |
3.3 Indonesia Fish Market - Industry Life Cycle |
3.4 Indonesia Fish Market - Porter's Five Forces |
3.5 Indonesia Fish Market Revenues & Volume Share, By Fish Type, 2022 & 2032F |
3.6 Indonesia Fish Market Revenues & Volume Share, By Product Type, 2022 & 2032F |
3.7 Indonesia Fish Market Revenues & Volume Share, By Distribution Channel, 2022 & 2032F |
3.8 Indonesia Fish Market Revenues & Volume Share, By Sector, 2022 & 2032F |
4 Indonesia Fish Market Dynamics |
4.1 Impact Analysis |
4.2 Market Drivers |
4.2.1 Growing demand for seafood due to increasing health consciousness among consumers |
4.2.2 Government initiatives to boost aquaculture production and exports |
4.2.3 Rising disposable income leading to higher consumption of premium fish products |
4.3 Market Restraints |
4.3.1 Environmental concerns and overfishing leading to depletion of fish stocks |
4.3.2 Fluctuating prices of fish due to market volatility and supply chain disruptions |
5 Indonesia Fish Market Trends |
6 Indonesia Fish Market, By Types |
6.1 Indonesia Fish Market, By Fish Type |
6.1.1 Overview and Analysis |
6.1.2 Indonesia Fish Market Revenues & Volume, By Fish Type, 2022-2032F |
6.1.3 Indonesia Fish Market Revenues & Volume, By Inland Fishes, 2022-2032F |
6.1.4 Indonesia Fish Market Revenues & Volume, By Marine Fishes, 2022-2032F |
6.1.5 Indonesia Fish Market Revenues & Volume, By Shrimps, 2022-2032F |
6.1.6 Indonesia Fish Market Revenues & Volume, By Scampi, 2022-2032F |
6.2 Indonesia Fish Market, By Product Type |
6.2.1 Overview and Analysis |
6.2.2 Indonesia Fish Market Revenues & Volume, By Fresh, 2022-2032F |
6.2.3 Indonesia Fish Market Revenues & Volume, By Frozen, 2022-2032F |
6.2.4 Indonesia Fish Market Revenues & Volume, By Canned, 2022-2032F |
6.2.5 Indonesia Fish Market Revenues & Volume, By Others, 2022-2032F |
6.3 Indonesia Fish Market, By Distribution Channel |
6.3.1 Overview and Analysis |
6.3.2 Indonesia Fish Market Revenues & Volume, By Retail, 2022-2032F |
6.3.3 Indonesia Fish Market Revenues & Volume, By Institutional, 2022-2032F |
6.4 Indonesia Fish Market, By Sector |
6.4.1 Overview and Analysis |
6.4.2 Indonesia Fish Market Revenues & Volume, By Organised, 2022-2032F |
6.4.3 Indonesia Fish Market Revenues & Volume, By Unorganised, 2022-2032F |
7 Indonesia Fish Market Import-Export Trade Statistics |
7.1 Indonesia Fish Market Export to Major Countries |
7.2 Indonesia Fish Market Imports from Major Countries |
8 Indonesia Fish Market Key Performance Indicators |
8.1 Percentage of aquaculture production increase year-over-year |
8.2 Average selling price of premium fish products |
8.3 Number of government policies and initiatives supporting the fish market |
8.4 Consumer awareness and perception of sustainable fishing practices |
8.5 Percentage of fish species at sustainable levels in Indonesian waters |
9 Indonesia Fish Market - Opportunity Assessment |
9.1 Indonesia Fish Market Opportunity Assessment, By Fish Type, 2022 & 2032F |
9.2 Indonesia Fish Market Opportunity Assessment, By Product Type, 2022 & 2032F |
9.3 Indonesia Fish Market Opportunity Assessment, By Distribution Channel, 2022 & 2032F |
9.4 Indonesia Fish Market Opportunity Assessment, By Sector, 2022 & 2032F |
10 Indonesia Fish Market - Competitive Landscape |
10.1 Indonesia Fish Market Revenue Share, By Companies, 2025 |
10.2 Indonesia Fish Market Competitive Benchmarking, By Operating and Technical Parameters |
11 Company Profiles |
12 Recommendations |
13 Disclaimer |
Global Go To Market Strategy - 2030
Export potential enables firms to identify high-growth global markets with greater confidence by combining advanced trade intelligence with a structured quantitative methodology. The framework analyzes emerging demand trends and country-level import patterns while integrating macroeconomic and trade datasets such as GDP and population forecasts, bilateral import–export flows, tariff structures, elasticity differentials between developed and developing economies, geographic distance, and import demand projections. Using weighted trade values from 2020–2024 as the base period to project country-to-country export potential for 2030, these inputs are operationalized through calculated drivers such as gravity model parameters, tariff impact factors, and projected GDP per-capita growth. Through an analysis of hidden potentials, demand hotspots, and market conditions that are most favorable to success, this method enables firms to focus on target countries, maximize returns, and global expansion with data, backed by accuracy.
By factoring in the projected importer demand gap that is currently unmet and could be potential opportunity, it identifies the potential for the Exporter (Country) among 190 countries, against the general trade analysis, which identifies the biggest importer or exporter.
To discover high-growth global markets and optimize your business strategy:
Click Here
Pricing
- Single User License$ 1,995
- Department License$ 2,400
- Site License$ 3,120
- Global License$ 3,795

Leadership Perspectives from Industry Events
Search
Thought Leadership and Analyst Meet


Our Clients
6WResearch In News
- India Export Attractiveness Tracker 2026
- India Air Conditioner Market Set for Strong Rebound in 2026 After Weather-Led Correction and GST-Driven Recovery: 6Wresearch
- ADAS in India: How Automatic Emergency Braking, Blind Spot Detection & Driver Monitoring are Transforming Road Safety
- Doha a strategic location for EV manufacturing hub: IPA Qatar
- Demand for luxury TVs surging in the GCC, says Samsung
- Empowering Growth: The Thriving Journey of Bangladesh’s Cable Industry
Latest Reports
- Nicaragua RPG Gaming Market (2026-2032)
- New Zealand RPG Gaming Market (2026-2032)
- Netherlands RPG Gaming Market (2026-2032)
- Nauru RPG Gaming Market (2026-2032)
- Namibia RPG Gaming Market (2026-2032)
- Mozambique RPG Gaming Market (2026-2032)
- Montenegro RPG Gaming Market (2026-2032)
- Mongolia RPG Gaming Market (2026-2032)
- Monaco RPG Gaming Market (2026-2032)
- Micronesia RPG Gaming Market (2026-2032)
Industry Events and Analyst Meet

EV India Expo 2026

HIMTEX 2026

India Refining Summit 2026

India EV Show 2026

EV tech India Expo 2026
Whitepaper
- Middle East & Africa Commercial Security Market Click here to view more.
- Middle East & Africa Fire Safety Systems & Equipment Market Click here to view more.
- GCC Drone Market Click here to view more.
- Middle East Lighting Fixture Market Click here to view more.
- GCC Physical & Perimeter Security Market Click here to view more.