Indonesia Glass Processing Equipment Market (2026-2032) | Revenue, Industry, Share, Value, Size, Growth, Analysis, Forecast, Outlook, Companies & Trends
Market Forecast By Type (Machinery for cutting glass, Machinery for breaking glass, Glass-grinding machine, Glass drilling machine, Others), By End-users (Food & Beverage, Construction, Automotive, Consumer Electronics and Furniture, Others) And Competitive Landscape
| Product Code: ETC047708 | Publication Date: Jul 2023 | Updated Date: Jun 2026 | Product Type: Report | |
| Publisher: 6Wresearch | Author: Ravi Bhandari | No. of Pages: 70 | No. of Figures: 35 | No. of Tables: 5 |
Indonesia Glass Processing Equipment Market Size, Share & Growth Rate
The Indonesia Glass Processing Equipment Market was estimated at USD 467 Million in 2025 and is projected to reach USD 620 Million by 2032, growing at a CAGR of 4.1% from 2026 to 2032. This growth trajectory is fueled by the booming construction sector, which has created a heightened need for sophisticated glass processing technologies. Additionally, rising disposable incomes among consumers are facilitating greater investments in high-quality glass products, while rapid industrialization continues to boost the market further.
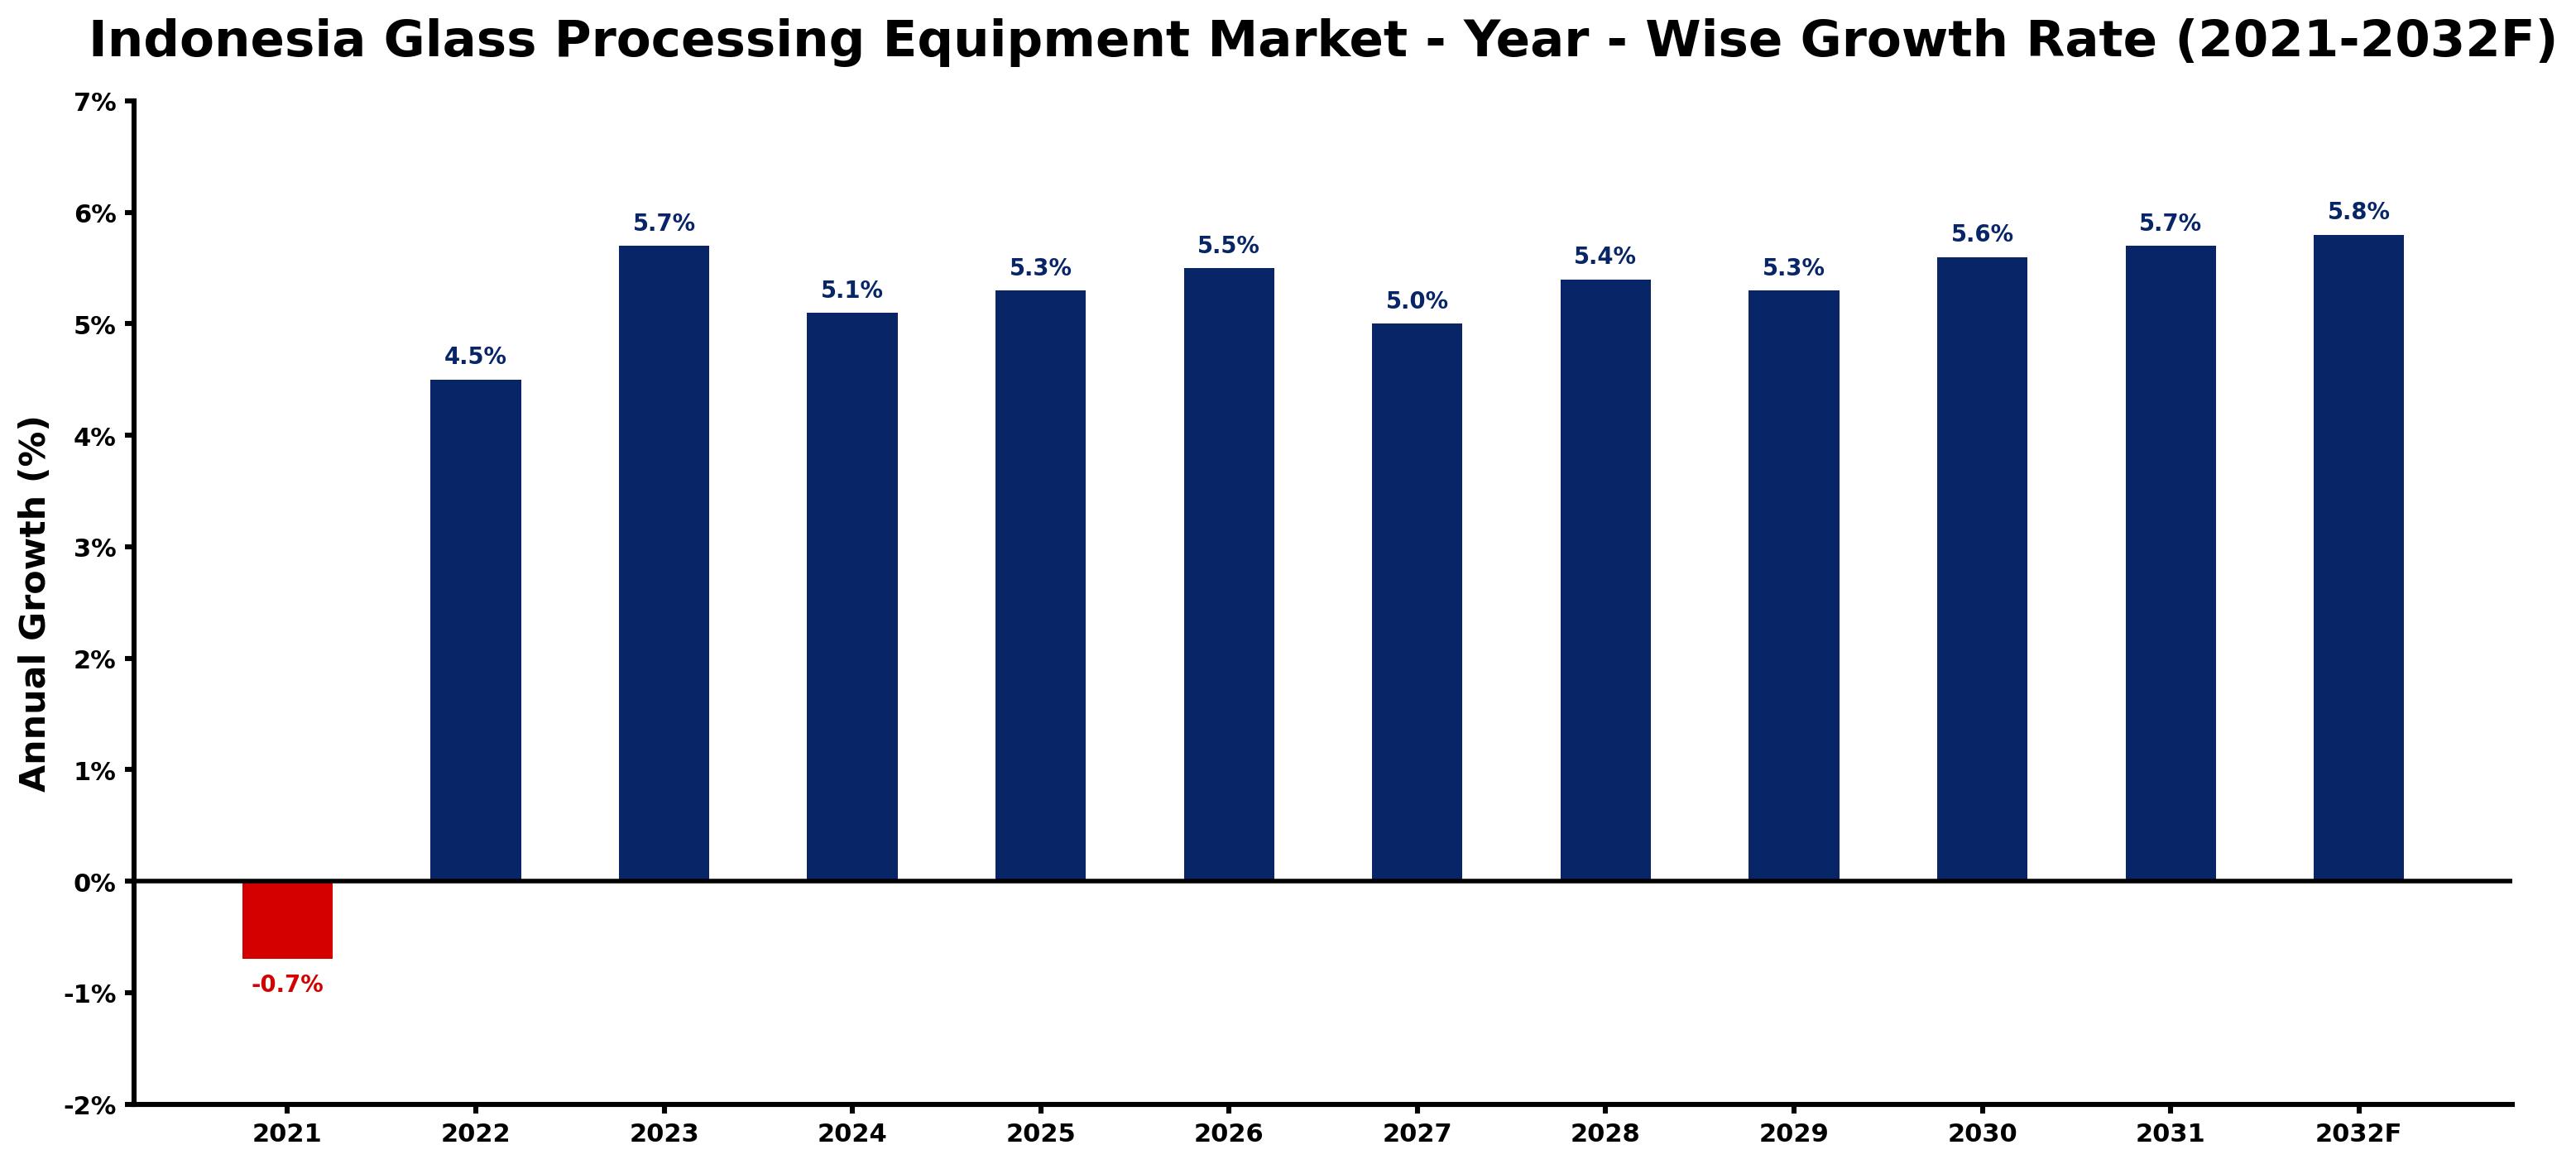
Indonesia Glass Processing Equipment Market Growth Rate Analysis (2021-2032)
The Indonesian glass processing equipment market has exhibited notable fluctuations in its growth pattern, initially contracting by 0.7% in 2021, likely due to the economic impacts of the pandemic and a slowdown in construction activities. However, as recovery took hold, the market rebounded with a growth of 4.5% in 2022, driven by increasing infrastructure projects and rising consumer demand for sustainable glass solutions. The upward trend continued with a significant 5.7% growth in 2023, supported by technological advancements and government policies advocating for energy-efficient materials. This momentum is projected to persist, with annual growth rates stabilizing around 5.1% to 5.8% through 2032, reflecting robust investments and a proactive digitalization strategy within the sector.
Indonesia Glass Processing Equipment Market Year-wise Growth Rate and Key Drivers
This graph highlights how the Indonesia Glass Processing Equipment Market has steadily grown over the past five years, supported by major growth factors.
The table below presents the year‑wise growth rates along with the key drivers influencing the market
| Year | Growth Rate | Major Drivers |
| 2021 | -0.7% | Increasing smart city development projects |
| 2022 | 4.5% | Expansion of manufacturing activities |
| 2023 | 5.7% | Increasing smart city development projects |
| 2024 | 5.1% | Growing renewable energy integration projects |
| 2025 | 5.3% | Increasing industrial infrastructure investments |
| 2026 | 5.5% | Expansion of manufacturing activities |
| 2027 | 5.0% | Increasing industrial automation investments |
| 2028 | 5.4% | Growing renewable energy integration projects |
| 2029 | 5.3% | Growing urbanization and commercial development |
| 2030 | 5.6% | Increasing industrial automation investments |
| 2031 | 5.7% | Expansion of transportation and logistics networks |
| 2032 | 5.8% | Expansion of manufacturing activities |
Note - Market size estimations and growth projections presented in this report are based on 6Wresearch’s advanced forecasting approach, validated with industry datasets as of June 2026.
Indonesia Glass Processing Equipment Market Synopsis
In recent years, the Indonesia Glass Processing Equipment Market has witnessed significant momentum, driven primarily by escalating construction projects and increasing industrial activity. As we move forward, this market is poised to evolve further, underpinned by advancements in manufacturing technologies and a growing focus on quality and efficiency.
Despite the positive outlook, the market must navigate challenges related to raw material costs and competitive pressures from lower-priced imports. However, the government’s commitment to bolstering the manufacturing sector suggests a landscape ripe for innovation and investment in glass processing technologies.
Indonesia Glass Processing Equipment Market Key Takeaways
- Robust growth projected due to increased construction activities and consumer spending.
- Advancements in technology driving the demand for sophisticated glass processing equipment.
- Government initiatives promoting investment are catalyzing market expansion.
- Challenges include rising raw material costs and competition from cheaper imports.
- The market is evolving with a trend toward high-quality and customized glass products.
Evaluation of Restraints in Indonesia Glass Processing Equipment Market
One of the primary constraints in the Indonesia Glass Processing Equipment Market is the high dependency on raw materials such as silica and quartz, which can significantly increase production costs. This financial burden can deter smaller manufacturers from entering the market, limiting competition. Furthermore, the influx of cheaper imports from countries with lower labor costs poses a significant challenge, compelling local manufacturers to differentiate their products through quality and innovation rather than solely on price.
Indonesia Glass Processing Equipment Market Trends
The market is witnessing several trends that are shaping demand for glass processing equipment. A notable trend is the increasing shift toward automation, as manufacturers seek to enhance efficiency and reduce operational costs. Additionally, there’s a growing preference for environmentally friendly processing technologies, spurred by consumer awareness and regulatory pressures. These trends not only improve product quality but also align with broader sustainability goals.
Indonesia Glass Processing Equipment Market Opportunities
Significant growth opportunities exist in the emerging sectors such as automotive and electronics, where demand for specialized glass products is on the rise. Additionally, ongoing urbanization and infrastructure development projects will likely spur further investment in advanced glass processing technologies. Companies that focus on R&D to innovate and offer unique solutions will be well-positioned to capture market share and drive growth.
Government Initiatives in the Indonesia Glass Processing Equipment Market
The Indonesian government is actively supporting the manufacturing sector through various initiatives aimed at attracting foreign investments and enhancing local production capabilities. Programs designed to improve infrastructure and regulatory frameworks are encouraging businesses to invest in advanced machinery and technologies. Such initiatives not only promote growth within the glass processing equipment market but also aim to establish Indonesia as a manufacturing hub within Southeast Asia.
Future Insights of the Indonesia Glass Processing Equipment Market
Looking ahead to the period from 2026 to 2032, the Indonesia Glass Processing Equipment Market is expected to continue its growth trajectory, driven by rising consumer demand and ongoing infrastructure development. Innovations in processing technology are likely to enhance product quality and processing efficiency, solidifying the market’s position. As local manufacturers adapt to competitive pressures, we anticipate a shift toward more customized, high-tech solutions that align with consumer preferences.
Indonesia Glass Processing Equipment Market Latest Developments (May 2025 - June 2026)
Recent developments within the Indonesia Glass Processing Equipment Market indicate a significant push towards digitization and automation. Various industry players are beginning to invest in smart technologies that enhance operational efficiency and product quality. Additionally, strategic partnerships are emerging between local firms and international manufacturers to foster knowledge transfer and innovation. This direction points to an exciting evolution within the market as it embraces modern technologies to meet the needs of diverse sectors.
Indonesia Glass Processing Equipment Market - Key Attractiveness of the Report
- 10 Years of Market Numbers
- Historical Data Starting from 2022 to 2025
- Base Year: 2025
- Forecast Data until 2032
- Key Performance Indicators Impacting the Market
- Major Upcoming Developments and Projects
Key Highlights of the Report:
- Indonesia Glass Processing Equipment Market Outlook
- Market Size of Indonesia Glass Processing Equipment Market, 2025
- Forecast of Indonesia Glass Processing Equipment Market, 2032F
- Historical Data and Forecast of Indonesia Glass Processing Equipment Revenues & Volume for the Period 2022-2032F
- Indonesia Glass Processing Equipment Market Trend Evolution
- Indonesia Glass Processing Equipment Market Drivers and Challenges
- Indonesia Glass Processing Equipment Price Trends
- Indonesia Glass Processing Equipment Porter's Five Forces
- Indonesia Glass Processing Equipment Industry Life Cycle
- Historical Data and Forecast of Indonesia Glass Processing Equipment Market Revenues & Volume By Type for the Period 2022-2032F
- Historical Data and Forecast of Indonesia Glass Processing Equipment Market Revenues & Volume By Machinery for cutting glass for the Period 2022-2032F
- Historical Data and Forecast of Indonesia Glass Processing Equipment Market Revenues & Volume By Machinery for breaking glass for the Period 2022-2032F
- Historical Data and Forecast of Indonesia Glass Processing Equipment Market Revenues & Volume By Glass-grinding machine for the Period 2022-2032F
- Historical Data and Forecast of Indonesia Glass Processing Equipment Market Revenues & Volume By Glass drilling machine for the Period 2022-2032F
- Historical Data and Forecast of Indonesia Glass Processing Equipment Market Revenues & Volume By Others for the Period 2022-2032F
- Historical Data and Forecast of Indonesia Glass Processing Equipment Market Revenues & Volume By End-users for the Period 2022-2032F
- Historical Data and Forecast of Indonesia Glass Processing Equipment Market Revenues & Volume By Food & Beverage for the Period 2022-2032F
- Historical Data and Forecast of Indonesia Glass Processing Equipment Market Revenues & Volume By Construction for the Period 2022-2032F
- Historical Data and Forecast of Indonesia Glass Processing Equipment Market Revenues & Volume By Automotive for the Period 2022-2032F
- Historical Data and Forecast of Indonesia Glass Processing Equipment Market Revenues & Volume By Consumer Electronics and Furniture for the Period 2022-2032F
- Historical Data and Forecast of Indonesia Glass Processing Equipment Market Revenues & Volume By Others for the Period 2022-2032F
- Indonesia Glass Processing Equipment Import Export Trade Statistics
- Market Opportunity Assessment By Type
- Market Opportunity Assessment By End-users
- Indonesia Glass Processing Equipment Top Companies Market Share
- Indonesia Glass Processing Equipment Competitive Benchmarking By Technical and Operational Parameters
- Indonesia Glass Processing Equipment Company Profiles
- Indonesia Glass Processing Equipment Key Strategic Recommendations
Indonesia Glass Processing Equipment Market - Frequently Asked Questions
The market is projected to grow at a CAGR of 4.1% from 2026 to 2032, increasing from an estimated USD 467 Million in 2025 to USD 620 Million by 2032.
Government initiatives aimed at boosting manufacturing capabilities and attracting investment are playing a pivotal role in shaping the growth of the glass processing equipment sector, enhancing local production and technology adoption.
Automation and a shift towards environmentally friendly processing technologies are key trends driving demand, as manufacturers seek efficiency and sustainability in their operations.
Manufacturers are dealing with high raw material costs and intense competition from lower-priced imports, which complicate pricing strategies and profitability.
Emerging sectors such as automotive and electronics are anticipated to drive significant growth due to increasing demand for specialized glass products tailored for these industries.
6Wresearch actively monitors the Indonesia Glass Processing Equipment Market and publishes its comprehensive annual report, highlighting emerging trends, growth drivers, revenue analysis, and forecast outlook. Our insights help businesses to make data-backed strategic decisions with ongoing market dynamics. Our analysts track relevent industries related to the Indonesia Glass Processing Equipment Market, allowing our clients with actionable intelligence and reliable forecasts tailored to emerging regional needs.
Yes, we provide customisation as per your requirements. To learn more, feel free to contact us on sales@6wresearch.com
1 Executive Summary |
2 Introduction |
2.1 Key Highlights of the Report |
2.2 Report Description |
2.3 Market Scope & Segmentation |
2.4 Research Methodology |
2.5 Assumptions |
3 Indonesia Glass Processing Equipment Market Overview |
3.1 Indonesia Country Macro Economic Indicators |
3.2 Indonesia Glass Processing Equipment Market Revenues & Volume, 2022 & 2032F |
3.3 Indonesia Glass Processing Equipment Market - Industry Life Cycle |
3.4 Indonesia Glass Processing Equipment Market - Porter's Five Forces |
3.5 Indonesia Glass Processing Equipment Market Revenues & Volume Share, By Type, 2022 & 2032F |
3.6 Indonesia Glass Processing Equipment Market Revenues & Volume Share, By End-users, 2022 & 2032F |
4 Indonesia Glass Processing Equipment Market Dynamics |
4.1 Impact Analysis |
4.2 Market Drivers |
4.3 Market Restraints |
5 Indonesia Glass Processing Equipment Market Trends |
6 Indonesia Glass Processing Equipment Market, By Types |
6.1 Indonesia Glass Processing Equipment Market, By Type |
6.1.1 Overview and Analysis |
6.1.2 Indonesia Glass Processing Equipment Market Revenues & Volume, By Type, 2022-2032F |
6.1.3 Indonesia Glass Processing Equipment Market Revenues & Volume, By Machinery for cutting glass, 2022-2032F |
6.1.4 Indonesia Glass Processing Equipment Market Revenues & Volume, By Machinery for breaking glass, 2022-2032F |
6.1.5 Indonesia Glass Processing Equipment Market Revenues & Volume, By Glass-grinding machine, 2022-2032F |
6.1.6 Indonesia Glass Processing Equipment Market Revenues & Volume, By Glass drilling machine, 2022-2032F |
6.1.7 Indonesia Glass Processing Equipment Market Revenues & Volume, By Others, 2022-2032F |
6.2 Indonesia Glass Processing Equipment Market, By End-users |
6.2.1 Overview and Analysis |
6.2.2 Indonesia Glass Processing Equipment Market Revenues & Volume, By Food & Beverage, 2022-2032F |
6.2.3 Indonesia Glass Processing Equipment Market Revenues & Volume, By Construction, 2022-2032F |
6.2.4 Indonesia Glass Processing Equipment Market Revenues & Volume, By Automotive, 2022-2032F |
6.2.5 Indonesia Glass Processing Equipment Market Revenues & Volume, By Consumer Electronics and Furniture, 2022-2032F |
6.2.6 Indonesia Glass Processing Equipment Market Revenues & Volume, By Others, 2022-2032F |
7 Indonesia Glass Processing Equipment Market Import-Export Trade Statistics |
7.1 Indonesia Glass Processing Equipment Market Export to Major Countries |
7.2 Indonesia Glass Processing Equipment Market Imports from Major Countries |
8 Indonesia Glass Processing Equipment Market Key Performance Indicators |
9 Indonesia Glass Processing Equipment Market - Opportunity Assessment |
9.1 Indonesia Glass Processing Equipment Market Opportunity Assessment, By Type, 2022 & 2032F |
9.2 Indonesia Glass Processing Equipment Market Opportunity Assessment, By End-users, 2022 & 2032F |
10 Indonesia Glass Processing Equipment Market - Competitive Landscape |
10.1 Indonesia Glass Processing Equipment Market Revenue Share, By Companies, 2025 |
10.2 Indonesia Glass Processing Equipment Market Competitive Benchmarking, By Operating and Technical Parameters |
11 Company Profiles |
12 Recommendations |
13 Disclaimer |
Global Go To Market Strategy - 2030
Export potential enables firms to identify high-growth global markets with greater confidence by combining advanced trade intelligence with a structured quantitative methodology. The framework analyzes emerging demand trends and country-level import patterns while integrating macroeconomic and trade datasets such as GDP and population forecasts, bilateral import–export flows, tariff structures, elasticity differentials between developed and developing economies, geographic distance, and import demand projections. Using weighted trade values from 2020–2024 as the base period to project country-to-country export potential for 2030, these inputs are operationalized through calculated drivers such as gravity model parameters, tariff impact factors, and projected GDP per-capita growth. Through an analysis of hidden potentials, demand hotspots, and market conditions that are most favorable to success, this method enables firms to focus on target countries, maximize returns, and global expansion with data, backed by accuracy.
By factoring in the projected importer demand gap that is currently unmet and could be potential opportunity, it identifies the potential for the Exporter (Country) among 190 countries, against the general trade analysis, which identifies the biggest importer or exporter.
To discover high-growth global markets and optimize your business strategy:
Click Here
Pricing
- Single User License$ 1,995
- Department License$ 2,400
- Site License$ 3,120
- Global License$ 3,795

Leadership Perspectives from Industry Events
Search
Thought Leadership and Analyst Meet


Our Clients
6WResearch In News
- India Air Conditioner Market Set for Strong Rebound in 2026 After Weather-Led Correction and GST-Driven Recovery: 6Wresearch
- ADAS in India: How Automatic Emergency Braking, Blind Spot Detection & Driver Monitoring are Transforming Road Safety
- Doha a strategic location for EV manufacturing hub: IPA Qatar
- Demand for luxury TVs surging in the GCC, says Samsung
- Empowering Growth: The Thriving Journey of Bangladesh’s Cable Industry
- Demand for luxury TVs surging in the GCC, says Samsung
Latest Reports
- Poland Fire Protection Systems Market (2026-2032)
- Cape Verde Portable Hand-Thrown Extinguisher Market (2026-2032)
- Canada Portable Hand-Thrown Extinguisher Market (2026-2032)
- Cameroon Portable Hand-Thrown Extinguisher Market (2026-2032)
- Burundi Portable Hand-Thrown Extinguisher Market (2026-2032)
- Burkina Faso Portable Hand-Thrown Extinguisher Market (2026-2032)
- Bulgaria Portable Hand-Thrown Extinguisher Market (2026-2032)
- Brunei Portable Hand-Thrown Extinguisher Market (2026-2032)
- Botswana Portable Hand-Thrown Extinguisher Market (2026-2032)
- Bosnia and Herzegovina Portable Hand-Thrown Extinguisher Market (2026-2032)
Industry Events and Analyst Meet

HIMTEX 2026

India Refining Summit 2026

India EV Show 2026

EV tech India Expo 2026

Auto Tech Asia 2026
Whitepaper
- Middle East & Africa Commercial Security Market Click here to view more.
- Middle East & Africa Fire Safety Systems & Equipment Market Click here to view more.
- GCC Drone Market Click here to view more.
- Middle East Lighting Fixture Market Click here to view more.
- GCC Physical & Perimeter Security Market Click here to view more.