Indonesia Hand Carts & Trolleys Market (2026-2032) | Share, Industry, Growth, Outlook, Analysis, Revenue, Forecast, Value, Trends, Size & Companies
Market Forecast By Types (Steel Hand Truck, Aluminium Hand Truck), By Applications (Online Sales, Offline Sales) And Competitive Landscape
| Product Code: ETC009468 | Publication Date: Jul 2023 | Updated Date: Jun 2026 | Product Type: Report | |
| Publisher: 6Wresearch | Author: Ravi Bhandari | No. of Pages: 70 | No. of Figures: 35 | No. of Tables: 5 |
Indonesia Hand Carts & Trolleys Market Summary
The indonesia hand carts & trolleys market was estimated at USD 398 Million in 2025 and is projected to reach USD 530 Million by 2032, growing at a CAGR of 5.0% from 2026 to 2032.
Indonesia Hand Carts & Trolleys Market Year-wise Growth Rate and Key Drivers
This graph highlights how the Indonesia Hand Carts & Trolleys Market has steadily grown over the past five years, supported by major growth factors.
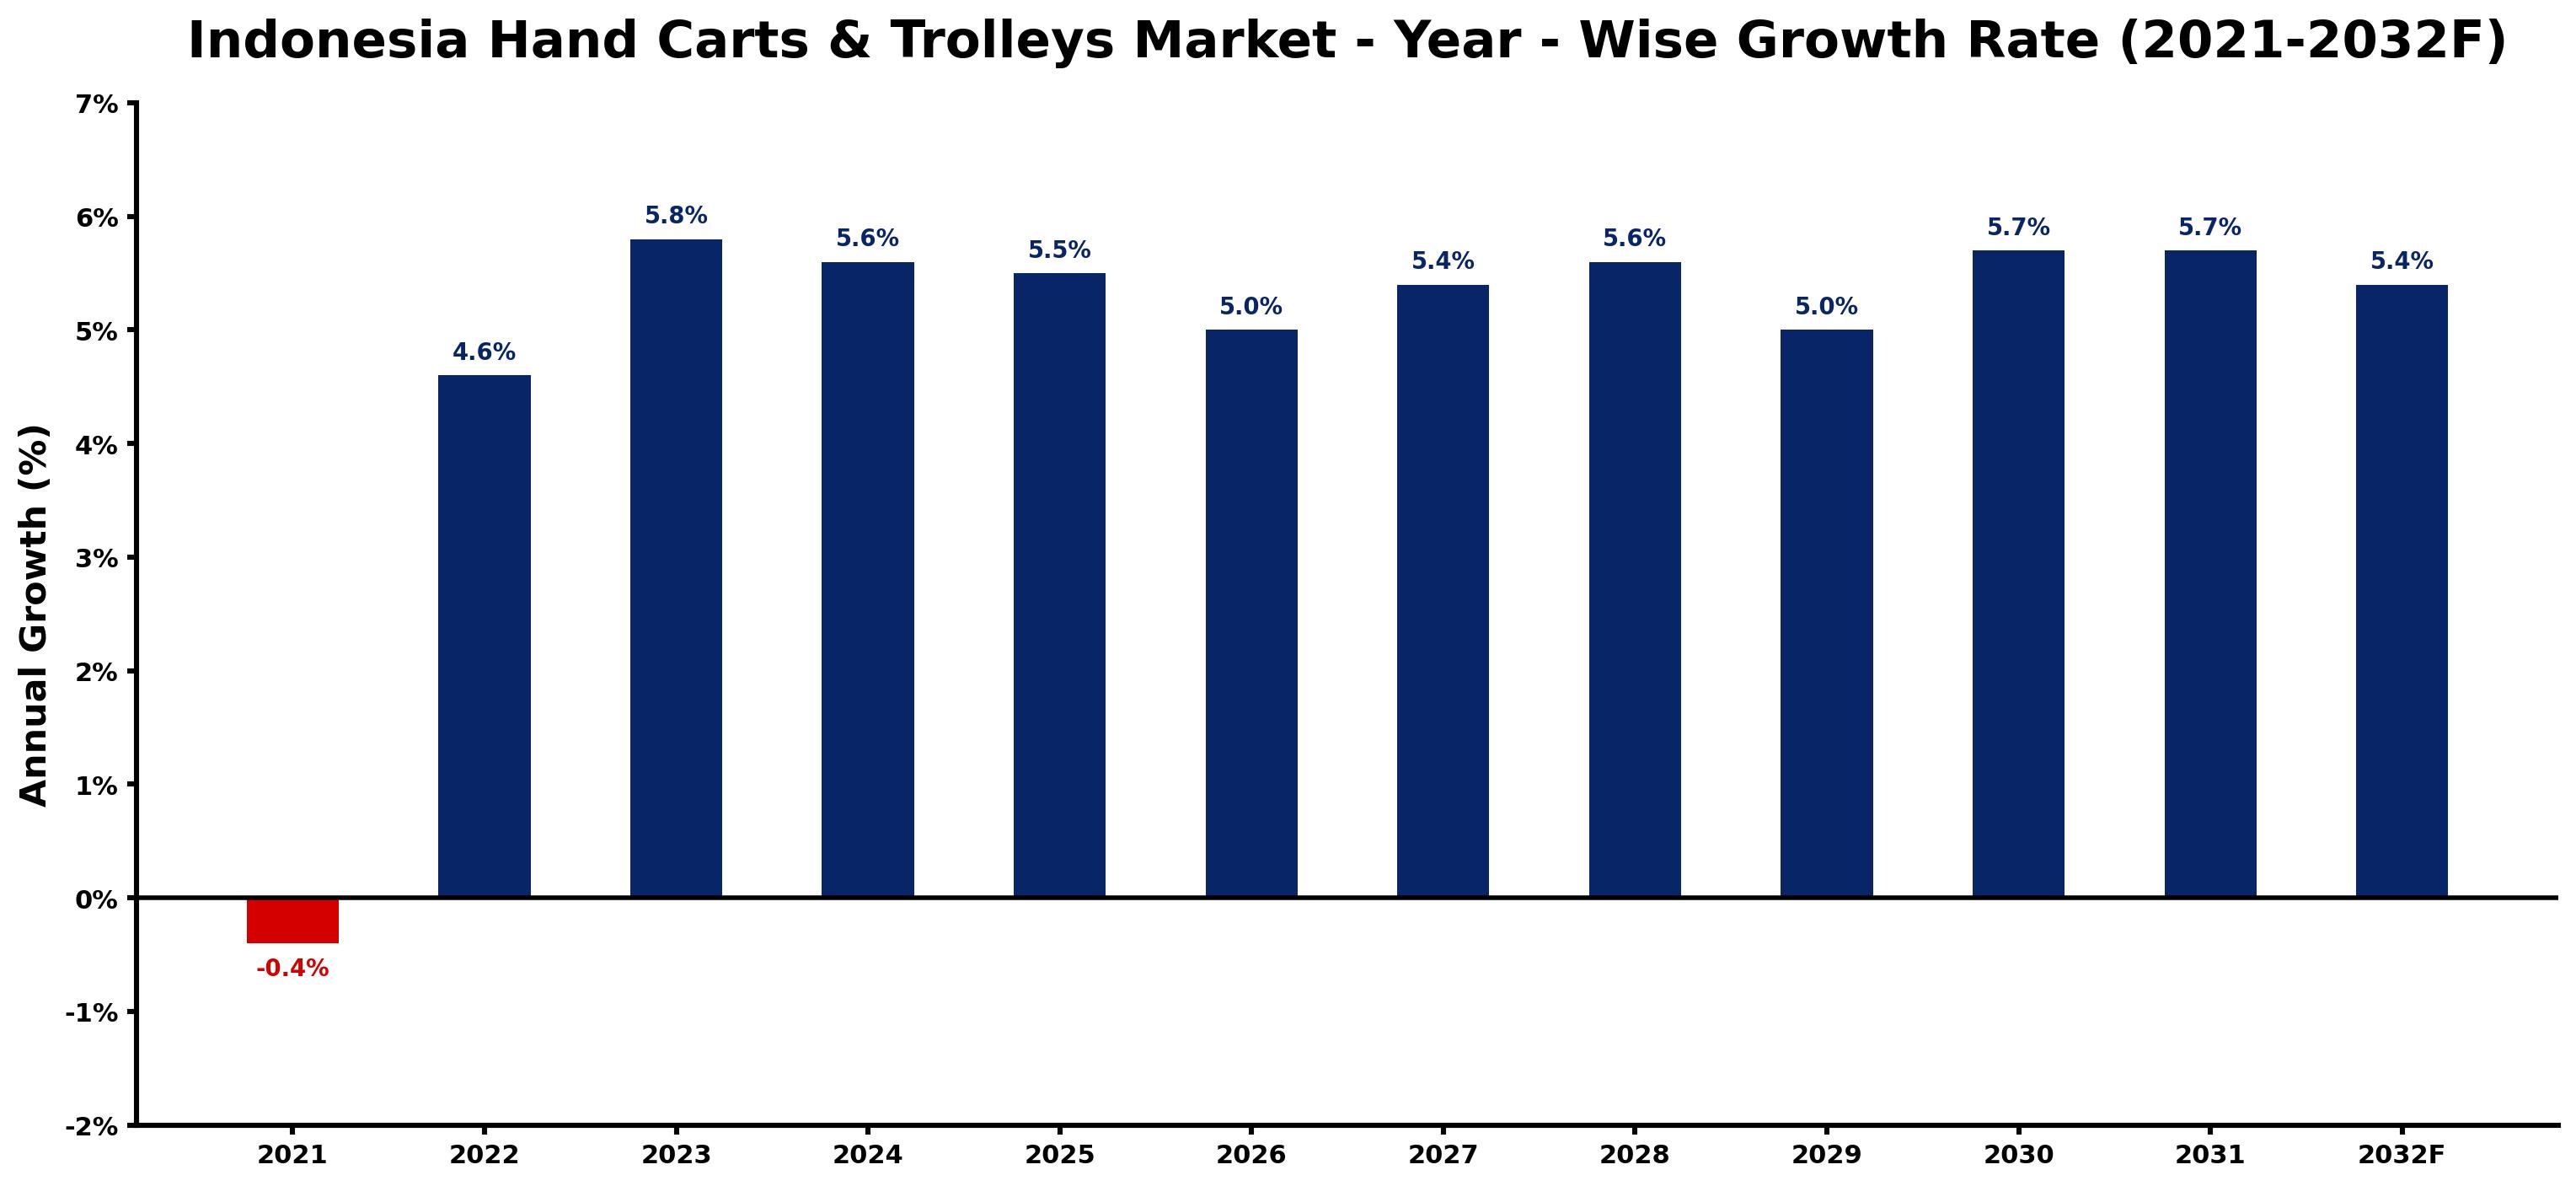
The table below presents the year wise growth rates along with the key drivers influencing the market
| Year | Growth Rate | Major Drivers |
| 2021 | -0.4% | Supply chain disruptions caused by prolonged pandemic effects hindered manufacturing capacity and delayed market recovery. |
| 2022 | 4.6% | Local craftsmen increasingly sought durable hand carts for agricultural transport and local markets. |
| 2023 | 5.8% | Urbanization intensified pressure on informal sectors to optimize delivery and transport methods. |
| 2024 | 5.6% | Emerging e-commerce platforms contributed to increased demand for reliable last-mile delivery solutions. |
| 2025 | 5.5% | Infrastructure investments boosted the need for commercial trolleys in construction and logistics sectors. |
| 2026 | 5.0% | Community-based businesses expanded, relying on hand carts for mobility and operational efficiency. |
| 2027 | 5.4% | Environmental awareness spurred interest in eco-friendly materials for hand carts and trolleys. |
| 2028 | 5.6% | Technological advancements enabled smart carts equipped with tracking and inventory management systems. |
| 2029 | 5.0% | Rural tourism growth encouraged local artisans to produce custom, culturally themed hand carts. |
| 2030 | 5.7% | Integration of electric components in trolleys improved functionality, appealing to urban consumers. |
| 2031 | 5.7% | Increased focus on sustainable transport solutions promoted innovation within the hand cart market. |
| 2032 | 5.4% | Customized solutions for businesses led to diverse product offerings in the hand cart sector. |
Note - Market size estimations and growth projections presented in this report are based on 6Wresearch's advanced forecasting approach, validated with industry datasets as of June 2026.
Indonesia Hand Carts & Trolleys Market Synopsis
The Indonesia Hand Carts Trolleys Market is projected to reach 5.0% and witness significant growth during the forecast period (2026-2032). This anticipated expansion is primarily driven by the increasing demand for hand carts and trolleys across various sectors, including retail, logistics, warehousing, and hospitality. The urban population's growth, combined with rising disposable incomes, has led to a heightened demand for consumer goods, which in turn necessitates efficient material handling solutions. Furthermore, the rapid expansion of the e-commerce sector in Indonesia is contributing to the increased demand for these products, facilitated by a need for faster delivery services and improved customer satisfaction.
Indonesia Hand Carts & Trolleys Market Growth Drivers
Several factors are propelling the growth of the Indonesia Hand Carts & Trolleys Market:
- The rising demand from a variety of industries such as retail outlets, healthcare facilities, and warehouses is significantly influencing the market. As these sectors continue to expand, the need for effective material handling solutions becomes increasingly critical.
- In addition to industrial growth, the increasing disposable income among Indonesian consumers is fostering a shift towards more consumer goods, which consequently drives the need for hand carts and trolleys for efficient movement and transport.
- The booming e-commerce sector in Indonesia has introduced a robust demand for hand carts and trolleys. As online shopping gains momentum, businesses require reliable and cost-effective solutions for inventory management and logistics.
- Local manufacturers and distributors have established a competitive presence in the market. Their engagement fosters innovation and improves product accessibility, thereby supporting industry growth during the forecast period.
- The trend towards sustainability is increasingly influencing market dynamics, with many businesses opting for eco-friendly hand carts and trolleys. This shift is driven by the growing awareness of environmental impact among consumers and businesses alike.
Indonesia Hand Carts & Trolleys Market Challenges and Restraints
Despite the encouraging growth prospects, the Indonesia Hand Carts & Trolleys Market faces several challenges:
- The initial costs associated with deploying hand cart and trolley systems can be prohibitive, leading to concerns over return on investment for potential buyers. This factor often discourages businesses from making necessary upgrades to their material handling systems.
- Consumer reluctance towards investing in more automated handling solutions presents a challenge, as many traditional users prefer manual options due to familiarity, despite the efficiency offered by more advanced products.
- The lack of awareness regarding the benefits of adopting innovative material handling solutions can slow market penetration rates. Educating potential consumers about these advantages remains necessary for market advancement.
- Competition from alternative solutions such as automated systems and robotics may pose a threat to traditional hand carts and trolleys, as companies seek high-tech solutions for their logistics challenges.
- Economic fluctuations may impact consumer spending and business investment in the sector, which can lead to reduced demand for hand carts and trolleys in the short term.
Indonesia Hand Carts & Trolleys Market Government Investment and Initiatives
The Indonesian government has been actively investing in infrastructure and industrial development, which directly impacts the Hand Carts & Trolleys Market. Recent initiatives aim to enhance logistics efficiency and support local manufacturing capabilities. Government policies are increasingly focused on developing smart transportation networks and logistics systems, thereby promoting the use of efficient material handling solutions in urban areas. Additionally, there are incentives for businesses that adopt sustainable practices, which can drive further innovation in the design and functionality of hand carts and trolleys. This investment climate is conducive to the growth of local manufacturers and the overall market development.
Indonesia Hand Carts & Trolleys Market Latest Developments (May 2025 - June 2026)
Recent developments in the Indonesia Hand Carts & Trolleys Market highlight a continued focus on product innovation and market adaptation. Industry stakeholders are increasingly exploring partnerships to enhance product offerings and address emerging market needs. Moreover, there is a notable trend towards the incorporation of digital technologies in material handling solutions, which aims to improve operational efficiency. Companies are also engaging in sustainability initiatives by developing eco-friendly products to meet changing consumer preferences. Overall, these trends suggest a vibrant industry landscape, poised for significant advancements and market responsiveness.
Indonesia Hand Carts & Trolleys Market - Key Attractiveness of the Report
- 10 Years of Market Numbers
- Historical Data Starting from 2022 to 2025
- Base Year: 2025
- Forecast Data until 2032
- Key Performance Indicators Impacting the Market
- Major Upcoming Developments and Projects
Key Highlights of the Report:
- Indonesia Hand Carts & Trolleys Market Outlook
- Market Size of Indonesia Hand Carts & Trolleys Market, 2025
- Forecast of Indonesia Hand Carts & Trolleys Market, 2032F
- Historical Data and Forecast of Indonesia Hand Carts & Trolleys Revenues & Volume for the Period 2022-2032F
- Indonesia Hand Carts & Trolleys Market Trend Evolution
- Indonesia Hand Carts & Trolleys Market Drivers and Challenges
- Indonesia Hand Carts & Trolleys Price Trends
- Indonesia Hand Carts & Trolleys Porter's Five Forces
- Indonesia Hand Carts & Trolleys Industry Life Cycle
- Historical Data and Forecast of Indonesia Hand Carts & Trolleys Market Revenues & Volume By Types for the Period 2022-2032F
- Historical Data and Forecast of Indonesia Hand Carts & Trolleys Market Revenues & Volume By Steel Hand Truck for the Period 2022-2032F
- Historical Data and Forecast of Indonesia Hand Carts & Trolleys Market Revenues & Volume By Aluminium Hand Truck for the Period 2022-2032F
- Historical Data and Forecast of Indonesia Hand Carts & Trolleys Market Revenues & Volume By Applications for the Period 2022-2032F
- Historical Data and Forecast of Indonesia Hand Carts & Trolleys Market Revenues & Volume By Online Sales for the Period 2022-2032F
- Historical Data and Forecast of Indonesia Hand Carts & Trolleys Market Revenues & Volume By Offline Sales for the Period 2022-2032F
- Indonesia Hand Carts & Trolleys Import Export Trade Statistics
- Market Opportunity Assessment By Types
- Market Opportunity Assessment By Applications
- Indonesia Hand Carts & Trolleys Top Companies Market Share
- Indonesia Hand Carts & Trolleys Competitive Benchmarking By Technical and Operational Parameters
- Indonesia Hand Carts & Trolleys Company Profiles
- Indonesia Hand Carts & Trolleys Key Strategic Recommendations
Frequently Asked Questions About the Market Study (FAQs):
The demand for hand carts and trolleys in Indonesia is driven by the growth of various industries, increasing disposable incomes, and the rapid expansion of the e-commerce sector.
Yes, challenges such as high initial deployment costs, slow consumer adoption of automated solutions, and economic fluctuations can impact market growth.
The government is investing in infrastructure and logistics improvements, promoting local manufacturing, and offering incentives for sustainable practices in material handling.
Recent trends include a focus on product innovation, sustainability, and the integration of digital technologies to enhance efficiency and market adaptation.
6Wresearch actively monitors the Indonesia Hand Carts & Trolleys Market and publishes its comprehensive annual report, highlighting emerging trends, growth drivers, revenue analysis, and forecast outlook. Our insights help businesses to make data-backed strategic decisions with ongoing market dynamics. Our analysts track relevent industries related to the Indonesia Hand Carts & Trolleys Market, allowing our clients with actionable intelligence and reliable forecasts tailored to emerging regional needs.
Yes, we provide customisation as per your requirements. To learn more, feel free to contact us on sales@6wresearch.com
1 Executive Summary |
2 Introduction |
2.1 Key Highlights of the Report |
2.2 Report Description |
2.3 Market Scope & Segmentation |
2.4 Research Methodology |
2.5 Assumptions |
3 Indonesia Hand Carts & Trolleys Market Overview |
3.1 Indonesia Country Macro Economic Indicators |
3.2 Indonesia Hand Carts & Trolleys Market Revenues & Volume, 2022 & 2032F |
3.3 Indonesia Hand Carts & Trolleys Market - Industry Life Cycle |
3.4 Indonesia Hand Carts & Trolleys Market - Porter's Five Forces |
3.5 Indonesia Hand Carts & Trolleys Market Revenues & Volume Share, By Types, 2022 & 2032F |
3.6 Indonesia Hand Carts & Trolleys Market Revenues & Volume Share, By Applications, 2022 & 2032F |
4 Indonesia Hand Carts & Trolleys Market Dynamics |
4.1 Impact Analysis |
4.2 Market Drivers |
4.3 Market Restraints |
5 Indonesia Hand Carts & Trolleys Market Trends |
6 Indonesia Hand Carts & Trolleys Market, By Types |
6.1 Indonesia Hand Carts & Trolleys Market, By Types |
6.1.1 Overview and Analysis |
6.1.2 Indonesia Hand Carts & Trolleys Market Revenues & Volume, By Types, 2022-2032F |
6.1.3 Indonesia Hand Carts & Trolleys Market Revenues & Volume, By Steel Hand Truck, 2022-2032F |
6.1.4 Indonesia Hand Carts & Trolleys Market Revenues & Volume, By Aluminium Hand Truck, 2022-2032F |
6.2 Indonesia Hand Carts & Trolleys Market, By Applications |
6.2.1 Overview and Analysis |
6.2.2 Indonesia Hand Carts & Trolleys Market Revenues & Volume, By Online Sales, 2022-2032F |
6.2.3 Indonesia Hand Carts & Trolleys Market Revenues & Volume, By Offline Sales, 2022-2032F |
7 Indonesia Hand Carts & Trolleys Market Import-Export Trade Statistics |
7.1 Indonesia Hand Carts & Trolleys Market Export to Major Countries |
7.2 Indonesia Hand Carts & Trolleys Market Imports from Major Countries |
8 Indonesia Hand Carts & Trolleys Market Key Performance Indicators |
9 Indonesia Hand Carts & Trolleys Market - Opportunity Assessment |
9.1 Indonesia Hand Carts & Trolleys Market Opportunity Assessment, By Types, 2022 & 2032F |
9.2 Indonesia Hand Carts & Trolleys Market Opportunity Assessment, By Applications, 2022 & 2032F |
10 Indonesia Hand Carts & Trolleys Market - Competitive Landscape |
10.1 Indonesia Hand Carts & Trolleys Market Revenue Share, By Companies, 2025 |
10.2 Indonesia Hand Carts & Trolleys Market Competitive Benchmarking, By Operating and Technical Parameters |
11 Company Profiles |
12 Recommendations |
13 Disclaimer |
Global Go To Market Strategy - 2030
Export potential enables firms to identify high-growth global markets with greater confidence by combining advanced trade intelligence with a structured quantitative methodology. The framework analyzes emerging demand trends and country-level import patterns while integrating macroeconomic and trade datasets such as GDP and population forecasts, bilateral import–export flows, tariff structures, elasticity differentials between developed and developing economies, geographic distance, and import demand projections. Using weighted trade values from 2020–2024 as the base period to project country-to-country export potential for 2030, these inputs are operationalized through calculated drivers such as gravity model parameters, tariff impact factors, and projected GDP per-capita growth. Through an analysis of hidden potentials, demand hotspots, and market conditions that are most favorable to success, this method enables firms to focus on target countries, maximize returns, and global expansion with data, backed by accuracy.
By factoring in the projected importer demand gap that is currently unmet and could be potential opportunity, it identifies the potential for the Exporter (Country) among 190 countries, against the general trade analysis, which identifies the biggest importer or exporter.
To discover high-growth global markets and optimize your business strategy:
Click Here
Pricing
- Single User License$ 1,995
- Department License$ 2,400
- Site License$ 3,120
- Global License$ 3,795

Leadership Perspectives from Industry Events
Search
Thought Leadership and Analyst Meet


Our Clients
6WResearch In News
- India Export Attractiveness Tracker 2026
- India Air Conditioner Market Set for Strong Rebound in 2026 After Weather-Led Correction and GST-Driven Recovery: 6Wresearch
- ADAS in India: How Automatic Emergency Braking, Blind Spot Detection & Driver Monitoring are Transforming Road Safety
- Doha a strategic location for EV manufacturing hub: IPA Qatar
- Demand for luxury TVs surging in the GCC, says Samsung
- Empowering Growth: The Thriving Journey of Bangladesh’s Cable Industry
Latest Reports
- Greece Insulated Sandwich Panels Market (2026-2032)
- Qatar Access and Home Network Market (2026-2032)
- Nicaragua RPG Gaming Market (2026-2032)
- New Zealand RPG Gaming Market (2026-2032)
- Netherlands RPG Gaming Market (2026-2032)
- Nauru RPG Gaming Market (2026-2032)
- Namibia RPG Gaming Market (2026-2032)
- Mozambique RPG Gaming Market (2026-2032)
- Montenegro RPG Gaming Market (2026-2032)
- Mongolia RPG Gaming Market (2026-2032)
Industry Events and Analyst Meet

EV India Expo 2026

HIMTEX 2026

India Refining Summit 2026

India EV Show 2026

EV tech India Expo 2026
Whitepaper
- Middle East & Africa Commercial Security Market Click here to view more.
- Middle East & Africa Fire Safety Systems & Equipment Market Click here to view more.
- GCC Drone Market Click here to view more.
- Middle East Lighting Fixture Market Click here to view more.
- GCC Physical & Perimeter Security Market Click here to view more.