Indonesia Moisture measurement Instruments Market (2026-2032) | Industry, Analysis, Value, Companies, Forecast, Trends, Growth, Outlook, Share, Revenue & Size
Market Forecast By Type (Halogen Moisture Tester, Karl Fischer Moisture Meter, Portable Moisture Meter), By Applications (Food Industry, Medical Industry, Electronics Industry, Other) And Competitive Landscape
| Product Code: ETC033528 | Publication Date: Jul 2023 | Updated Date: Jun 2026 | Product Type: Report | |
| Publisher: 6Wresearch | Author: Ravi Bhandari | No. of Pages: 70 | No. of Figures: 35 | No. of Tables: 5 |
Indonesia Moisture measurement Instruments Market Summary
The indonesia moisture measurement instruments market was estimated at USD 244 Million in 2025 and is projected to reach USD 323 Million by 2032, growing at a CAGR of 5.4% from 2026 to 2032.
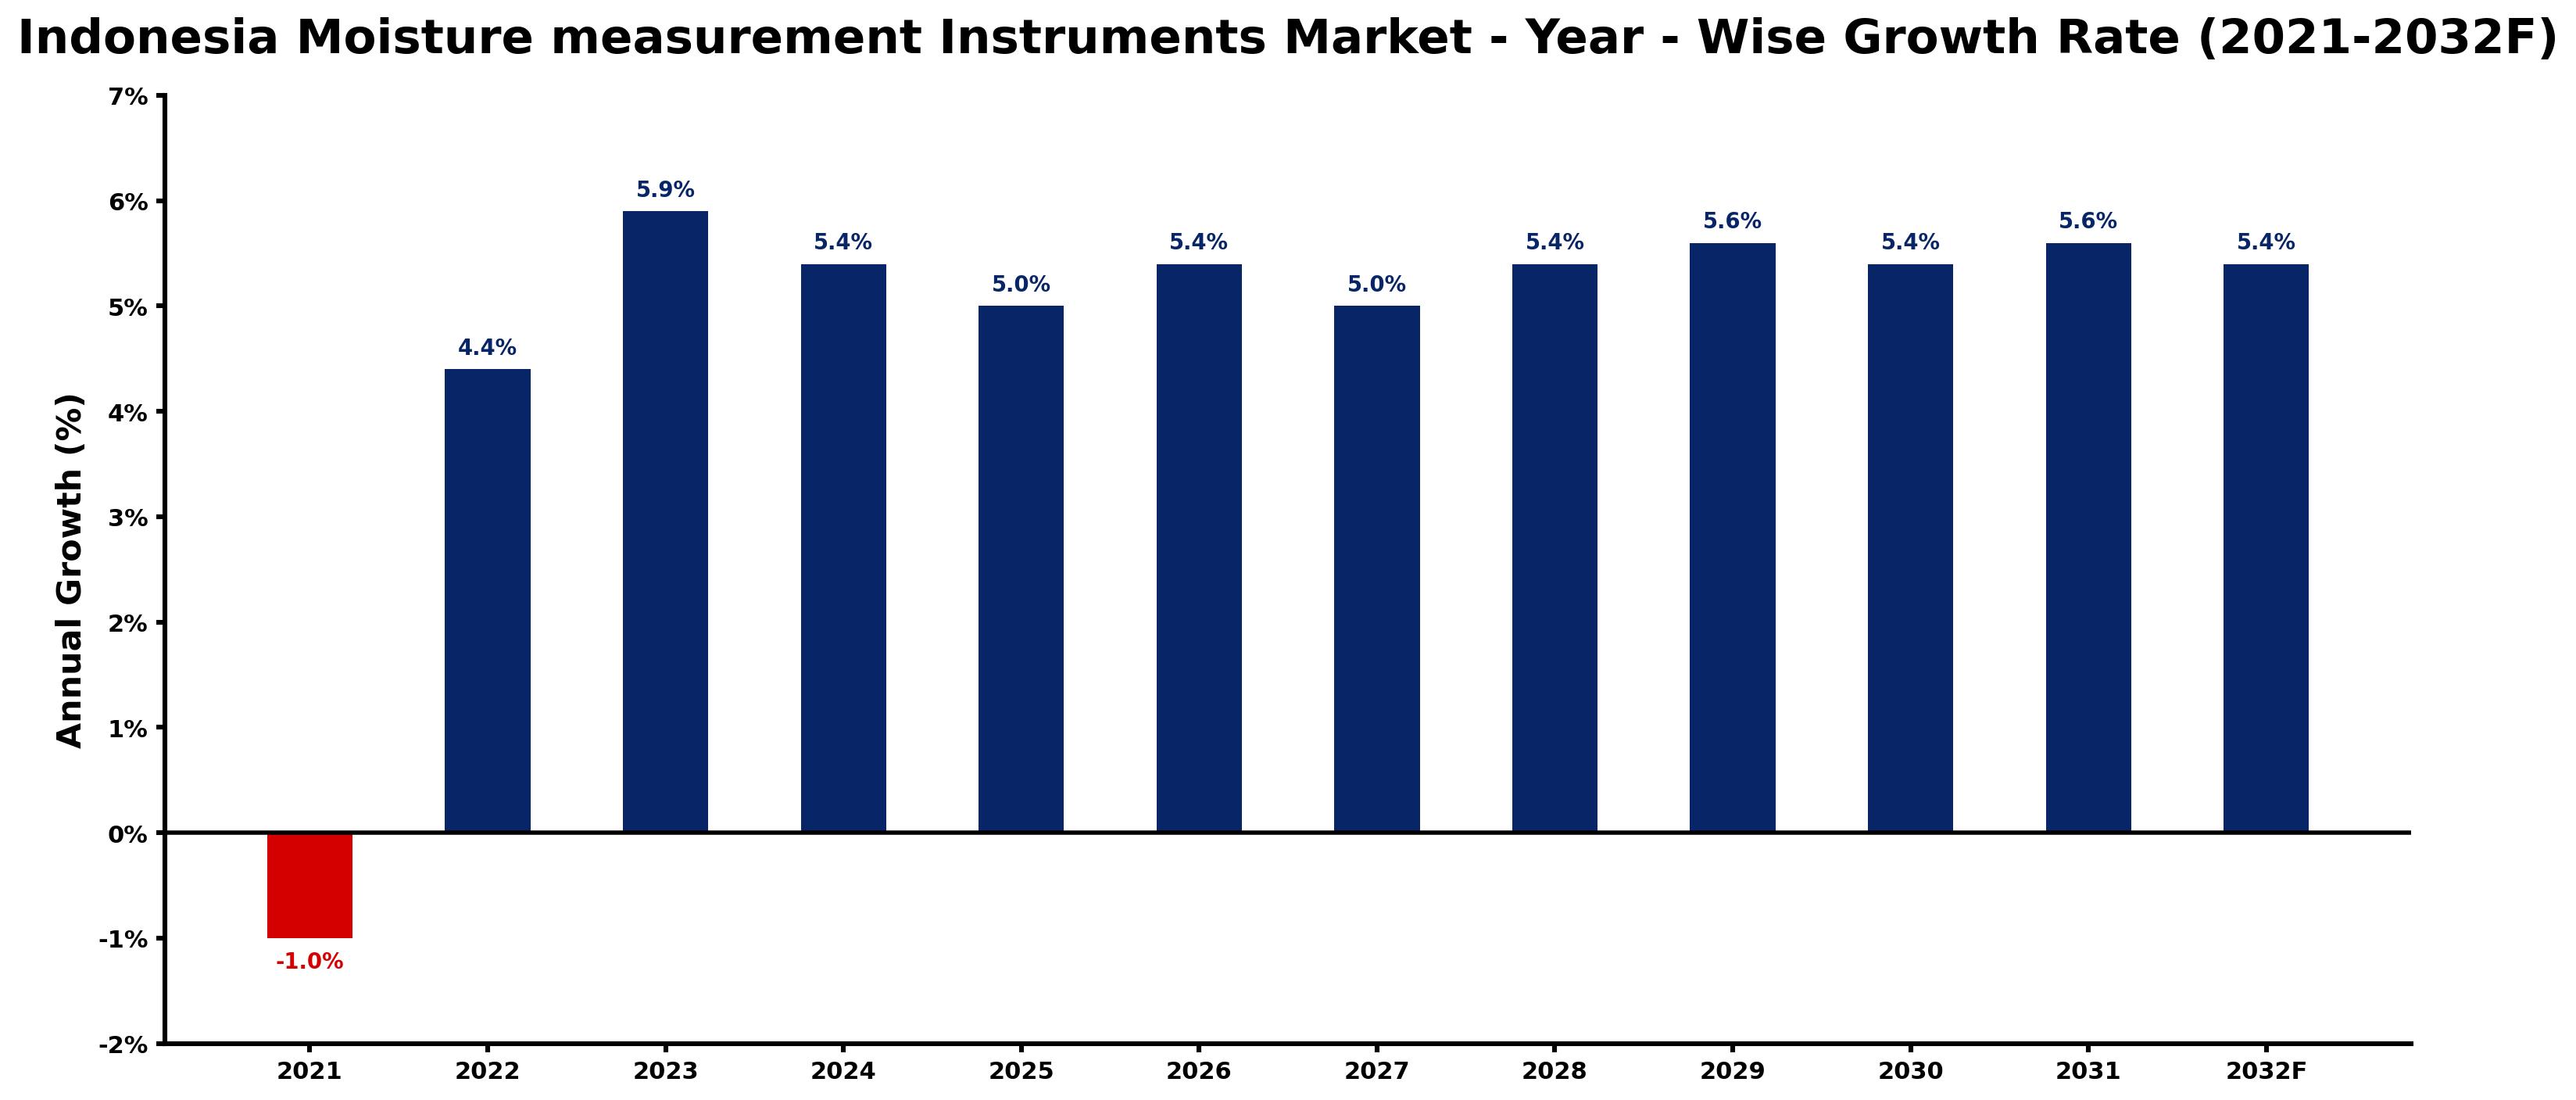
Indonesia Moisture measurement Instruments Market Growth Rate Analysis (2021-2032)
The Indonesia Moisture Measurement Instruments Market has experienced a notable rebound following a contraction of 1.0% in 2021, largely due to pandemic-related disruptions. As the economy stabilized, the market grew by 4.4% in 2022, fueled by increased agricultural production demands and investments in advanced technology. This upward trend accelerated to 5.9% in 2023, supported by heightened consumer awareness regarding moisture management in food and material preservation. Forecasts indicate continued growth, with anticipated rates around 5.4% to 5.6% over the next several years. Enhanced infrastructure initiatives and a commitment to energy transition further bolster the market, reflecting a robust demand for precise moisture measurement solutions across various sectors in Indonesia.
Indonesia Moisture measurement Instruments Market Year-wise Growth Rate and Key Drivers
This graph highlights how the Indonesia Moisture measurement Instruments Market has steadily grown over the past five years, supported by major growth factors.
The table below presents the year wise growth rates along with the key drivers influencing the market
| Year | Growth Rate | Major Drivers |
| 2021 | -1.0% | Supply chain disruptions during the pandemic hindered equipment availability, leading to decreased investment in moisture measurement technologies. |
| 2022 | 4.4% | Increased investment in food processing industries drives moisture measurement demand significantly. |
| 2023 | 5.9% | Technological innovations enhance product performance, attracting more industrial sector interest. |
| 2024 | 5.4% | Sustainable practices in agriculture create a niche for advanced measurement solutions. |
| 2025 | 5.0% | Rising awareness of quality control in exports boosts moisture instrument usage. |
| 2026 | 5.4% | Growing environmental concerns lead to tighter standards on moisture retention in goods. |
| 2027 | 5.0% | Emergence of smart farming concepts supports demand for integrated moisture measurement tools. |
| 2028 | 5.4% | Expansion of e-commerce necessitates precise logistics, fueling moisture accuracy requirements. |
| 2029 | 5.6% | Investments in supply chain efficiency highlight the importance of accurate moisture detection. |
| 2030 | 5.4% | Sustained urbanization correlates with increased need for building material moisture testing. |
| 2031 | 5.6% | Collaboration between tech firms and agriculture enhances moisture measurement's technological landscape. |
| 2032 | 5.4% | Global partnerships foster knowledge transfer, increasing innovation within Indonesia's moisture sector. |
Note - Market size estimations and growth projections presented in this report are based on 6Wresearch's advanced forecasting approach, validated with industry datasets as of June 2026.
Indonesia Moisture measurement Instruments Market Synopsis
The Indonesia Moisture measurement Instruments Market is projected to reach 5.4% and witness significant growth during the forecast period (2026-2032). This projected expansion is largely driven by the increasing demand for advanced moisture measurement technologies as industries recognize the critical role these instruments play in ensuring product quality and operational efficiency. As environmental awareness grows, industries are also shifting towards more sustainable practices, further propelling the demand for effective moisture control solutions.
Indonesia Moisture measurement Instruments Market Growth Drivers
Several key factors are contributing to the growth of the Indonesia Moisture measurement Instruments Market:
- The surge in industrialization across Indonesia has created a parallel demand for moisture measurement instruments, particularly in sectors like food processing, textiles, and woodworking, where precision is paramount.
- Rapid urbanization is increasing consumer spending on smart home solutions, fostering an environment conducive to the adoption of moisture measurement technologies that regulate humidity and temperature accurately.
- Technological advancements, particularly in miniaturized electronic sensors, have made moisture measurement both more cost-effective and user-friendly, enabling broader application across various industries.
- Heightened awareness regarding environmental sustainability is prompting companies to invest in moisture measurement instruments to minimize waste and optimize resource use during production processes.
- Government initiatives aimed at enhancing industry standards are driving manufacturers to seek advanced moisture measurement solutions to comply with regulatory requirements.
Indonesia Moisture measurement Instruments Market Challenges and Restraints
Despite the positive outlook, the Indonesia Moisture measurement Instruments Market faces several challenges:
- High initial investment costs associated with advanced moisture measurement technologies can deter smaller businesses from making the switch from traditional methods.
- The lack of awareness regarding the benefits of modern moisture measurement instruments can result in slow adoption rates in certain industries.
- Intense competition among manufacturers may lead to price wars, affecting the profitability of companies in the market.
- Technological advancements also require continuous investment in training personnel, which can be a burden for companies with limited resources.
- Market fluctuations and economic uncertainty can impact investment in new technologies, causing delays in procurement and implementation.
Indonesia Moisture measurement Instruments Market Government Investment and Initiatives
The Indonesian government is actively promoting the development of industries that utilize moisture measurement instruments through various initiatives and investments:
- Government policies aimed at enhancing industrial efficiency and sustainability are fostering an environment conducive to investments in moisture measurement technologies.
- Public spending on infrastructure projects is expected to incorporate advanced moisture management solutions, particularly in the food processing and agriculture sectors.
- Incentives for companies adopting eco-friendly technologies are encouraging investments in moisture measurement systems that contribute to reduced wastage and environmental impact.
- Collaborative efforts between the government and private sector aim to enhance research and development relating to moisture measurement technologies.
- Training and development programs sponsored by the government are being introduced to ensure that skilled talent is available to support the growth of this sector.
Indonesia Moisture measurement Instruments Market Latest Developments (May 2025 - June 2026)
Recent trends in the Indonesia Moisture measurement Instruments Market from May 2025 to June 2026 indicate a heightened focus on innovations and applications:
- Advancements in wireless sensor technologies are reshaping the landscape, allowing for real-time monitoring and data analytics that streamline moisture management processes.
- Emerging collaborations between tech companies and traditional manufacturing industries are leading to tailored moisture measurement solutions that meet specific industry needs.
- Increasing research activities in moisture measurement are resulting in the development of more sophisticated instruments capable of operating under extreme conditions.
- Conferences and industry exhibitions showcasing the latest moisture measurement technologies are gaining traction, promoting awareness and interest across various sectors.
- Enhanced regulatory frameworks are being established, which encourage the adoption of advanced monitoring technologies to align with global standards in product quality.
Indonesia Moisture measurement Instruments Market - Key Attractiveness of the Report
- 10 Years of Market Numbers
- Historical Data Starting from 2022 to 2025
- Base Year: 2025
- Forecast Data until 2032
- Key Performance Indicators Impacting the Market
- Major Upcoming Developments and Projects
Key Highlights of the Report:
- Indonesia Moisture measurement Instruments Market Outlook
- Market Size of Indonesia Moisture measurement Instruments Market, 2025
- Forecast of Indonesia Moisture measurement Instruments Market, 2032F
- Historical Data and Forecast of Indonesia Moisture measurement Instruments Revenues & Volume for the Period 2022-2032F
- Indonesia Moisture measurement Instruments Market Trend Evolution
- Indonesia Moisture measurement Instruments Market Drivers and Challenges
- Indonesia Moisture measurement Instruments Price Trends
- Indonesia Moisture measurement Instruments Porter's Five Forces
- Indonesia Moisture measurement Instruments Industry Life Cycle
- Historical Data and Forecast of Indonesia Moisture measurement Instruments Market Revenues & Volume By Type for the Period 2022-2032F
- Historical Data and Forecast of Indonesia Moisture measurement Instruments Market Revenues & Volume By Halogen Moisture Tester for the Period 2022-2032F
- Historical Data and Forecast of Indonesia Moisture measurement Instruments Market Revenues & Volume By Karl Fischer Moisture Meter for the Period 2022-2032F
- Historical Data and Forecast of Indonesia Moisture measurement Instruments Market Revenues & Volume By Portable Moisture Meter for the Period 2022-2032F
- Historical Data and Forecast of Indonesia Moisture measurement Instruments Market Revenues & Volume By Applications for the Period 2022-2032F
- Historical Data and Forecast of Indonesia Moisture measurement Instruments Market Revenues & Volume By Food Industry for the Period 2022-2032F
- Historical Data and Forecast of Indonesia Moisture measurement Instruments Market Revenues & Volume By Medical Industry for the Period 2022-2032F
- Historical Data and Forecast of Indonesia Moisture measurement Instruments Market Revenues & Volume By Electronics Industry for the Period 2022-2032F
- Historical Data and Forecast of Indonesia Moisture measurement Instruments Market Revenues & Volume By Other for the Period 2022-2032F
- Indonesia Moisture measurement Instruments Import Export Trade Statistics
- Market Opportunity Assessment By Type
- Market Opportunity Assessment By Applications
- Indonesia Moisture measurement Instruments Top Companies Market Share
- Indonesia Moisture measurement Instruments Competitive Benchmarking By Technical and Operational Parameters
- Indonesia Moisture measurement Instruments Company Profiles
- Indonesia Moisture measurement Instruments Key Strategic Recommendations
Frequently Asked Questions About the Market Study (FAQs):
Moisture measurement instruments are primarily used in the textile, food processing, woodworking, agriculture, and construction industries to ensure product quality and optimize processes.
Urbanization increases consumer spending and the adoption of smart products, thereby driving demand for moisture measurement solutions that enhance comfort and efficiency in various applications.
Government policies focused on industrial efficiency and sustainability promote investment in advanced moisture measurement technologies, aligning with environmental sustainability goals.
Challenges include high initial costs, lack of awareness about modern technologies, and market competition, which can hinder widespread adoption and investment.
6Wresearch actively monitors the Indonesia Moisture measurement Instruments Market and publishes its comprehensive annual report, highlighting emerging trends, growth drivers, revenue analysis, and forecast outlook. Our insights help businesses to make data-backed strategic decisions with ongoing market dynamics. Our analysts track relevent industries related to the Indonesia Moisture measurement Instruments Market, allowing our clients with actionable intelligence and reliable forecasts tailored to emerging regional needs.
Yes, we provide customisation as per your requirements. To learn more, feel free to contact us on sales@6wresearch.com
1 Executive Summary |
2 Introduction |
2.1 Key Highlights of the Report |
2.2 Report Description |
2.3 Market Scope & Segmentation |
2.4 Research Methodology |
2.5 Assumptions |
3 Indonesia Moisture measurement Instruments Market Overview |
3.1 Indonesia Country Macro Economic Indicators |
3.2 Indonesia Moisture measurement Instruments Market Revenues & Volume, 2022 & 2032F |
3.3 Indonesia Moisture measurement Instruments Market - Industry Life Cycle |
3.4 Indonesia Moisture measurement Instruments Market - Porter's Five Forces |
3.5 Indonesia Moisture measurement Instruments Market Revenues & Volume Share, By Type, 2022 & 2032F |
3.6 Indonesia Moisture measurement Instruments Market Revenues & Volume Share, By Applications, 2022 & 2032F |
4 Indonesia Moisture measurement Instruments Market Dynamics |
4.1 Impact Analysis |
4.2 Market Drivers |
4.3 Market Restraints |
5 Indonesia Moisture measurement Instruments Market Trends |
6 Indonesia Moisture measurement Instruments Market, By Types |
6.1 Indonesia Moisture measurement Instruments Market, By Type |
6.1.1 Overview and Analysis |
6.1.2 Indonesia Moisture measurement Instruments Market Revenues & Volume, By Type, 2022-2032F |
6.1.3 Indonesia Moisture measurement Instruments Market Revenues & Volume, By Halogen Moisture Tester, 2022-2032F |
6.1.4 Indonesia Moisture measurement Instruments Market Revenues & Volume, By Karl Fischer Moisture Meter, 2022-2032F |
6.1.5 Indonesia Moisture measurement Instruments Market Revenues & Volume, By Portable Moisture Meter, 2022-2032F |
6.2 Indonesia Moisture measurement Instruments Market, By Applications |
6.2.1 Overview and Analysis |
6.2.2 Indonesia Moisture measurement Instruments Market Revenues & Volume, By Food Industry, 2022-2032F |
6.2.3 Indonesia Moisture measurement Instruments Market Revenues & Volume, By Medical Industry, 2022-2032F |
6.2.4 Indonesia Moisture measurement Instruments Market Revenues & Volume, By Electronics Industry, 2022-2032F |
6.2.5 Indonesia Moisture measurement Instruments Market Revenues & Volume, By Other, 2022-2032F |
7 Indonesia Moisture measurement Instruments Market Import-Export Trade Statistics |
7.1 Indonesia Moisture measurement Instruments Market Export to Major Countries |
7.2 Indonesia Moisture measurement Instruments Market Imports from Major Countries |
8 Indonesia Moisture measurement Instruments Market Key Performance Indicators |
9 Indonesia Moisture measurement Instruments Market - Opportunity Assessment |
9.1 Indonesia Moisture measurement Instruments Market Opportunity Assessment, By Type, 2022 & 2032F |
9.2 Indonesia Moisture measurement Instruments Market Opportunity Assessment, By Applications, 2022 & 2032F |
10 Indonesia Moisture measurement Instruments Market - Competitive Landscape |
10.1 Indonesia Moisture measurement Instruments Market Revenue Share, By Companies, 2025 |
10.2 Indonesia Moisture measurement Instruments Market Competitive Benchmarking, By Operating and Technical Parameters |
11 Company Profiles |
12 Recommendations |
13 Disclaimer |
Global Go To Market Strategy - 2030
Export potential enables firms to identify high-growth global markets with greater confidence by combining advanced trade intelligence with a structured quantitative methodology. The framework analyzes emerging demand trends and country-level import patterns while integrating macroeconomic and trade datasets such as GDP and population forecasts, bilateral import–export flows, tariff structures, elasticity differentials between developed and developing economies, geographic distance, and import demand projections. Using weighted trade values from 2020–2024 as the base period to project country-to-country export potential for 2030, these inputs are operationalized through calculated drivers such as gravity model parameters, tariff impact factors, and projected GDP per-capita growth. Through an analysis of hidden potentials, demand hotspots, and market conditions that are most favorable to success, this method enables firms to focus on target countries, maximize returns, and global expansion with data, backed by accuracy.
By factoring in the projected importer demand gap that is currently unmet and could be potential opportunity, it identifies the potential for the Exporter (Country) among 190 countries, against the general trade analysis, which identifies the biggest importer or exporter.
To discover high-growth global markets and optimize your business strategy:
Click Here
Pricing
- Single User License$ 1,995
- Department License$ 2,400
- Site License$ 3,120
- Global License$ 3,795

Leadership Perspectives from Industry Events
Search
Thought Leadership and Analyst Meet


Our Clients
6WResearch In News
- India Air Conditioner Market Set for Strong Rebound in 2026 After Weather-Led Correction and GST-Driven Recovery: 6Wresearch
- ADAS in India: How Automatic Emergency Braking, Blind Spot Detection & Driver Monitoring are Transforming Road Safety
- Doha a strategic location for EV manufacturing hub: IPA Qatar
- Demand for luxury TVs surging in the GCC, says Samsung
- Empowering Growth: The Thriving Journey of Bangladesh’s Cable Industry
- Demand for luxury TVs surging in the GCC, says Samsung
Latest Reports
- Poland Fire Protection Systems Market (2026-2032)
- Cape Verde Portable Hand-Thrown Extinguisher Market (2026-2032)
- Canada Portable Hand-Thrown Extinguisher Market (2026-2032)
- Cameroon Portable Hand-Thrown Extinguisher Market (2026-2032)
- Burundi Portable Hand-Thrown Extinguisher Market (2026-2032)
- Burkina Faso Portable Hand-Thrown Extinguisher Market (2026-2032)
- Bulgaria Portable Hand-Thrown Extinguisher Market (2026-2032)
- Brunei Portable Hand-Thrown Extinguisher Market (2026-2032)
- Botswana Portable Hand-Thrown Extinguisher Market (2026-2032)
- Bosnia and Herzegovina Portable Hand-Thrown Extinguisher Market (2026-2032)
Industry Events and Analyst Meet

HIMTEX 2026

India Refining Summit 2026

India EV Show 2026

EV tech India Expo 2026

Auto Tech Asia 2026
Whitepaper
- Middle East & Africa Commercial Security Market Click here to view more.
- Middle East & Africa Fire Safety Systems & Equipment Market Click here to view more.
- GCC Drone Market Click here to view more.
- Middle East Lighting Fixture Market Click here to view more.
- GCC Physical & Perimeter Security Market Click here to view more.