Indonesia Optical Projector Market (2026-2032) Outlook | Growth, Revenue, Forecast, Trends, Industry, Value, Share, Size, Companies & Analysis
Market Forecast By Type (Digital Light Processing (DLP), Liquid Crystal Display (LCD), Liquid Crystal on Silicon (LCoS)), By Application (Residential, Commercial, Industrial) And Competitive Landscape
| Product Code: ETC267988 | Publication Date: Aug 2023 | Updated Date: Mar 2026 | Product Type: Market Research Report | |
| Publisher: 6Wresearch | Author: Ravi Bhandari | No. of Pages: 75 | No. of Figures: 35 | No. of Tables: 20 |
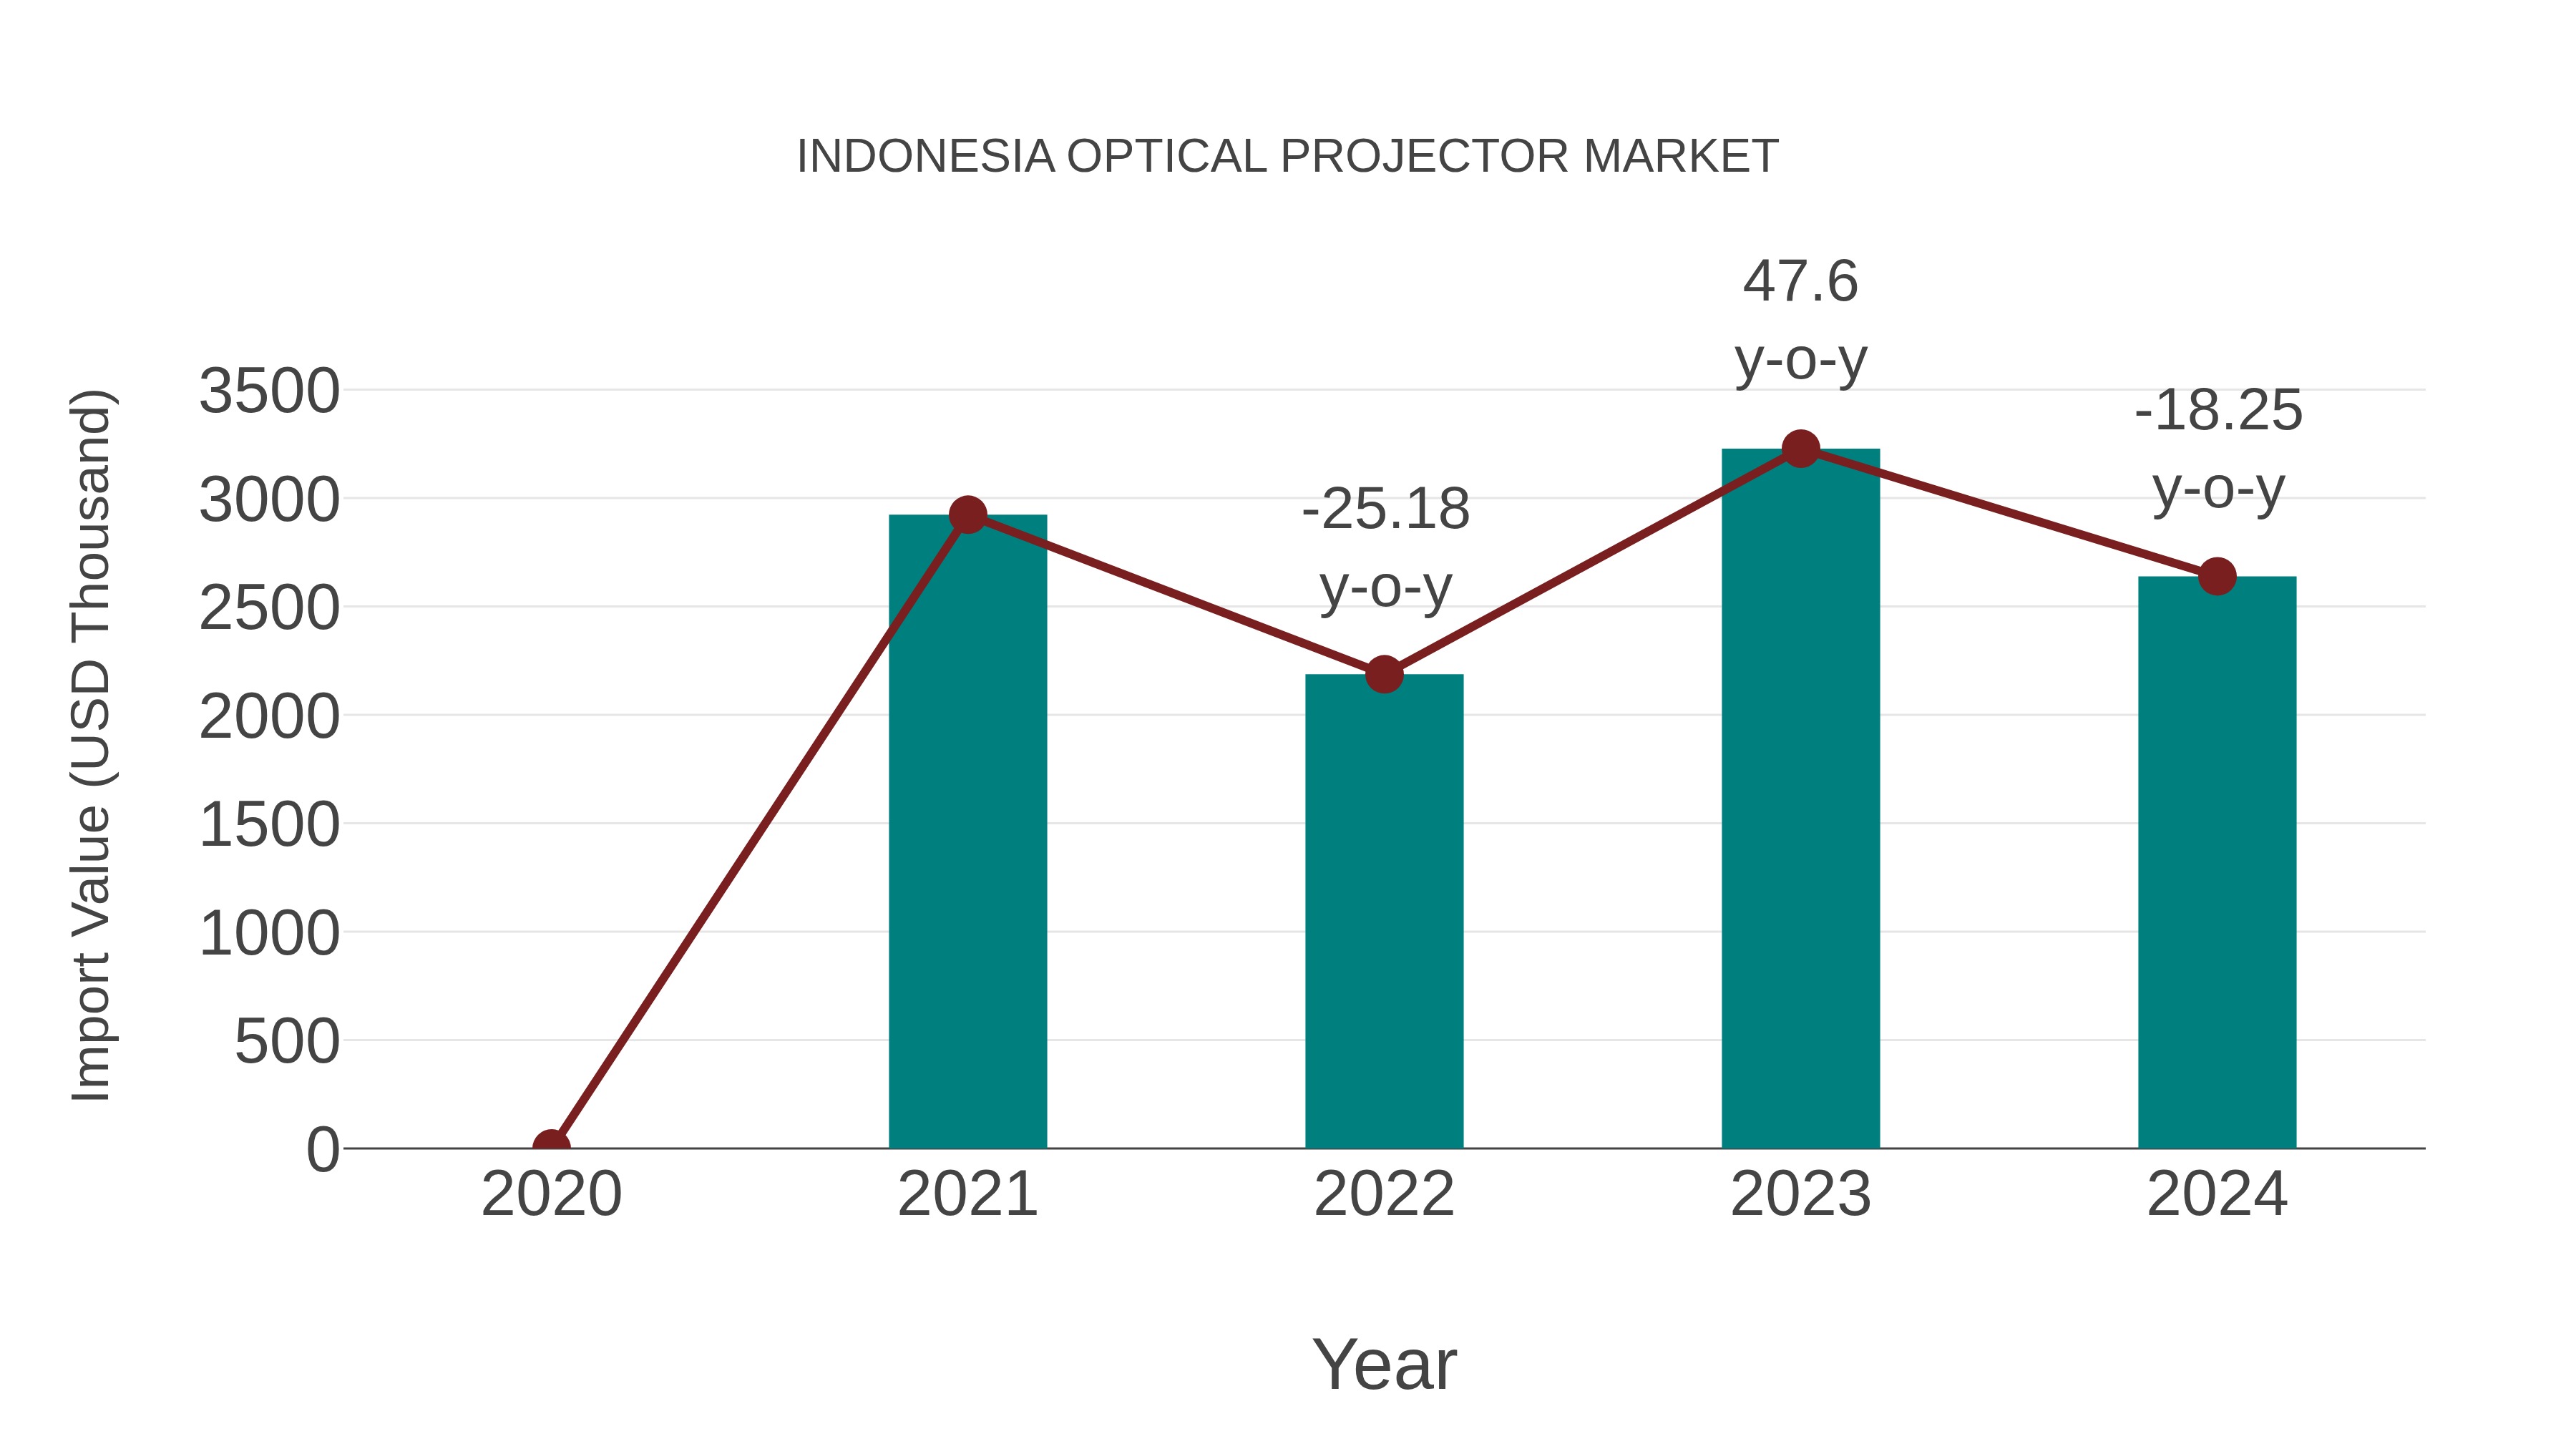
Indonesia Optical Projector Market: Import Trend Analysis
In the Indonesia optical projector market, import trends experienced a decline from 2023 to 2024, with a growth rate of -18.25%. The compound annual growth rate (CAGR) for imports from 2020 to 2024 stood at -3.35%. This negative momentum could be attributed to shifting demand patterns or changes in trade policies affecting market stability.
Indonesia Optical Projector Market Synopsis
The optical projector market in Indonesia has been growing rapidly over the past few years due to increased investment by overseas manufacturers in local production lines as well as an overall rise in spending on digitalization initiatives across various industries such as education, business meetings and entertainment applications among others. In 2025, the optical projector sales revenue reached USD 430 million showing a year-on-year growth of 5. 1%. The key players operating in this space include ViewSonic Corporation, Epson Corporation and BenQ Corporation etc. , which accounted for more than half of the total market share.
Drivers of the Market
The Indonesia Oven Bag Market has been influenced by changing cooking habits and the pursuit of convenient cooking solutions. As more consumers seek time-saving and mess-free cooking methods, oven bags have gained popularity, catering to modern lifestyles.
Challenges of the Market
The optical projector market encounters competition from other visual display technologies and the need to offer enhanced features for diverse applications. The oven bag market tackles issues related to food safety, convenience, and environmental impact, driving the need for innovative materials and production methods.
COVID-19 Impact on the Market
The Indonesia Optical Projector Market saw a surge in demand from the education and entertainment sectors as remote learning and home entertainment gained prominence. However, supply chain interruptions and limitations in manufacturing capacities affected market growth.
Key Highlights of the Report:
- Indonesia Optical Projector Market Outlook
- Market Size of Indonesia Optical Projector Market, 2025
- Forecast of Indonesia Optical Projector Market, 2032
- Historical Data and Forecast of Indonesia Optical Projector Revenues & Volume for the Period 2022-2032F
- Indonesia Optical Projector Market Trend Evolution
- Indonesia Optical Projector Market Drivers and Challenges
- Indonesia Optical Projector Price Trends
- Indonesia Optical Projector Porter's Five Forces
- Indonesia Optical Projector Industry Life Cycle
- Historical Data and Forecast of Indonesia Optical Projector Market Revenues & Volume By Type for the Period 2022-2032F
- Historical Data and Forecast of Indonesia Optical Projector Market Revenues & Volume By Digital Light Processing (DLP) for the Period 2022-2032F
- Historical Data and Forecast of Indonesia Optical Projector Market Revenues & Volume By Liquid Crystal Display (LCD) for the Period 2022-2032F
- Historical Data and Forecast of Indonesia Optical Projector Market Revenues & Volume By Liquid Crystal on Silicon (LCoS) for the Period 2022-2032F
- Historical Data and Forecast of Indonesia Optical Projector Market Revenues & Volume By Application for the Period 2022-2032F
- Historical Data and Forecast of Indonesia Optical Projector Market Revenues & Volume By Residential for the Period 2022-2032F
- Historical Data and Forecast of Indonesia Optical Projector Market Revenues & Volume By Commercial for the Period 2022-2032F
- Historical Data and Forecast of Indonesia Optical Projector Market Revenues & Volume By Industrial for the Period 2022-2032F
- Indonesia Optical Projector Import Export Trade Statistics
- Market Opportunity Assessment By Type
- Market Opportunity Assessment By Application
- Indonesia Optical Projector Top Companies Market Share
- Indonesia Optical Projector Competitive Benchmarking By Technical and Operational Parameters
- Indonesia Optical Projector Company Profiles
- Indonesia Optical Projector Key Strategic Recommendations
Indonesia Optical Projector Market (2026-2032): FAQs
6Wresearch actively monitors the Indonesia Optical Projector Market and publishes its comprehensive annual report, highlighting emerging trends, growth drivers, revenue analysis, and forecast outlook. Our insights help businesses to make data-backed strategic decisions with ongoing market dynamics. Our analysts track relevent industries related to the Indonesia Optical Projector Market, allowing our clients with actionable intelligence and reliable forecasts tailored to emerging regional needs.
Yes, we provide customisation as per your requirements. To learn more, feel free to contact us on sales@6wresearch.com
1 Executive Summary |
2 Introduction |
2.1 Key Highlights of the Report |
2.2 Report Description |
2.3 Market Scope & Segmentation |
2.4 Research Methodology |
2.5 Assumptions |
3 Indonesia Optical Projector Market Overview |
3.1 Indonesia Country Macro Economic Indicators |
3.2 Indonesia Optical Projector Market Revenues & Volume, 2022 & 2032F |
3.3 Indonesia Optical Projector Market - Industry Life Cycle |
3.4 Indonesia Optical Projector Market - Porter's Five Forces |
3.5 Indonesia Optical Projector Market Revenues & Volume Share, By Type, 2022 & 2032F |
3.6 Indonesia Optical Projector Market Revenues & Volume Share, By Application, 2022 & 2032F |
4 Indonesia Optical Projector Market Dynamics |
4.1 Impact Analysis |
4.2 Market Drivers |
4.2.1 Increasing demand for high-quality visual experiences in sectors like education, entertainment, and corporate presentations. |
4.2.2 Technological advancements leading to the development of more efficient and feature-rich optical projectors. |
4.2.3 Growing adoption of digitalization and multimedia content in various industries driving the need for optical projectors. |
4.3 Market Restraints |
4.3.1 High initial investment costs associated with purchasing optical projectors. |
4.3.2 Competition from alternative technologies such as LED screens and interactive whiteboards. |
4.3.3 Economic uncertainties impacting consumer spending on non-essential technologies like optical projectors. |
5 Indonesia Optical Projector Market Trends |
6 Indonesia Optical Projector Market, By Types |
6.1 Indonesia Optical Projector Market, By Type |
6.1.1 Overview and Analysis |
6.1.2 Indonesia Optical Projector Market Revenues & Volume, By Type, 2022-2032F |
6.1.3 Indonesia Optical Projector Market Revenues & Volume, By Digital Light Processing (DLP), 2022-2032F |
6.1.4 Indonesia Optical Projector Market Revenues & Volume, By Liquid Crystal Display (LCD), 2022-2032F |
6.1.5 Indonesia Optical Projector Market Revenues & Volume, By Liquid Crystal on Silicon (LCoS), 2022-2032F |
6.2 Indonesia Optical Projector Market, By Application |
6.2.1 Overview and Analysis |
6.2.2 Indonesia Optical Projector Market Revenues & Volume, By Residential, 2022-2032F |
6.2.3 Indonesia Optical Projector Market Revenues & Volume, By Commercial, 2022-2032F |
6.2.4 Indonesia Optical Projector Market Revenues & Volume, By Industrial, 2022-2032F |
7 Indonesia Optical Projector Market Import-Export Trade Statistics |
7.1 Indonesia Optical Projector Market Export to Major Countries |
7.2 Indonesia Optical Projector Market Imports from Major Countries |
8 Indonesia Optical Projector Market Key Performance Indicators |
8.1 Average selling price (ASP) of optical projectors in Indonesia. |
8.2 Adoption rate of optical projectors in key sectors like education, business, and entertainment. |
8.3 Number of new product launches and innovations in the optical projector market in Indonesia. |
8.4 Growth in the usage of high-resolution and interactive optical projectors in the Indonesian market. |
8.5 Customer satisfaction scores and feedback related to optical projector performance and features. |
9 Indonesia Optical Projector Market - Opportunity Assessment |
9.1 Indonesia Optical Projector Market Opportunity Assessment, By Type, 2022 & 2032F |
9.2 Indonesia Optical Projector Market Opportunity Assessment, By Application, 2022 & 2032F |
10 Indonesia Optical Projector Market - Competitive Landscape |
10.1 Indonesia Optical Projector Market Revenue Share, By Companies, 2025 |
10.2 Indonesia Optical Projector Market Competitive Benchmarking, By Operating and Technical Parameters |
11 Company Profiles |
12 Recommendations |
13 Disclaimer |
Global Go To Market Strategy - 2030
Export potential enables firms to identify high-growth global markets with greater confidence by combining advanced trade intelligence with a structured quantitative methodology. The framework analyzes emerging demand trends and country-level import patterns while integrating macroeconomic and trade datasets such as GDP and population forecasts, bilateral import–export flows, tariff structures, elasticity differentials between developed and developing economies, geographic distance, and import demand projections. Using weighted trade values from 2020–2024 as the base period to project country-to-country export potential for 2030, these inputs are operationalized through calculated drivers such as gravity model parameters, tariff impact factors, and projected GDP per-capita growth. Through an analysis of hidden potentials, demand hotspots, and market conditions that are most favorable to success, this method enables firms to focus on target countries, maximize returns, and global expansion with data, backed by accuracy.
By factoring in the projected importer demand gap that is currently unmet and could be potential opportunity, it identifies the potential for the Exporter (Country) among 190 countries, against the general trade analysis, which identifies the biggest importer or exporter.
To discover high-growth global markets and optimize your business strategy:
Click Here
Pricing
- Single User License$ 1,995
- Department License$ 2,400
- Site License$ 3,120
- Global License$ 3,795

Leadership Perspectives from Industry Events
Search
Thought Leadership and Analyst Meet


Our Clients
6WResearch In News
- India Air Conditioner Market Set for Strong Rebound in 2026 After Weather-Led Correction and GST-Driven Recovery: 6Wresearch
- ADAS in India: How Automatic Emergency Braking, Blind Spot Detection & Driver Monitoring are Transforming Road Safety
- Doha a strategic location for EV manufacturing hub: IPA Qatar
- Demand for luxury TVs surging in the GCC, says Samsung
- Empowering Growth: The Thriving Journey of Bangladesh’s Cable Industry
- Demand for luxury TVs surging in the GCC, says Samsung
Latest Reports
- Poland Fire Protection Systems Market (2026-2032)
- Cape Verde Portable Hand-Thrown Extinguisher Market (2026-2032)
- Canada Portable Hand-Thrown Extinguisher Market (2026-2032)
- Cameroon Portable Hand-Thrown Extinguisher Market (2026-2032)
- Burundi Portable Hand-Thrown Extinguisher Market (2026-2032)
- Burkina Faso Portable Hand-Thrown Extinguisher Market (2026-2032)
- Bulgaria Portable Hand-Thrown Extinguisher Market (2026-2032)
- Brunei Portable Hand-Thrown Extinguisher Market (2026-2032)
- Botswana Portable Hand-Thrown Extinguisher Market (2026-2032)
- Bosnia and Herzegovina Portable Hand-Thrown Extinguisher Market (2026-2032)
Industry Events and Analyst Meet

HIMTEX 2026

India Refining Summit 2026

India EV Show 2026

EV tech India Expo 2026

Auto Tech Asia 2026
Whitepaper
- Middle East & Africa Commercial Security Market Click here to view more.
- Middle East & Africa Fire Safety Systems & Equipment Market Click here to view more.
- GCC Drone Market Click here to view more.
- Middle East Lighting Fixture Market Click here to view more.
- GCC Physical & Perimeter Security Market Click here to view more.