Indonesia Toys & Games Market (2026-2032) | Value, Analysis, Size, Forecast, Companies, Outlook, Share, Revenue, Trends, Growth, Industry
Market Forecast By Product Type (Puzzles, Preschool Toys, Outdoor/Sports, Dolls, Video Games, Others), By Applications (0 - 8 Years, 8 - 15 Years, 15 Years & Above), By Distribution Channel (Offline, Online) And Competitive Landscape
| Product Code: ETC040029 | Publication Date: Jul 2023 | Updated Date: Jun 2026 | Product Type: Report | |
| Publisher: 6Wresearch | Author: Ravi Bhandari | No. of Pages: 70 | No. of Figures: 35 | No. of Tables: 5 |
Indonesia Toys & Games Market Summary
The indonesia toys & games market was estimated at USD 370 Million in 2025 and is projected to reach USD 489 Million by 2032, growing at a CAGR of 5.7% from 2026 to 2032.
Indonesia Toys & Games Market Year-wise Growth Rate and Key Drivers
This graph highlights how the Indonesia Toys & Games Market has steadily grown over the past five years, supported by major growth factors.
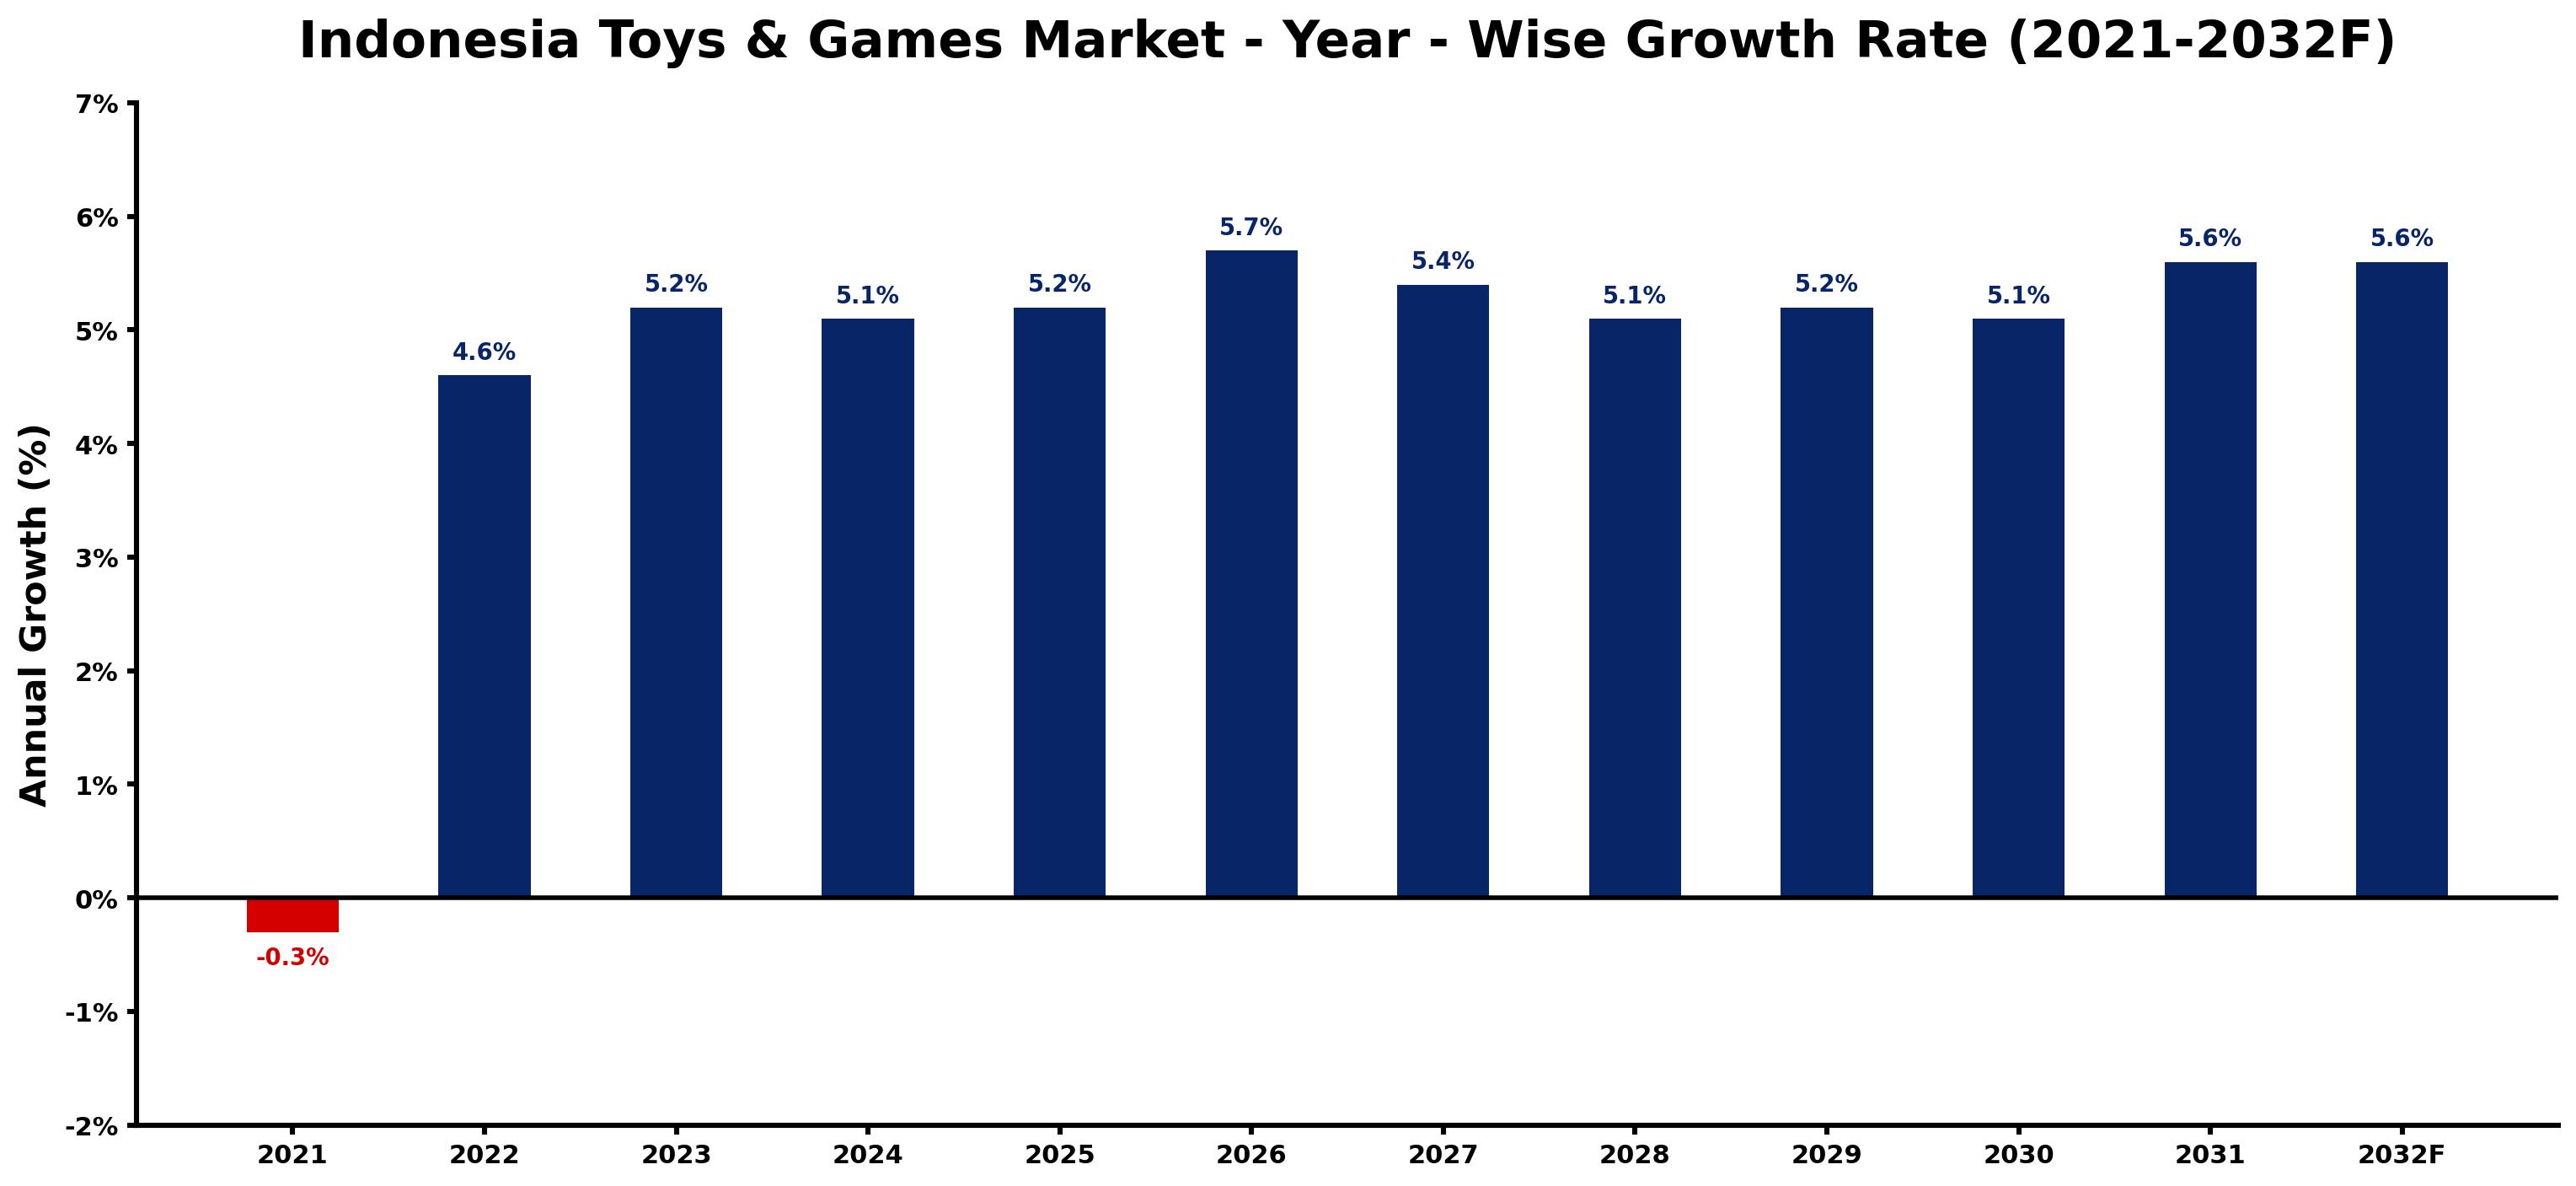
The table below presents the year wise growth rates along with the key drivers influencing the market
| Year | Growth Rate | Major Drivers |
| 2021 | -0.3% | Increased digital entertainment options diverted consumer spending away from traditional toys and games. |
| 2022 | 4.6% | E-commerce platforms expanded their reach, enabling toys to access remote areas efficiently. |
| 2023 | 5.2% | Regional manufacturing partnerships enhanced local toy production, improving supply chain resilience. |
| 2024 | 5.1% | Increasing disposable income levels drove interest in premium and educational toy options. |
| 2025 | 5.2% | Social media influencers began showcasing toys, significantly impacting purchasing decisions of parents. |
| 2026 | 5.7% | Emerging trends in sustainability encouraged eco-friendly toys, appealing to environmentally conscious consumers. |
| 2027 | 5.4% | Activity-based toys gained popularity as parents sought more interactive playtime solutions for children. |
| 2028 | 5.1% | Local festivals and cultural events began featuring traditional toys, boosting local craftsmanship awareness. |
| 2029 | 5.2% | Digital toys integrating augmented reality captured the imagination of tech-savvy children and parents. |
| 2030 | 5.1% | Investment in early childhood development programs highlighted the role of play in learning. |
| 2031 | 5.6% | Market consolidation among major toy brands reshaped competition, enhancing innovation and variety. |
| 2032 | 5.6% | Strengthening community engagements fostered local brands, creating a vibrant ecosystem of toy options. |
Note - Market size estimations and growth projections presented in this report are based on 6Wresearch's advanced forecasting approach, validated with industry datasets as of June 2026.
Indonesia Toys & Games Market Synopsis
The Indonesia Toys Games Market is projected to reach 5.7% and witness significant growth during the forecast period (2026-2032). In 2020, the market was valued at USD 9.31 billion, and this growth trajectory is largely attributed to several key factors including rising disposable incomes, an increasing number of working women, and the growing influence of digital media on consumer preferences.
Indonesia Toys & Games Market Growth Drivers
The landscape of the Indonesia Toys & Games Market is evolving due to several influential drivers:
- The rise in disposable income among urban families has empowered consumers to purchase higher-priced toys, including electronic devices and remote-controlled vehicles that often require batteries.
- A growing middle class contributes to increased consumer spending, particularly on recreational activities like toys, which are seen as a vital component of child development.
- The significant presence of eCommerce platforms has modernized the retail environment, providing convenient shopping options that encourage consumers to engage in online purchases.
- Manufacturers are innovating with designs and functionalities to capture market interest, resulting in diverse offerings that include educational toys and interactive games.
- An increasing focus on developmental benefits associated with toys, such as cognitive and motor skills enhancement, drives parental purchases supporting children's growth and learning.
Indonesia Toys & Games Market Trends and Opportunities
The Indonesia Toys & Games Market is witnessing notable trends that present various opportunities for growth:
- There is a marked shift towards educational toys that promote skill development, reflecting a growing awareness of the importance of early childhood education.
- Digitalization has spurred the demand for tech-based toys, including those that leverage augmented reality and interactive software, appealing to tech-savvy consumers.
- As sustainability becomes a priority, eco-friendly toys are gaining traction, attracting consumers who are committed to environmental responsibility.
- The integration of storytelling and educational content in toys is becoming a standard, creating deeper engagement and learning experiences for children.
- International brands are increasingly entering the Indonesian market, bringing innovative products that enhance competition and expand consumer choices.
Indonesia Toys & Games Market Challenges and Restraints
Despite its growth potential, the Indonesia Toys & Games Market faces several challenges that could hinder its expansion:
- The lack of standardized quality regulations in toy manufacturing often leads to a proliferation of low-quality products, undermining consumer trust and safety.
- Counterfeit goods pose a significant threat, as they flood the market with inferior alternatives at lower prices, damaging the reputations of legitimate manufacturers.
- High investment requirements for distribution channels create a barrier for smaller players, while large retailers with attractive discounts dominate the market.
- Consumer awareness around the benefits of branded and high-quality toys remains limited, impacting sales of premium products.
- Economic disparities between urban and rural areas lead to uneven market penetration, often limiting access to a wide range of toy offerings in less developed regions.
Indonesia Toys & Games Market Government Investment and Initiatives
The Indonesian government is actively investing in various initiatives that foster growth within the Toys & Games Market. These initiatives include:
- Policy frameworks aimed at enhancing industry standards and safety regulations for toy manufacturing, ensuring consumer protection and product quality.
- Incentives for local manufacturers to innovate and develop products that align with educational and developmental needs, driving consumer interest in quality toys.
- Support for entrepreneurship in the children's product sector, providing resources and funding opportunities for startups and small businesses.
- Investments in public awareness campaigns that promote the importance of educational toys and their developmental benefits, particularly in urban and rural communities.
- Collaboration with international organizations to adopt best practices from global markets, enhancing local industry competitiveness.
Indonesia Toys & Games Market Latest Developments (May 2025 - June 2026)
In the period from May 2025 to June 2026, the Indonesia Toys & Games Market has been characterized by several key developments:
- A surge in the production and launch of educational toys that align with curriculum-based learning, fostering a greater emphasis on developmental benefits for children.
- Continued growth of eCommerce platforms has led to partnerships between brands and online retailers, optimizing distribution channels and enhancing market reach.
- New regulations have been introduced focused on improving safety standards in toy manufacturing, aiming to reduce counterfeit products in the market.
- Increased investment from both domestic and international players into innovative and sustainable toy designs, catering to environmentally conscious consumers.
- Recognition of the importance of interactive and tech-based toys has resulted in significant interest from investors, leading to new product categories emerging within the market.
Indonesia Toys & Games Market - Key Attractiveness of the Report
- 10 Years of Market Numbers
- Historical Data Starting from 2022 to 2025
- Base Year: 2025
- Forecast Data until 2032
- Key Performance Indicators Impacting the Market
- Major Upcoming Developments and Projects
Key Highlights of the Report:
- Indonesia Toys & Games Market Outlook
- Market Size of Indonesia Toys & Games Market, 2025
- Forecast of Indonesia Toys & Games Market, 2032F
- Historical Data and Forecast of Indonesia Toys & Games Revenues & Volume for the Period 2022-2032F
- Indonesia Toys & Games Market Trend Evolution
- Indonesia Toys & Games Market Drivers and Challenges
- Indonesia Toys & Games Price Trends
- Indonesia Toys & Games Porter's Five Forces
- Indonesia Toys & Games Industry Life Cycle
- Historical Data and Forecast of Indonesia Toys & Games Market Revenues & Volume By Product Type for the Period 2022-2032F
- Historical Data and Forecast of Indonesia Toys & Games Market Revenues & Volume By Puzzles for the Period 2022-2032F
- Historical Data and Forecast of Indonesia Toys & Games Market Revenues & Volume By Preschool Toys for the Period 2022-2032F
- Historical Data and Forecast of Indonesia Toys & Games Market Revenues & Volume By Outdoor/Sports for the Period 2022-2032F
- Historical Data and Forecast of Indonesia Toys & Games Market Revenues & Volume By Dolls for the Period 2022-2032F
- Historical Data and Forecast of Indonesia Toys & Games Market Revenues & Volume By Video Games for the Period 2022-2032F
- Historical Data and Forecast of Indonesia Toys & Games Market Revenues & Volume By Others for the Period 2022-2032F
- Historical Data and Forecast of Indonesia Toys & Games Market Revenues & Volume By Applications for the Period 2022-2032F
- Historical Data and Forecast of Indonesia Toys & Games Market Revenues & Volume By 0 - 8 Years for the Period 2022-2032F
- Historical Data and Forecast of Indonesia Toys & Games Market Revenues & Volume By 8 - 15 Years for the Period 2022-2032F
- Historical Data and Forecast of Indonesia Toys & Games Market Revenues & Volume By 15 Years & Above for the Period 2022-2032F
- Historical Data and Forecast of Indonesia Toys & Games Market Revenues & Volume By Distribution Channel for the Period 2022-2032F
- Historical Data and Forecast of Indonesia Toys & Games Market Revenues & Volume By Offline for the Period 2022-2032F
- Historical Data and Forecast of Indonesia Toys & Games Market Revenues & Volume By Online for the Period 2022-2032F
- Indonesia Toys & Games Import Export Trade Statistics
- Market Opportunity Assessment By Product Type
- Market Opportunity Assessment By Applications
- Market Opportunity Assessment By Distribution Channel
- Indonesia Toys & Games Top Companies Market Share
- Indonesia Toys & Games Competitive Benchmarking By Technical and Operational Parameters
- Indonesia Toys & Games Company Profiles
- Indonesia Toys & Games Key Strategic Recommendations
Frequently Asked Questions About the Market Study (FAQs):
The growth is driven by increasing disposable incomes, a rise in the middle class, and evolving consumer preferences influenced by educational needs and digital platforms.
Challenges include the lack of quality standards, the prevalence of counterfeit products, and limited consumer awareness of premium offerings.
The government supports the sector through policy frameworks enhancing quality standards, entrepreneurship support, and awareness campaigns for educational toys.
Emerging trends include a rise in educational and tech-based toys, an increasing focus on sustainability, and the expansion of online retail platforms.
6Wresearch actively monitors the Indonesia Toys & Games Market and publishes its comprehensive annual report, highlighting emerging trends, growth drivers, revenue analysis, and forecast outlook. Our insights help businesses to make data-backed strategic decisions with ongoing market dynamics. Our analysts track relevent industries related to the Indonesia Toys & Games Market, allowing our clients with actionable intelligence and reliable forecasts tailored to emerging regional needs.
Yes, we provide customisation as per your requirements. To learn more, feel free to contact us on sales@6wresearch.com
1 Executive Summary |
2 Introduction |
2.1 Key Highlights of the Report |
2.2 Report Description |
2.3 Market Scope & Segmentation |
2.4 Research Methodology |
2.5 Assumptions |
3 Indonesia Toys & Games Market Overview |
3.1 Indonesia Country Macro Economic Indicators |
3.2 Indonesia Toys & Games Market Revenues & Volume, 2022 & 2032F |
3.3 Indonesia Toys & Games Market - Industry Life Cycle |
3.4 Indonesia Toys & Games Market - Porter's Five Forces |
3.5 Indonesia Toys & Games Market Revenues & Volume Share, By Product Type, 2022 & 2032F |
3.6 Indonesia Toys & Games Market Revenues & Volume Share, By Applications, 2022 & 2032F |
3.7 Indonesia Toys & Games Market Revenues & Volume Share, By Distribution Channel, 2022 & 2032F |
4 Indonesia Toys & Games Market Dynamics |
4.1 Impact Analysis |
4.2 Market Drivers |
4.3 Market Restraints |
5 Indonesia Toys & Games Market Trends |
6 Indonesia Toys & Games Market, By Types |
6.1 Indonesia Toys & Games Market, By Product Type |
6.1.1 Overview and Analysis |
6.1.2 Indonesia Toys & Games Market Revenues & Volume, By Product Type, 2022-2032F |
6.1.3 Indonesia Toys & Games Market Revenues & Volume, By Puzzles, 2022-2032F |
6.1.4 Indonesia Toys & Games Market Revenues & Volume, By Preschool Toys, 2022-2032F |
6.1.5 Indonesia Toys & Games Market Revenues & Volume, By Outdoor/Sports, 2022-2032F |
6.1.6 Indonesia Toys & Games Market Revenues & Volume, By Dolls, 2022-2032F |
6.1.7 Indonesia Toys & Games Market Revenues & Volume, By Video Games, 2022-2032F |
6.1.8 Indonesia Toys & Games Market Revenues & Volume, By Others, 2022-2032F |
6.2 Indonesia Toys & Games Market, By Applications |
6.2.1 Overview and Analysis |
6.2.2 Indonesia Toys & Games Market Revenues & Volume, By 0 - 8 Years, 2022-2032F |
6.2.3 Indonesia Toys & Games Market Revenues & Volume, By 8 - 15 Years, 2022-2032F |
6.2.4 Indonesia Toys & Games Market Revenues & Volume, By 15 Years & Above, 2022-2032F |
6.3 Indonesia Toys & Games Market, By Distribution Channel |
6.3.1 Overview and Analysis |
6.3.2 Indonesia Toys & Games Market Revenues & Volume, By Offline, 2022-2032F |
6.3.3 Indonesia Toys & Games Market Revenues & Volume, By Online, 2022-2032F |
7 Indonesia Toys & Games Market Import-Export Trade Statistics |
7.1 Indonesia Toys & Games Market Export to Major Countries |
7.2 Indonesia Toys & Games Market Imports from Major Countries |
8 Indonesia Toys & Games Market Key Performance Indicators |
9 Indonesia Toys & Games Market - Opportunity Assessment |
9.1 Indonesia Toys & Games Market Opportunity Assessment, By Product Type, 2022 & 2032F |
9.2 Indonesia Toys & Games Market Opportunity Assessment, By Applications, 2022 & 2032F |
9.3 Indonesia Toys & Games Market Opportunity Assessment, By Distribution Channel, 2022 & 2032F |
10 Indonesia Toys & Games Market - Competitive Landscape |
10.1 Indonesia Toys & Games Market Revenue Share, By Companies, 2025 |
10.2 Indonesia Toys & Games Market Competitive Benchmarking, By Operating and Technical Parameters |
11 Company Profiles |
12 Recommendations |
13 Disclaimer |
Global Go To Market Strategy - 2030
Export potential enables firms to identify high-growth global markets with greater confidence by combining advanced trade intelligence with a structured quantitative methodology. The framework analyzes emerging demand trends and country-level import patterns while integrating macroeconomic and trade datasets such as GDP and population forecasts, bilateral import–export flows, tariff structures, elasticity differentials between developed and developing economies, geographic distance, and import demand projections. Using weighted trade values from 2020–2024 as the base period to project country-to-country export potential for 2030, these inputs are operationalized through calculated drivers such as gravity model parameters, tariff impact factors, and projected GDP per-capita growth. Through an analysis of hidden potentials, demand hotspots, and market conditions that are most favorable to success, this method enables firms to focus on target countries, maximize returns, and global expansion with data, backed by accuracy.
By factoring in the projected importer demand gap that is currently unmet and could be potential opportunity, it identifies the potential for the Exporter (Country) among 190 countries, against the general trade analysis, which identifies the biggest importer or exporter.
To discover high-growth global markets and optimize your business strategy:
Click Here
Pricing
- Single User License$ 1,995
- Department License$ 2,400
- Site License$ 3,120
- Global License$ 3,795

Leadership Perspectives from Industry Events
Search
Thought Leadership and Analyst Meet


Our Clients
6WResearch In News
- India Air Conditioner Market Set for Strong Rebound in 2026 After Weather-Led Correction and GST-Driven Recovery: 6Wresearch
- ADAS in India: How Automatic Emergency Braking, Blind Spot Detection & Driver Monitoring are Transforming Road Safety
- Doha a strategic location for EV manufacturing hub: IPA Qatar
- Demand for luxury TVs surging in the GCC, says Samsung
- Empowering Growth: The Thriving Journey of Bangladesh’s Cable Industry
- Demand for luxury TVs surging in the GCC, says Samsung
Latest Reports
- Nicaragua RPG Gaming Market (2026-2032)
- New Zealand RPG Gaming Market (2026-2032)
- Netherlands RPG Gaming Market (2026-2032)
- Nauru RPG Gaming Market (2026-2032)
- Namibia RPG Gaming Market (2026-2032)
- Mozambique RPG Gaming Market (2026-2032)
- Montenegro RPG Gaming Market (2026-2032)
- Mongolia RPG Gaming Market (2026-2032)
- Monaco RPG Gaming Market (2026-2032)
- Micronesia RPG Gaming Market (2026-2032)
Industry Events and Analyst Meet

EV India Expo 2026

HIMTEX 2026

India Refining Summit 2026

India EV Show 2026

EV tech India Expo 2026
Whitepaper
- Middle East & Africa Commercial Security Market Click here to view more.
- Middle East & Africa Fire Safety Systems & Equipment Market Click here to view more.
- GCC Drone Market Click here to view more.
- Middle East Lighting Fixture Market Click here to view more.
- GCC Physical & Perimeter Security Market Click here to view more.