Indonesia Vanilla Beans Market (2026-2032) | Outlook, Forecast, Companies, Analysis, Share, Value, Revenue, Trends, Size, Growth & Industry
Market Forecast By Product Type (Organic, Conventional), By Grade (Grade A, Grade B), By Origin (Natural, Synthetic), By Form (Paste, Liquid, Powder), By Application (Food and Beverages Industry, Cosmetics Industry, Pharmaceuticals Industry) And Competitive Landscape
| Product Code: ETC015348 | Publication Date: Jul 2023 | Updated Date: Jun 2026 | Product Type: Report | |
| Publisher: 6Wresearch | Author: Ravi Bhandari | No. of Pages: 70 | No. of Figures: 35 | No. of Tables: 5 |
Indonesia Vanilla Beans Market Summary
The indonesia vanilla beans market was estimated at USD 327 Million in 2025 and is projected to reach USD 431 Million by 2032, growing at a CAGR of 5.2% from 2026 to 2032.
Indonesia Vanilla Beans Market Year-wise Growth Rate and Key Drivers
This graph highlights how the Indonesia Vanilla Beans Market has steadily grown over the years, supported by major growth factors.
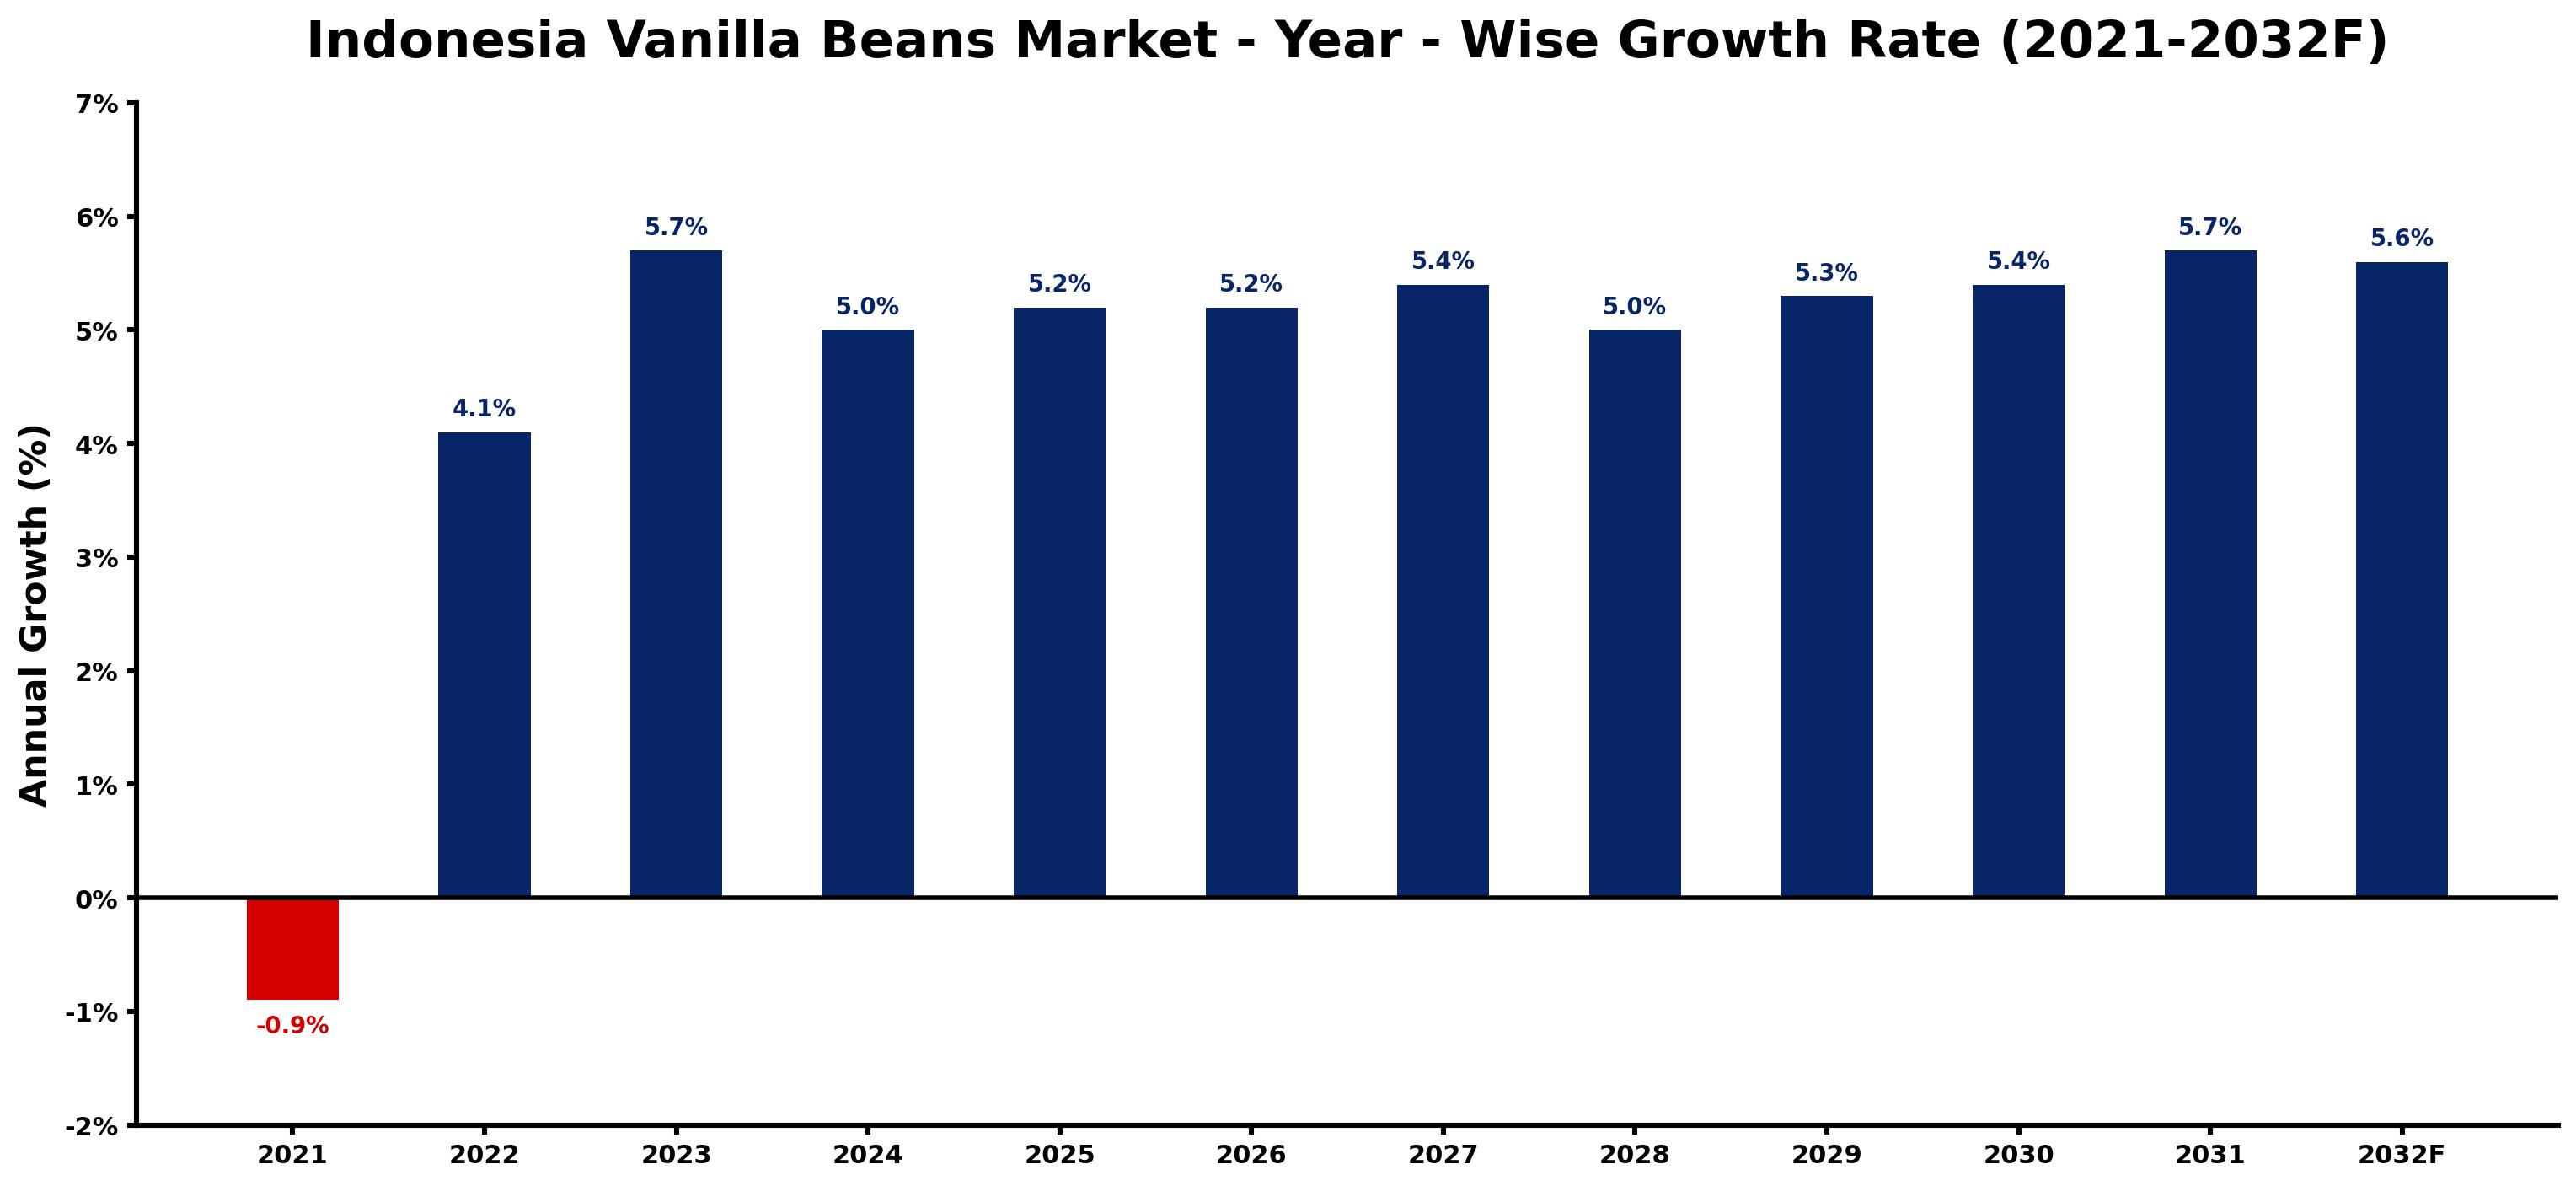
The table below presents the year wise growth rates along with the key drivers influencing the market
| Year | Growth Rate | Major Drivers |
| 2021 | -0.9% | Unfavorable weather conditions significantly hampered vanilla bean yields, disrupting supply and elevating prices. |
| 2022 | 4.1% | Small-scale farmers implement sustainable practices, enhancing product quality and marketability. |
| 2023 | 5.7% | Rising global interest in artisanal foods encourages Indonesian vanilla exports significantly. |
| 2024 | 5.0% | Local processing facilities improve, reducing dependency on foreign vanilla extraction technologies. |
| 2025 | 5.2% | E-commerce platforms expand access, connecting farmers directly to international buyers efficiently. |
| 2026 | 5.2% | Increased investments in agricultural technology optimize yield and reduce cultivation costs. |
| 2027 | 5.4% | Export partnerships with gourmet food brands reaffirm Indonesia's position in global markets. |
| 2028 | 5.0% | Climate resilience initiatives help farmers tackle adverse weather impacts on vanilla production. |
| 2029 | 5.3% | Growing health awareness boosts popularity of organic and ethically sourced vanilla products. |
| 2030 | 5.4% | Culinary tourism flourishes, positioning vanilla as a key ingredient in local cuisine globally. |
| 2031 | 5.7% | Emerging markets show interest in specialty vanillas, increasing competition and market dynamics. |
| 2032 | 5.6% | Collaborative ventures among farmers enhance bargaining power in international vanilla trade. |
Note - Market size estimations and growth projections presented in this report are based on 6Wresearch's advanced forecasting approach, validated with industry datasets as of June 2026.
Indonesia Vanilla Beans Market Synopsis
The Indonesia Vanilla Beans Market is projected to reach 5.2% and witness significant growth during the forecast period (2026-2032). The anticipated compound annual growth rate (CAGR) of 3.3% reflects a robust increase in demand driven by shifting consumer preferences towards natural and organic flavors in food and beverages. This market momentum is further amplified by the rising disposable incomes of consumers, enabling them to seek higher-quality, premium products. Manufacturers are increasingly leveraging Indonesia vanilla beans in their offerings, capitalizing on the unique flavor profile that distinguishes them from synthetic alternatives, thereby gaining a competitive edge.
Indonesia Vanilla Beans Market Growth Drivers
Several factors are driving the growth of the Indonesia vanilla beans market. Firstly, the global trend toward health-conscious consumption has led to an increased preference for natural ingredients over artificial ones. This shift has been accompanied by a growing body of research highlighting the health benefits associated with vanilla beans, such as antioxidant properties and potential stress-relief effects.
- Rising consumer awareness about the negative health impacts of synthetic additives has promoted the use of natural vanilla beans in various culinary applications.
- The growing popularity of gourmet food products and artisanal offerings has further heightened demand for high-quality vanilla beans among consumers.
- Innovative product development, particularly in the beverage sector, has fueled the use of Indonesia vanilla beans as a key flavoring ingredient.
- Increased participation in wellness trends, including the use of natural ingredients in home baking and cooking, motivates consumers to select vanilla beans over synthetic substitutes.
- The expanding foodservice industry is also a significant contributor, as restaurants and cafés opt for premium ingredients to enhance their culinary offerings and meet consumer expectations.
Indonesia Vanilla Beans Market Trends and Opportunities
The Indonesia vanilla beans market is experiencing a notable evolution, characterized by several emerging trends. One key trend is the surge in product innovation aimed at enhancing flavor profiles and diversifying applications. As manufacturers continue to explore the potential of vanilla beans in new product formulations, this presents substantial opportunities for market expansion. The organic segment, in particular, is seeing significant growth as consumers increasingly prioritize sustainability and ethical sourcing.
- The incorporation of vanilla beans in health and wellness products, such as dietary supplements and natural fragrances, is gaining traction.
- Cross-industry collaborations, particularly between food and personal care sectors, are creating novel applications for vanilla beans, thus broadening market reach.
- Digital transformation in retail, including e-commerce platforms, enables greater accessibility for consumers seeking premium quality vanilla products.
- Growing tourism in Indonesia can also enhance the visibility of local vanilla products, fostering a connection between consumers and the source of their ingredients.
- The increasing influence of social media and food blogging has led to heightened consumer interest in gourmet cooking, driving demand for high-quality vanilla beans.
Indonesia Vanilla Beans Market Challenges and Restraints
While the Indonesia vanilla beans market presents various opportunities, it also faces notable challenges and restraints. The volatility in vanilla prices, often dictated by supply chain disruptions and fluctuating harvests, creates apprehension among manufacturers and consumers alike. Additionally, maintaining consistent quality can be a challenge due to climatic factors that affect crop yield.
- Environmental changes and climate-related concerns can adversely impact vanilla cultivation, leading to potential supply shortages.
- The growth of synthetic alternatives, which can be produced at lower costs, poses a competitive threat to natural vanilla products.
- The complexity of the supply chain, from farmers to distributors, can result in inefficiencies and increased costs, ultimately affecting market stability.
- Lack of adequate funding and support for local farmers can hinder the potential growth of the domestic industry.
- Consumer misconceptions about the authenticity and quality of vanilla products may deter some from making purchases, necessitating enhanced educational efforts.
Indonesia Vanilla Beans Market Government Investment and Initiatives
The Indonesian government has recognized the importance of the vanilla bean sector in bolstering the economy and has initiated several programs to support its growth. Investments in agricultural technology and sustainable farming practices are being prioritized to improve crop yield and quality. This investment is complemented by incentives aimed at encouraging local farmers to adopt organic farming methods, which not only enhance sustainability but also meet rising consumer demand for organic products.
- Programs aimed at providing financial support and training for farmers are being implemented to enhance productivity and quality.
- Government initiatives focusing on improving infrastructure for transport and logistics are set to streamline the supply chain for vanilla products.
- Policymaking focused on promoting exports of Indonesian vanilla has the potential to strengthen the position of the country in the global market.
- Investment in research and development is crucial, with the government collaborating with agricultural universities to improve cultivation techniques.
- Public campaigns aimed at raising awareness of Indonesian vanilla's unique offerings can enhance its global market appeal.
Indonesia Vanilla Beans Market Latest Developments (May 2025 - June 2026)
Recent developments in the Indonesia vanilla beans market reflect the dynamic nature of the industry as it adapts to consumer trends and operational challenges. Innovations surrounding product formulation and sustainable practices have gained momentum, with numerous players exploring advanced techniques to enhance flavor extraction without compromising quality. As market players strive to differentiate their offerings, the introduction of unique blends incorporating vanilla beans has become a focal point of competition.
- Increased collaborations among producers and research institutions have led to the development of improved cultivation techniques aimed at boosting vanilla bean yields.
- Trade exhibitions and food festivals are fostering greater engagement between producers and consumers, facilitating the promotion of Indonesia's quality vanilla.
- Emerging online retail platforms are significantly expanding market reach, making premium vanilla products more accessible to a wider audience.
- Consumer interest in sustainability is driving brands to emphasize ethical sourcing and eco-friendly packaging as part of their marketing strategy.
- Ongoing educational initiatives regarding the health benefits of vanilla beans are enhancing consumer awareness and driving demand.
Indonesia Vanilla Beans Market - Key Attractiveness of the Report
- 10 Years of Market Numbers
- Historical Data Starting from 2022 to 2025
- Base Year: 2025
- Forecast Data until 2032
- Key Performance Indicators Impacting the Market
- Major Upcoming Developments and Projects
Key Highlights of the Report:
- Indonesia Vanilla Beans Market Outlook
- Market Size of Indonesia Vanilla Beans Market, 2025
- Forecast of Indonesia Vanilla Beans Market, 2032F
- Historical Data and Forecast of Indonesia Vanilla Beans Revenues & Volume for the Period 2022-2032F
- Indonesia Vanilla Beans Market Trend Evolution
- Indonesia Vanilla Beans Market Drivers and Challenges
- Indonesia Vanilla Beans Price Trends
- Indonesia Vanilla Beans Porter's Five Forces
- Indonesia Vanilla Beans Industry Life Cycle
- Historical Data and Forecast of Indonesia Vanilla Beans Market Revenues & Volume By Product Type for the Period 2022-2032F
- Historical Data and Forecast of Indonesia Vanilla Beans Market Revenues & Volume By Organic for the Period 2022-2032F
- Historical Data and Forecast of Indonesia Vanilla Beans Market Revenues & Volume By Conventional for the Period 2022-2032F
- Historical Data and Forecast of Indonesia Vanilla Beans Market Revenues & Volume By Grade for the Period 2022-2032F
- Historical Data and Forecast of Indonesia Vanilla Beans Market Revenues & Volume By Grade A for the Period 2022-2032F
- Historical Data and Forecast of Indonesia Vanilla Beans Market Revenues & Volume By Grade B for the Period 2022-2032F
- Historical Data and Forecast of Indonesia Vanilla Beans Market Revenues & Volume By Origin for the Period 2022-2032F
- Historical Data and Forecast of Indonesia Vanilla Beans Market Revenues & Volume By Natural for the Period 2022-2032F
- Historical Data and Forecast of Indonesia Vanilla Beans Market Revenues & Volume By Synthetic for the Period 2022-2032F
- Historical Data and Forecast of Indonesia Vanilla Beans Market Revenues & Volume By Form for the Period 2022-2032F
- Historical Data and Forecast of Indonesia Vanilla Beans Market Revenues & Volume By Paste for the Period 2022-2032F
- Historical Data and Forecast of Indonesia Vanilla Beans Market Revenues & Volume By Liquid for the Period 2022-2032F
- Historical Data and Forecast of Indonesia Vanilla Beans Market Revenues & Volume By Powder for the Period 2022-2032F
- Historical Data and Forecast of Indonesia Vanilla Beans Market Revenues & Volume By Application for the Period 2022-2032F
- Historical Data and Forecast of Indonesia Vanilla Beans Market Revenues & Volume By Food and Beverages Industry for the Period 2022-2032F
- Historical Data and Forecast of Indonesia Vanilla Beans Market Revenues & Volume By Cosmetics Industry for the Period 2022-2032F
- Historical Data and Forecast of Indonesia Vanilla Beans Market Revenues & Volume By Pharmaceuticals Industry for the Period 2022-2032F
- Historical Data and Forecast of Indonesia Vanilla Beans Market Revenues & Volume By Distribution Channel for the Period 2022-2032F
- Historical Data and Forecast of Indonesia Vanilla Beans Market Revenues & Volume By Retailers for the Period 2022-2032F
- Historical Data and Forecast of Indonesia Vanilla Beans Market Revenues & Volume By Supermarket for the Period 2022-2032F
- Historical Data and Forecast of Indonesia Vanilla Beans Market Revenues & Volume By Hypermarket for the Period 2022-2032F
- Historical Data and Forecast of Indonesia Vanilla Beans Market Revenues & Volume By E-commerce for the Period 2022-2032F
- Indonesia Vanilla Beans Import Export Trade Statistics
- Market Opportunity Assessment By Product Type
- Market Opportunity Assessment By Grade
- Market Opportunity Assessment By Origin
- Market Opportunity Assessment By Form
- Market Opportunity Assessment By Application
- Market Opportunity Assessment By Distribution Channel
- Indonesia Vanilla Beans Top Companies Market Share
- Indonesia Vanilla Beans Competitive Benchmarking By Technical and Operational Parameters
- Indonesia Vanilla Beans Company Profiles
- Indonesia Vanilla Beans Key Strategic Recommendations
Frequently Asked Questions About the Market Study (FAQs):
The Indonesia vanilla beans market is projected to register a CAGR of 3.3% during the forecast period from 2026 to 2032.
The increasing demand for natural and organic flavors, rising disposable incomes, and health benefits associated with vanilla beans are key drivers of market demand.
The government is investing in agricultural technology, providing financial support to farmers, and promoting initiatives aimed at sustainable farming to enhance productivity and market competitiveness.
Challenges include price volatility, supply chain inefficiencies, and environmental factors impacting crop yields, alongside competition from synthetic alternatives.
6Wresearch actively monitors the Indonesia Vanilla Beans Market and publishes its comprehensive annual report, highlighting emerging trends, growth drivers, revenue analysis, and forecast outlook. Our insights help businesses to make data-backed strategic decisions with ongoing market dynamics. Our analysts track relevent industries related to the Indonesia Vanilla Beans Market, allowing our clients with actionable intelligence and reliable forecasts tailored to emerging regional needs.
Yes, we provide customisation as per your requirements. To learn more, feel free to contact us on sales@6wresearch.com
1 Executive Summary |
2 Introduction |
2.1 Key Highlights of the Report |
2.2 Report Description |
2.3 Market Scope & Segmentation |
2.4 Research Methodology |
2.5 Assumptions |
3 Indonesia Vanilla Beans Market Overview |
3.1 Indonesia Country Macro Economic Indicators |
3.2 Indonesia Vanilla Beans Market Revenues & Volume, 2022 & 2032F |
3.3 Indonesia Vanilla Beans Market - Industry Life Cycle |
3.4 Indonesia Vanilla Beans Market - Porter's Five Forces |
3.5 Indonesia Vanilla Beans Market Revenues & Volume Share, By Product Type, 2022 & 2032F |
3.6 Indonesia Vanilla Beans Market Revenues & Volume Share, By Grade, 2022 & 2032F |
3.7 Indonesia Vanilla Beans Market Revenues & Volume Share, By Origin, 2022 & 2032F |
3.8 Indonesia Vanilla Beans Market Revenues & Volume Share, By Form, 2022 & 2032F |
3.9 Indonesia Vanilla Beans Market Revenues & Volume Share, By Application, 2022 & 2032F |
3.10 Indonesia Vanilla Beans Market Revenues & Volume Share, By Distribution Channel, 2022 & 2032F |
4 Indonesia Vanilla Beans Market Dynamics |
4.1 Impact Analysis |
4.2 Market Drivers |
4.3 Market Restraints |
5 Indonesia Vanilla Beans Market Trends |
6 Indonesia Vanilla Beans Market, By Types |
6.1 Indonesia Vanilla Beans Market, By Product Type |
6.1.1 Overview and Analysis |
6.1.2 Indonesia Vanilla Beans Market Revenues & Volume, By Product Type, 2022-2032F |
6.1.3 Indonesia Vanilla Beans Market Revenues & Volume, By Organic, 2022-2032F |
6.1.4 Indonesia Vanilla Beans Market Revenues & Volume, By Conventional, 2022-2032F |
6.2 Indonesia Vanilla Beans Market, By Grade |
6.2.1 Overview and Analysis |
6.2.2 Indonesia Vanilla Beans Market Revenues & Volume, By Grade A, 2022-2032F |
6.2.3 Indonesia Vanilla Beans Market Revenues & Volume, By Grade B, 2022-2032F |
6.3 Indonesia Vanilla Beans Market, By Origin |
6.3.1 Overview and Analysis |
6.3.2 Indonesia Vanilla Beans Market Revenues & Volume, By Natural, 2022-2032F |
6.3.3 Indonesia Vanilla Beans Market Revenues & Volume, By Synthetic, 2022-2032F |
6.4 Indonesia Vanilla Beans Market, By Form |
6.4.1 Overview and Analysis |
6.4.2 Indonesia Vanilla Beans Market Revenues & Volume, By Paste, 2022-2032F |
6.4.3 Indonesia Vanilla Beans Market Revenues & Volume, By Liquid, 2022-2032F |
6.4.4 Indonesia Vanilla Beans Market Revenues & Volume, By Powder, 2022-2032F |
6.5 Indonesia Vanilla Beans Market, By Application |
6.5.1 Overview and Analysis |
6.5.2 Indonesia Vanilla Beans Market Revenues & Volume, By Food and Beverages Industry, 2022-2032F |
6.5.3 Indonesia Vanilla Beans Market Revenues & Volume, By Cosmetics Industry, 2022-2032F |
6.5.4 Indonesia Vanilla Beans Market Revenues & Volume, By Pharmaceuticals Industry, 2022-2032F |
6.6 Indonesia Vanilla Beans Market, By Distribution Channel |
6.6.1 Overview and Analysis |
6.6.2 Indonesia Vanilla Beans Market Revenues & Volume, By Retailers, 2022-2032F |
6.6.3 Indonesia Vanilla Beans Market Revenues & Volume, By Supermarket, 2022-2032F |
6.6.4 Indonesia Vanilla Beans Market Revenues & Volume, By Hypermarket, 2022-2032F |
6.6.5 Indonesia Vanilla Beans Market Revenues & Volume, By E-commerce, 2022-2032F |
7 Indonesia Vanilla Beans Market Import-Export Trade Statistics |
7.1 Indonesia Vanilla Beans Market Export to Major Countries |
7.2 Indonesia Vanilla Beans Market Imports from Major Countries |
8 Indonesia Vanilla Beans Market Key Performance Indicators |
9 Indonesia Vanilla Beans Market - Opportunity Assessment |
9.1 Indonesia Vanilla Beans Market Opportunity Assessment, By Product Type, 2022 & 2032F |
9.2 Indonesia Vanilla Beans Market Opportunity Assessment, By Grade, 2022 & 2032F |
9.3 Indonesia Vanilla Beans Market Opportunity Assessment, By Origin, 2022 & 2032F |
9.4 Indonesia Vanilla Beans Market Opportunity Assessment, By Form, 2022 & 2032F |
9.5 Indonesia Vanilla Beans Market Opportunity Assessment, By Application, 2022 & 2032F |
9.6 Indonesia Vanilla Beans Market Opportunity Assessment, By Distribution Channel, 2022 & 2032F |
10 Indonesia Vanilla Beans Market - Competitive Landscape |
10.1 Indonesia Vanilla Beans Market Revenue Share, By Companies, 2025 |
10.2 Indonesia Vanilla Beans Market Competitive Benchmarking, By Operating and Technical Parameters |
11 Company Profiles |
12 Recommendations |
13 Disclaimer |
Global Go To Market Strategy - 2030
Export potential enables firms to identify high-growth global markets with greater confidence by combining advanced trade intelligence with a structured quantitative methodology. The framework analyzes emerging demand trends and country-level import patterns while integrating macroeconomic and trade datasets such as GDP and population forecasts, bilateral import–export flows, tariff structures, elasticity differentials between developed and developing economies, geographic distance, and import demand projections. Using weighted trade values from 2020–2024 as the base period to project country-to-country export potential for 2030, these inputs are operationalized through calculated drivers such as gravity model parameters, tariff impact factors, and projected GDP per-capita growth. Through an analysis of hidden potentials, demand hotspots, and market conditions that are most favorable to success, this method enables firms to focus on target countries, maximize returns, and global expansion with data, backed by accuracy.
By factoring in the projected importer demand gap that is currently unmet and could be potential opportunity, it identifies the potential for the Exporter (Country) among 190 countries, against the general trade analysis, which identifies the biggest importer or exporter.
To discover high-growth global markets and optimize your business strategy:
Click Here
Pricing
- Single User License$ 1,995
- Department License$ 2,400
- Site License$ 3,120
- Global License$ 3,795

Leadership Perspectives from Industry Events
Search
Thought Leadership and Analyst Meet


Our Clients
6WResearch In News
- India Export Attractiveness Tracker 2026
- India Air Conditioner Market Set for Strong Rebound in 2026 After Weather-Led Correction and GST-Driven Recovery: 6Wresearch
- ADAS in India: How Automatic Emergency Braking, Blind Spot Detection & Driver Monitoring are Transforming Road Safety
- Doha a strategic location for EV manufacturing hub: IPA Qatar
- Demand for luxury TVs surging in the GCC, says Samsung
- Empowering Growth: The Thriving Journey of Bangladesh’s Cable Industry
Latest Reports
- Nicaragua RPG Gaming Market (2026-2032)
- New Zealand RPG Gaming Market (2026-2032)
- Netherlands RPG Gaming Market (2026-2032)
- Nauru RPG Gaming Market (2026-2032)
- Namibia RPG Gaming Market (2026-2032)
- Mozambique RPG Gaming Market (2026-2032)
- Montenegro RPG Gaming Market (2026-2032)
- Mongolia RPG Gaming Market (2026-2032)
- Monaco RPG Gaming Market (2026-2032)
- Micronesia RPG Gaming Market (2026-2032)
Industry Events and Analyst Meet

EV India Expo 2026

HIMTEX 2026

India Refining Summit 2026

India EV Show 2026

EV tech India Expo 2026
Whitepaper
- Middle East & Africa Commercial Security Market Click here to view more.
- Middle East & Africa Fire Safety Systems & Equipment Market Click here to view more.
- GCC Drone Market Click here to view more.
- Middle East Lighting Fixture Market Click here to view more.
- GCC Physical & Perimeter Security Market Click here to view more.