Indonesia Washable Markers Market (2026-2032) Outlook | Size, Revenue, Trends, Analysis, Share, Companies, Forecast, Industry, Value & Growth
Market Forecast By Washability (Basic- Washable, Super-washable), By End User (Children, Professionals) And Competitive Landscape
| Product Code: ETC281068 | Publication Date: Aug 2022 | Updated Date: Mar 2026 | Product Type: Market Research Report | |
| Publisher: 6Wresearch | Author: Ravi Bhandari | No. of Pages: 75 | No. of Figures: 35 | No. of Tables: 20 |
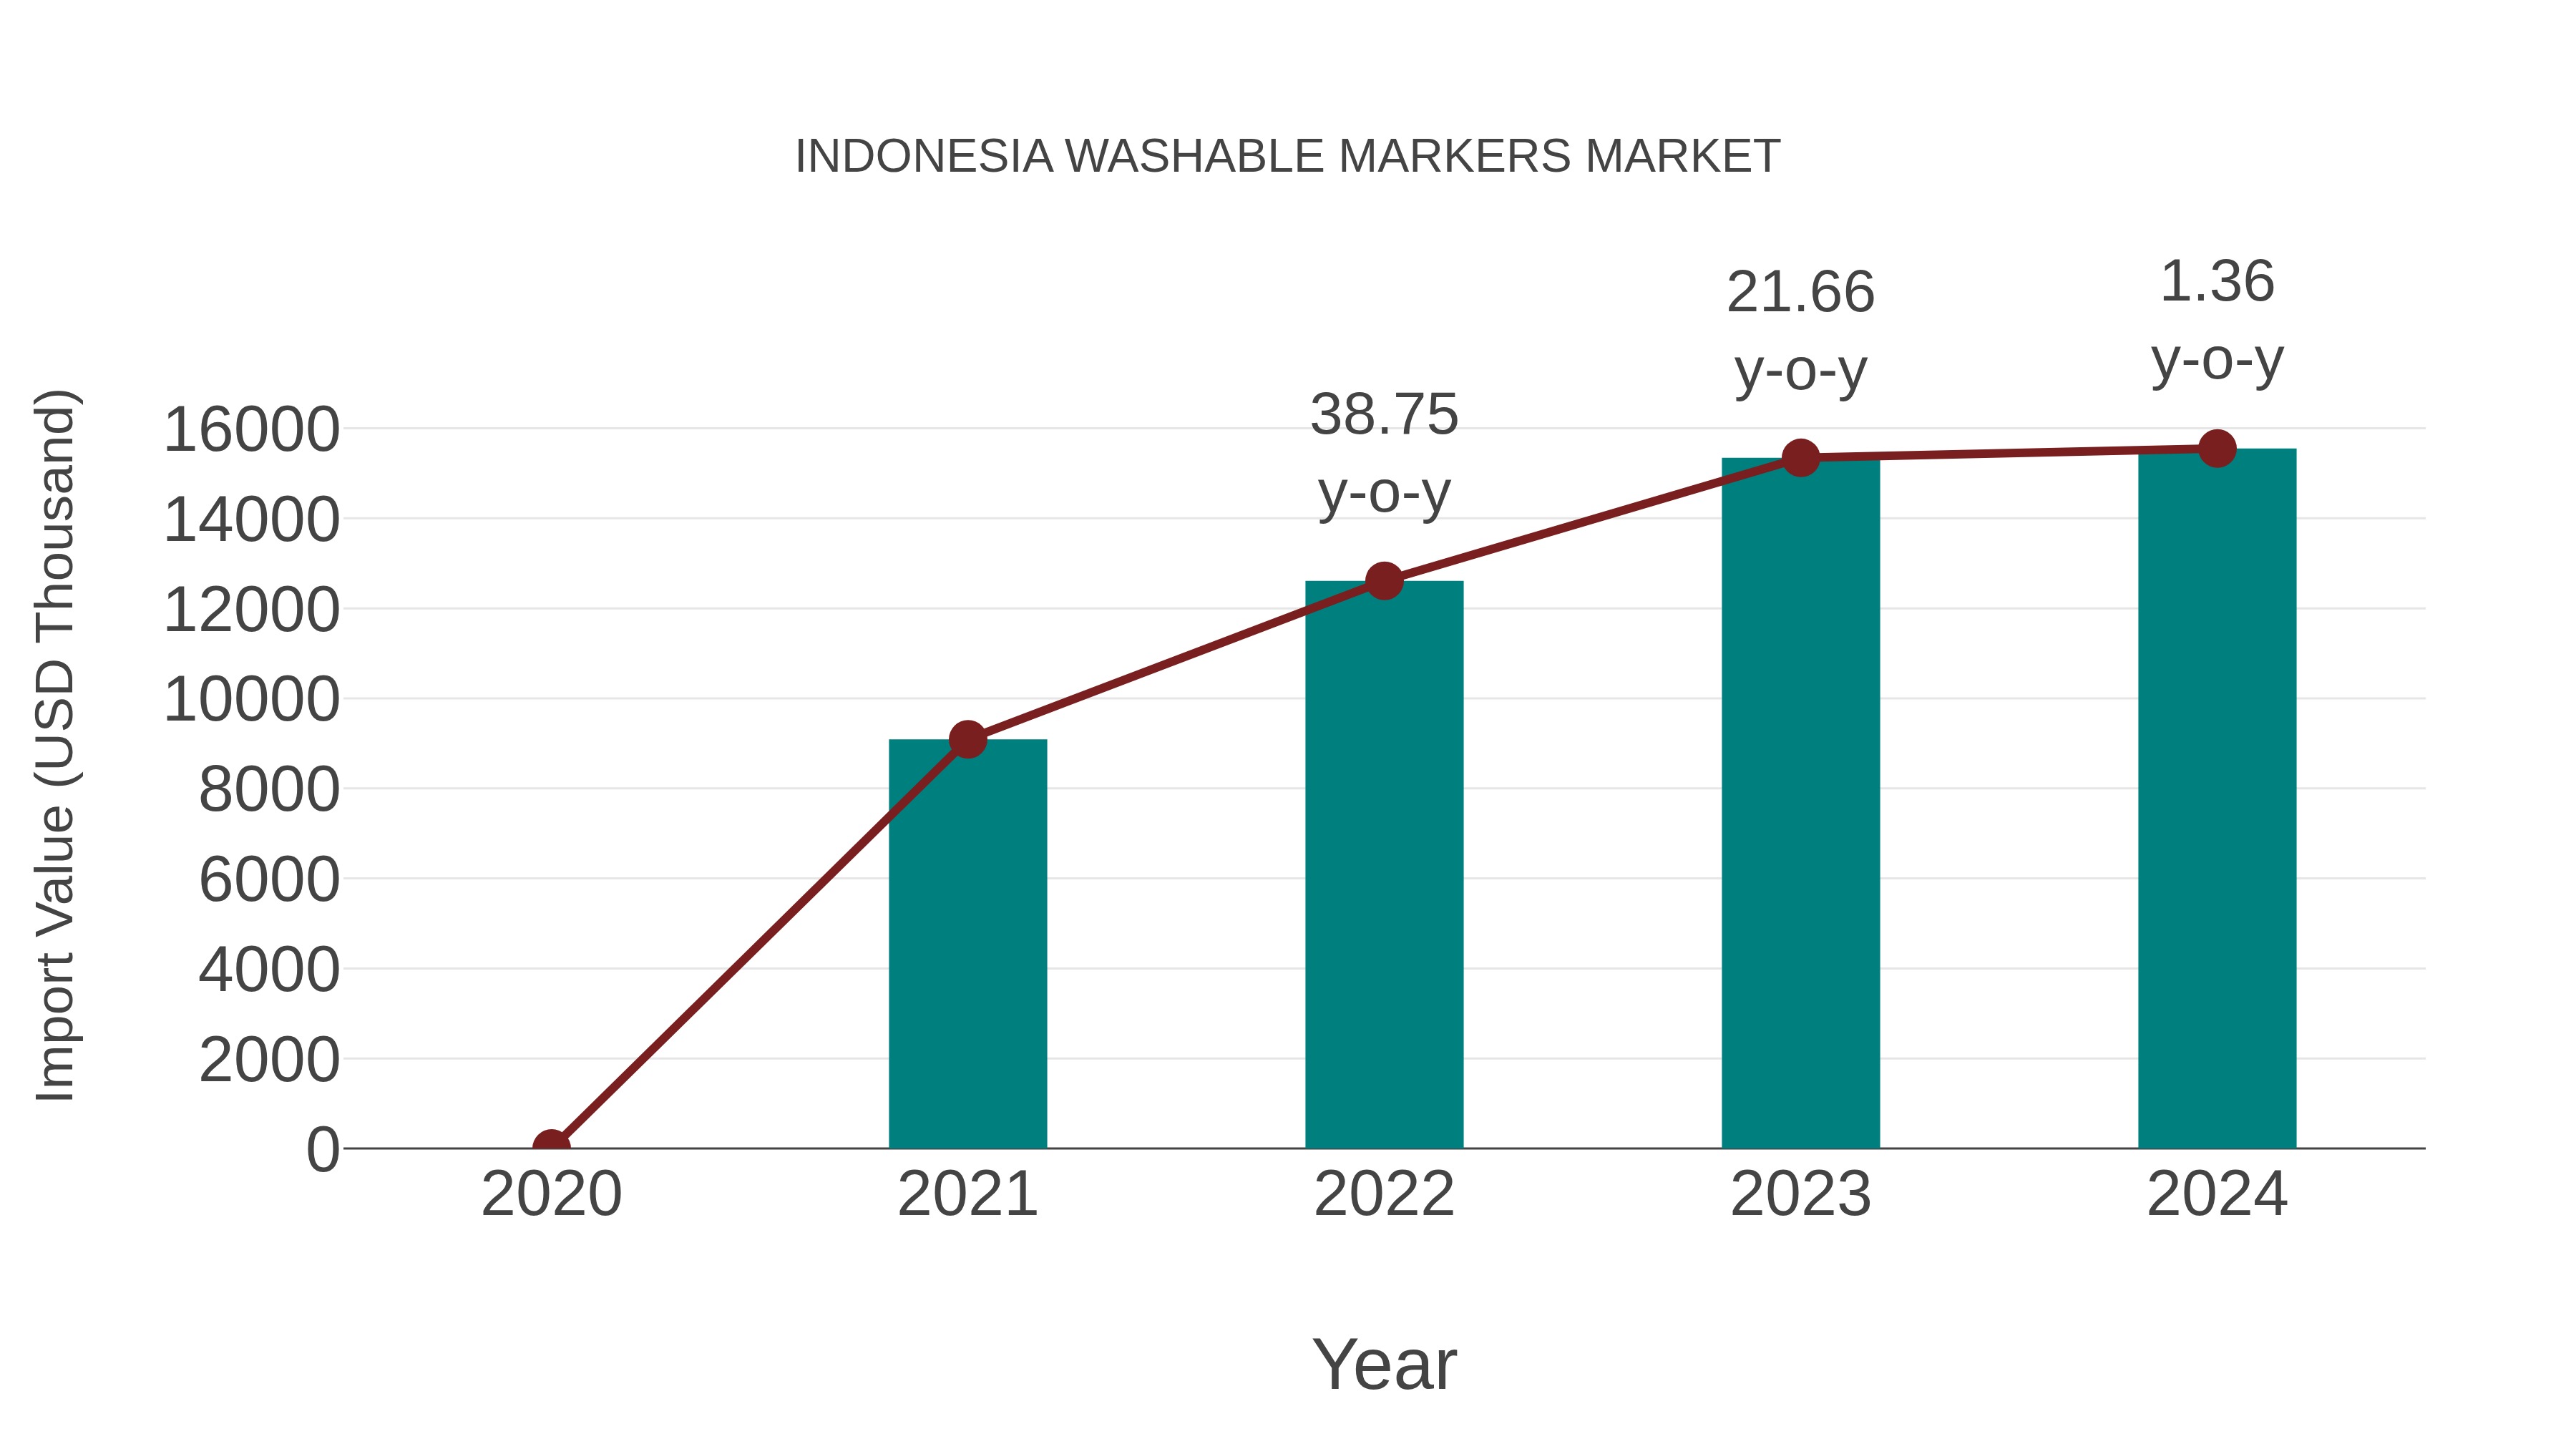
Indonesia Washable Markers Market: Import Trend Analysis
Indonesia`s import trend for washable markers showed a growth rate of 1.36% from 2023 to 2024, with a compound annual growth rate (CAGR) of 19.6% from 2020 to 2024. This increase can be attributed to a sustained demand shift towards eco-friendly and non-toxic stationery products in the market.
Indonesia Washable Markers Market Synopsis
The washable markers market in Indonesia is forecasted to grow from USD 6 million in 2025 and reach USD 8 million by 2025, registering a CAGR of 5.1% during the period. Increasing demand for easy-to-clean writing material due to Covid-19 pandemic along with growing preference for ecofriendly markers are some of the major factors driving this market?s growth over the forecast period. Moreover, presence of many local players offering low priced washable markers helps expand its reach among price conscious consumers which further add up towards its growth prospects over coming years.
Drivers of the Market
The market for washable markers can be driven by the education sector, the growing interest in arts and crafts, and the popularity of creative activities among children and adults alike. Product innovations, such as non-toxic and eco-friendly markers, can also impact market growth.
Challenges of the Market
Washable markers market might need to address concerns about safety, washability, and environmental impact, especially with growing awareness of eco-friendly products.
COVID-19 Impact on the Market
The pandemic may have impacted the education sector and office activities, affecting the demand for washable markers. However, with the resumption of educational and commercial activities, the market is likely to pick up again.
Key Players in the Market
Crayola LLC, Faber-Castell, Newell Brands (Sharpie), BIC Group, Dixon Ticonderoga Company are some major players operating in the market.
Key Highlights of the Report:
- Indonesia Washable Markers Market Outlook
- Market Size of Indonesia Washable Markers Market, 2025
- Forecast of Indonesia Washable Markers Market, 2032
- Historical Data and Forecast of Indonesia Washable Markers Revenues & Volume for the Period 2022-2032F
- Indonesia Washable Markers Market Trend Evolution
- Indonesia Washable Markers Market Drivers and Challenges
- Indonesia Washable Markers Price Trends
- Indonesia Washable Markers Porter's Five Forces
- Indonesia Washable Markers Industry Life Cycle
- Historical Data and Forecast of Indonesia Washable Markers Market Revenues & Volume By Washability for the Period 2022-2032F
- Historical Data and Forecast of Indonesia Washable Markers Market Revenues & Volume By Basic- Washable for the Period 2022-2032F
- Historical Data and Forecast of Indonesia Washable Markers Market Revenues & Volume By Super-washable for the Period 2022-2032F
- Historical Data and Forecast of Indonesia Washable Markers Market Revenues & Volume By End User for the Period 2022-2032F
- Historical Data and Forecast of Indonesia Washable Markers Market Revenues & Volume By Children for the Period 2022-2032F
- Historical Data and Forecast of Indonesia Washable Markers Market Revenues & Volume By Professionals for the Period 2022-2032F
- Indonesia Washable Markers Import Export Trade Statistics
- Market Opportunity Assessment By Washability
- Market Opportunity Assessment By End User
- Indonesia Washable Markers Top Companies Market Share
- Indonesia Washable Markers Competitive Benchmarking By Technical and Operational Parameters
- Indonesia Washable Markers Company Profiles
- Indonesia Washable Markers Key Strategic Recommendations
Indonesia Washable Markers Market (2026-2032): FAQs
6Wresearch actively monitors the Indonesia Washable Markers Market and publishes its comprehensive annual report, highlighting emerging trends, growth drivers, revenue analysis, and forecast outlook. Our insights help businesses to make data-backed strategic decisions with ongoing market dynamics. Our analysts track relevent industries related to the Indonesia Washable Markers Market, allowing our clients with actionable intelligence and reliable forecasts tailored to emerging regional needs.
Yes, we provide customisation as per your requirements. To learn more, feel free to contact us on sales@6wresearch.com
1 Executive Summary |
2 Introduction |
2.1 Key Highlights of the Report |
2.2 Report Description |
2.3 Market Scope & Segmentation |
2.4 Research Methodology |
2.5 Assumptions |
3 Indonesia Washable Markers Market Overview |
3.1 Indonesia Country Macro Economic Indicators |
3.2 Indonesia Washable Markers Market Revenues & Volume, 2022 & 2032F |
3.3 Indonesia Washable Markers Market - Industry Life Cycle |
3.4 Indonesia Washable Markers Market - Porter's Five Forces |
3.5 Indonesia Washable Markers Market Revenues & Volume Share, By Washability, 2022 & 2032F |
3.6 Indonesia Washable Markers Market Revenues & Volume Share, By End User, 2022 & 2032F |
4 Indonesia Washable Markers Market Dynamics |
4.1 Impact Analysis |
4.2 Market Drivers |
4.2.1 Increasing focus on education and art-related activities in Indonesia |
4.2.2 Growing awareness about environmental sustainability, leading to a preference for washable markers |
4.2.3 Rising disposable income and changing consumer lifestyles favoring creative products |
4.3 Market Restraints |
4.3.1 Competition from traditional markers and alternative writing instruments |
4.3.2 Price sensitivity among consumers, affecting purchasing decisions |
4.3.3 Quality concerns regarding washable markers compared to traditional markers |
5 Indonesia Washable Markers Market Trends |
6 Indonesia Washable Markers Market, By Types |
6.1 Indonesia Washable Markers Market, By Washability |
6.1.1 Overview and Analysis |
6.1.2 Indonesia Washable Markers Market Revenues & Volume, By Washability, 2022-2032F |
6.1.3 Indonesia Washable Markers Market Revenues & Volume, By Basic- Washable, 2022-2032F |
6.1.4 Indonesia Washable Markers Market Revenues & Volume, By Super-washable, 2022-2032F |
6.2 Indonesia Washable Markers Market, By End User |
6.2.1 Overview and Analysis |
6.2.2 Indonesia Washable Markers Market Revenues & Volume, By Children, 2022-2032F |
6.2.3 Indonesia Washable Markers Market Revenues & Volume, By Professionals, 2022-2032F |
7 Indonesia Washable Markers Market Import-Export Trade Statistics |
7.1 Indonesia Washable Markers Market Export to Major Countries |
7.2 Indonesia Washable Markers Market Imports from Major Countries |
8 Indonesia Washable Markers Market Key Performance Indicators |
8.1 % increase in the number of educational institutions promoting art programs |
8.2 % growth in the sales of eco-friendly stationery products in Indonesia |
8.3 Consumer surveys indicating the preference for washable markers over traditional markers |
9 Indonesia Washable Markers Market - Opportunity Assessment |
9.1 Indonesia Washable Markers Market Opportunity Assessment, By Washability, 2022 & 2032F |
9.2 Indonesia Washable Markers Market Opportunity Assessment, By End User, 2022 & 2032F |
10 Indonesia Washable Markers Market - Competitive Landscape |
10.1 Indonesia Washable Markers Market Revenue Share, By Companies, 2025 |
10.2 Indonesia Washable Markers Market Competitive Benchmarking, By Operating and Technical Parameters |
11 Company Profiles |
12 Recommendations |
13 Disclaimer |
Global Go To Market Strategy - 2030
Export potential enables firms to identify high-growth global markets with greater confidence by combining advanced trade intelligence with a structured quantitative methodology. The framework analyzes emerging demand trends and country-level import patterns while integrating macroeconomic and trade datasets such as GDP and population forecasts, bilateral import–export flows, tariff structures, elasticity differentials between developed and developing economies, geographic distance, and import demand projections. Using weighted trade values from 2020–2024 as the base period to project country-to-country export potential for 2030, these inputs are operationalized through calculated drivers such as gravity model parameters, tariff impact factors, and projected GDP per-capita growth. Through an analysis of hidden potentials, demand hotspots, and market conditions that are most favorable to success, this method enables firms to focus on target countries, maximize returns, and global expansion with data, backed by accuracy.
By factoring in the projected importer demand gap that is currently unmet and could be potential opportunity, it identifies the potential for the Exporter (Country) among 190 countries, against the general trade analysis, which identifies the biggest importer or exporter.
To discover high-growth global markets and optimize your business strategy:
Click Here
Pricing
- Single User License$ 1,995
- Department License$ 2,400
- Site License$ 3,120
- Global License$ 3,795

Leadership Perspectives from Industry Events
Search
Thought Leadership and Analyst Meet


Our Clients
6WResearch In News
- India Export Attractiveness Tracker 2026
- India Air Conditioner Market Set for Strong Rebound in 2026 After Weather-Led Correction and GST-Driven Recovery: 6Wresearch
- ADAS in India: How Automatic Emergency Braking, Blind Spot Detection & Driver Monitoring are Transforming Road Safety
- Doha a strategic location for EV manufacturing hub: IPA Qatar
- Demand for luxury TVs surging in the GCC, says Samsung
- Empowering Growth: The Thriving Journey of Bangladesh’s Cable Industry
Latest Reports
- Greece Insulated Sandwich Panels Market (2026-2032)
- Qatar Access and Home Network Market (2026-2032)
- Nicaragua RPG Gaming Market (2026-2032)
- New Zealand RPG Gaming Market (2026-2032)
- Netherlands RPG Gaming Market (2026-2032)
- Nauru RPG Gaming Market (2026-2032)
- Namibia RPG Gaming Market (2026-2032)
- Mozambique RPG Gaming Market (2026-2032)
- Montenegro RPG Gaming Market (2026-2032)
- Mongolia RPG Gaming Market (2026-2032)
Industry Events and Analyst Meet

EV India Expo 2026

HIMTEX 2026

India Refining Summit 2026

India EV Show 2026

EV tech India Expo 2026
Whitepaper
- Middle East & Africa Commercial Security Market Click here to view more.
- Middle East & Africa Fire Safety Systems & Equipment Market Click here to view more.
- GCC Drone Market Click here to view more.
- Middle East Lighting Fixture Market Click here to view more.
- GCC Physical & Perimeter Security Market Click here to view more.