Iraq Honey Market (2026-2032) | COVID-19 IMPACT, Outlook, Forecast, Trends, Growth, Companies, Share, Analysis, Revenue, Value, Industry & Size
Market Forecast By Type (Alfalfa Honey, Wildflower Honey, Buckwheat Honey, Acacia Honey, Clover Honey, Others), By Applications (Food and Beverage, Personal Care Products, Pharmaceuticals, Others), By Packaging (Bottle, Jar, Tube, Tub, Others) And Competitive Landscape
| Product Code: ETC015725 | Publication Date: Jun 2023 | Product Type: Report | ||
| Publisher: 6Wresearch | Author: Ravi Bhandari | No. of Pages: 70 | No. of Figures: 35 | No. of Tables: 5 |
Iraq Honey Market Summary
The iraq honey market was estimated at USD 1377 Million in 2025 and is projected to reach USD 1984 Million by 2032, growing at a CAGR of 6.1% from 2026 to 2032.
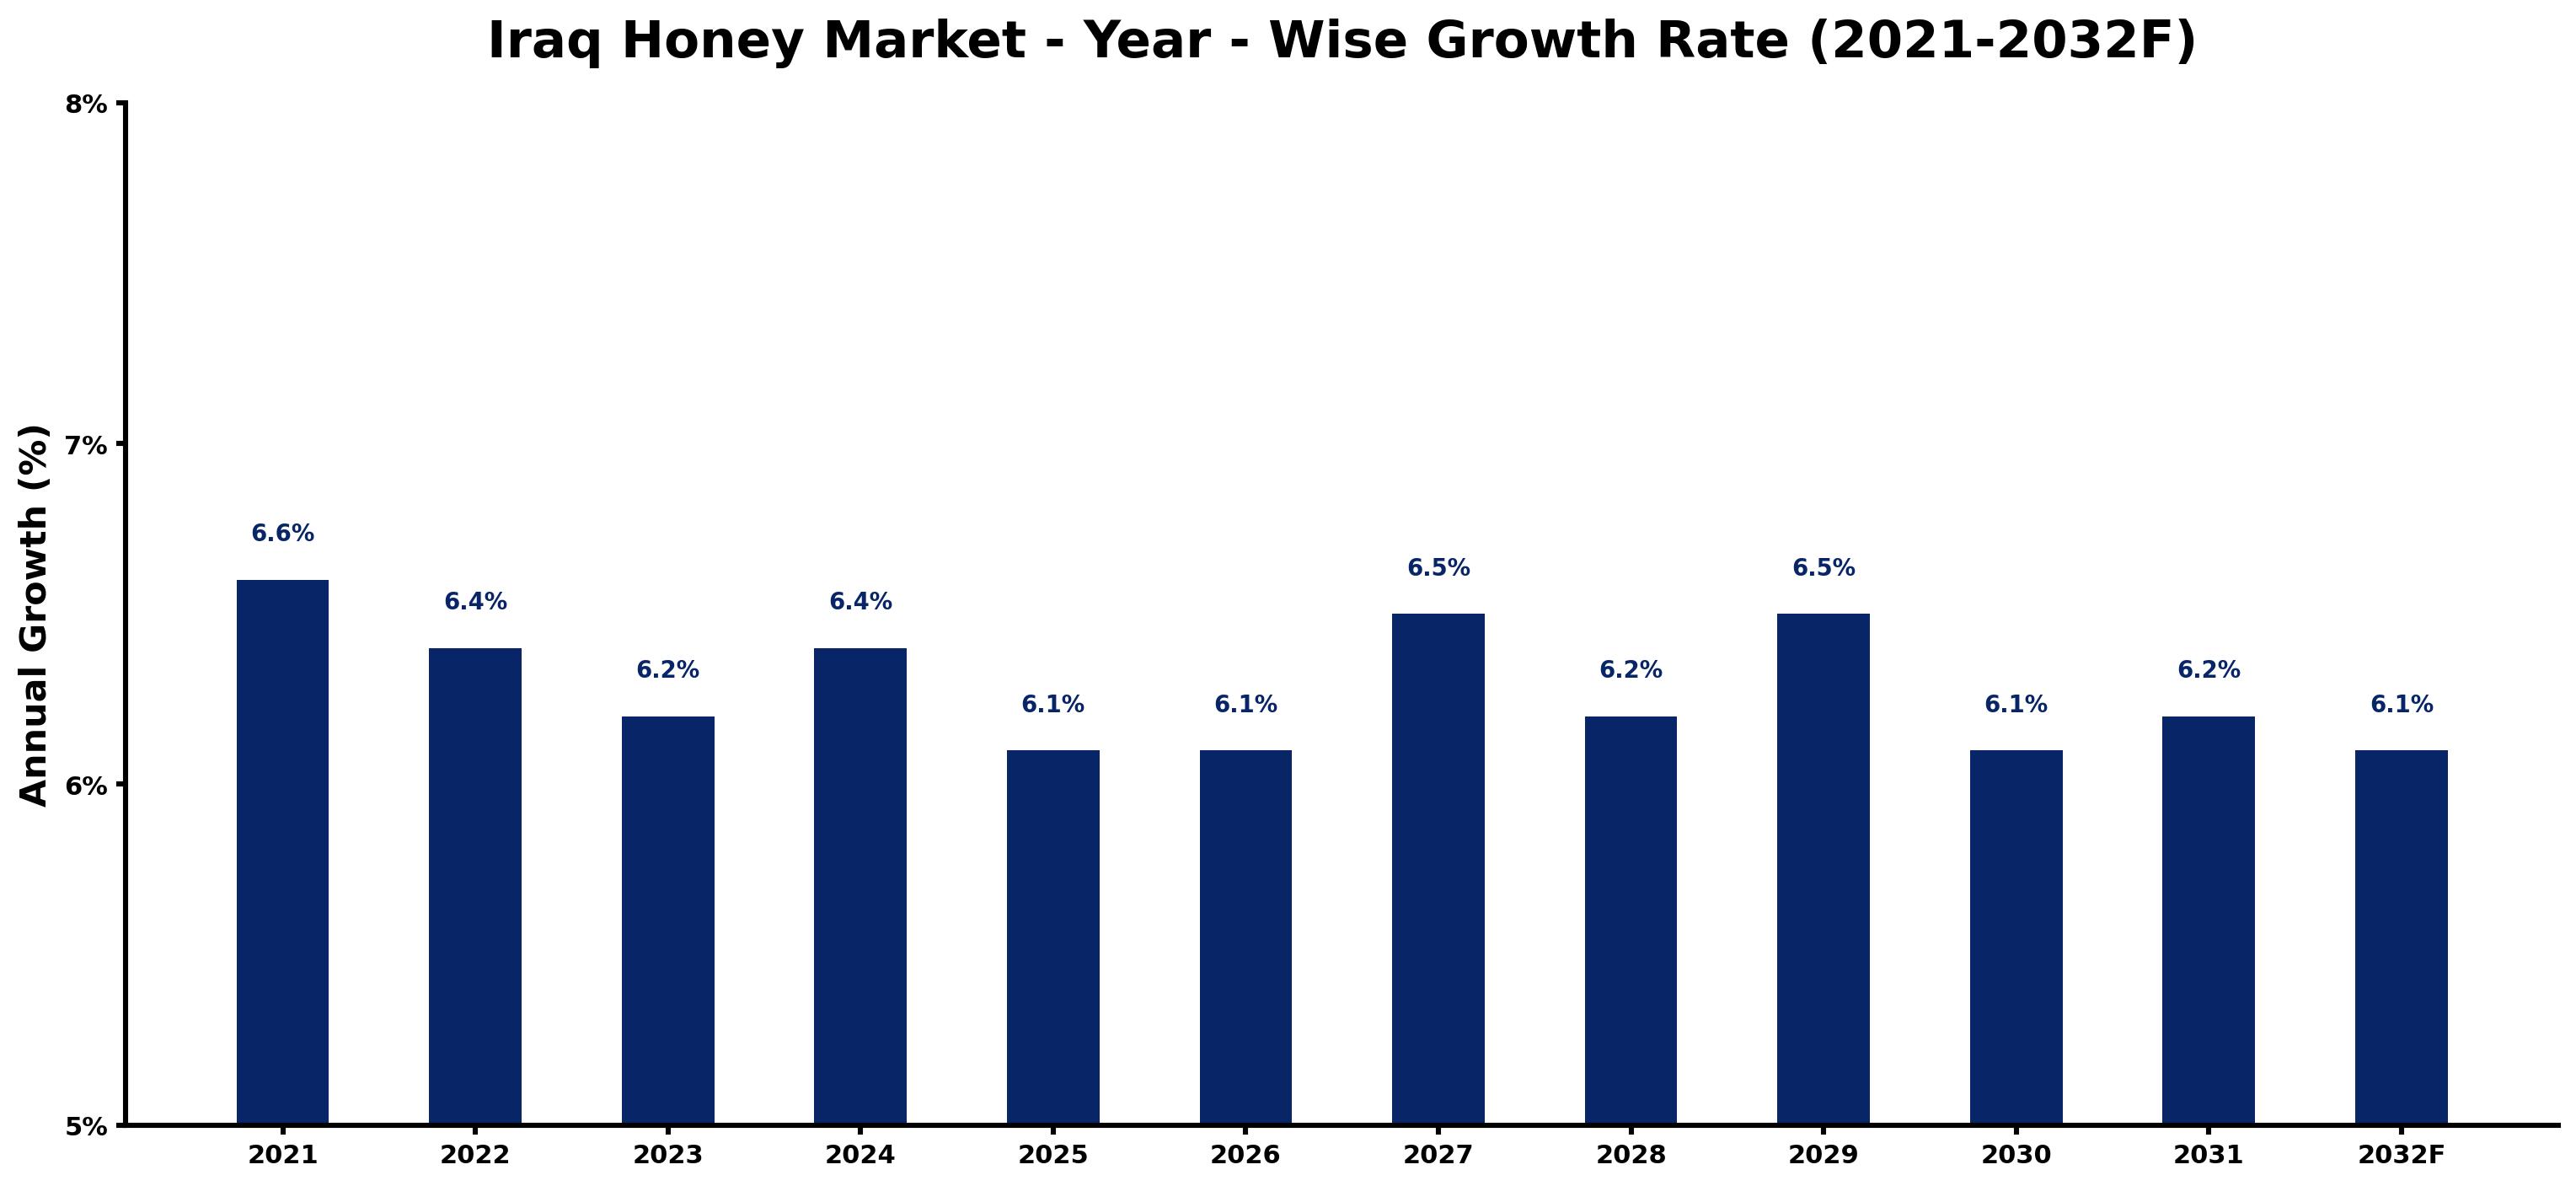
Iraq Honey Market Growth Rate Analysis (2021-2032)
The Iraq honey market has shown steady growth, reflecting a favorable demand environment. From 6.6% in 2021, the growth rate slightly decreased to 6.4% in 2022, attributed to supply chain challenges and geopolitical tensions. However, as conditions stabilized, growth rebounded to 6.2% in 2023 and is projected to hover around 6.1% to 6.5% through 2032. Key factors driving this market include rising consumer interest in natural sweeteners and health products, alongside increasing investments in local beekeeping initiatives and infrastructure improvements. The noteworthy digitalization of sales channels has further enhanced market accessibility, catering to evolving consumer preferences. This stable demand reinforces the sector's resilience despite transient fluctuations.
Iraq Honey Market Year-wise Growth Rate and Key Drivers
This graph highlights how the Iraq Honey Market has steadily grown over the past five years, supported by major growth factors.
The table below presents the year wise growth rates along with the key drivers influencing the market
| Year | Growth Rate | Major Drivers |
| 2021 | 6.6% | International interest in Iraq's organic honey attracts premium export opportunities. |
| 2022 | 6.4% | Local producers begin adopting modern beekeeping techniques to enhance honey quality. |
| 2023 | 6.2% | Urban markets witness an upswing in gourmet honey demand among health-conscious consumers. |
| 2024 | 6.4% | E-commerce platforms facilitate direct sales, expanding honey access across urban areas. |
| 2025 | 6.1% | Increased awareness about natural remedies boosts honey's popularity in wellness sectors. |
| 2026 | 6.1% | Regional trade agreements create favorable export conditions for Iraqi honey producers. |
| 2027 | 6.5% | Local festivals celebrating honey culture draw tourism and increase domestic sales. |
| 2028 | 6.2% | Investment in rural areas improves infrastructure for honey production and distribution. |
| 2029 | 6.5% | Emerging artisanal brands emphasize heritage and quality, appealing to niche markets. |
| 2030 | 6.1% | Sustainable practices gain traction, attracting environmentally conscious consumers and investors. |
| 2031 | 6.2% | Technological innovations in beekeeping enhance productivity and honey traceability standards. |
| 2032 | 6.1% | Collaboration between farmers and universities drives research on bee health and genetics. |
Note - Market size estimations and growth projections presented in this report are based on 6Wresearch's advanced forecasting approach, validated with industry datasets as of June 2026.
Iraq Honey Market Synopsis
The Iraq Honey Market is projected to reach 6.1% and witness significant growth during the forecast period (2026-2032). With an anticipated compound annual growth rate (CAGR) of approximately 8.5%, the market is positioned for a robust expansion driven by several key factors. The increasing consumer inclination towards naturally produced honey, alongside a growing awareness about its numerous health benefits, plays a pivotal role in this growth trajectory. In addition, the uptick in investments from both governmental agencies and private entities into beekeeping initiatives further propels market dynamics. The food and beverage sector's rising demand for honey, attributed to its natural sweetening attributes, is expected to amplify consumption rates in Iraq over the coming years. Yet, challenges such as high production costs and the prevalence of contaminated substitutes may hinder growth rates during this period.
Iraq Honey Market Growth Drivers
The significant growth of the Iraq Honey Market can be attributed to various interconnected drivers:
- The shift towards health-conscious consumption is a primary driver propelling the demand for naturally produced honey. This trend is marked by consumers seeking alternatives to processed sugars, which positions honey as a favored option.
- The Iraqi government's increasing focus on supporting the agriculture and apiculture sectors plays a crucial role in boosting honey production. Such initiatives are expected to enhance beekeeping practices and promote sustainability.
- Rising disposable incomes amongst consumers enable greater access to premium honey products, thus contributing to market growth. As the population becomes more affluent, they are more inclined to spend on high-quality, natural food products.
- The food and beverage industry's expanding use of honey as a sweetening agent fuels its consumption. The versatility of honey in various culinary applications further establishes its significance in this sector.
- The increasing awareness of the environmental benefits of beekeeping, such as pollination and ecosystem health, also serves as a motivator for growth in the industry. As consumers become more environmentally conscious, they tend to support products that are sustainably sourced.
Iraq Honey Market Challenges and Restraints
Despite the positive growth indicators, the Iraq Honey Market faces certain challenges:
- The high cost of production remains a significant barrier for many producers. Investment in quality control and safe production processes often leads to increased operational expenses.
- The presence of contaminated substitutes poses a risk to market integrity. This issue can lead to consumer distrust, affecting the overall reputation of honey products.
- Limited awareness and education regarding the distinct characteristics of pure honey versus adulterated products could result in consumer confusion, impacting purchasing decisions.
- Environmental factors and climate change have the potential to affect honey production rates, which can disrupt supply chains and market stability.
- Regulatory hurdles and lack of stringent food safety standards could hinder the growth of the honey market, as adherence to quality guidelines is vital for consumer protection and market development.
Iraq Honey Market Government Investment and Initiatives
The Iraqi government has recognized the potential of the honey market as a contributor to economic growth and food security. In recent years, various initiatives have been undertaken to bolster the beekeeping industry:
- Public funding has been allocated to support beekeeping projects, which aim to train new beekeepers and improve existing practices to increase honey yields.
- The establishment of research programs to study native bee species and their adaptation to local environmental conditions is crucial for sustainable honey production.
- Policies promoting organic agriculture are likely to benefit the honey market, as producers can capitalize on the growing demand for organic and natural products.
- Incentives for small-scale farmers to engage in beekeeping can enhance local economies and foster community-based initiatives, contributing to regional development.
- The government is focused on establishing guidelines and regulations aimed at ensuring honey quality, thereby enhancing consumer trust and fostering market growth.
Iraq Honey Market Latest Developments (May 2025 - June 2026)
The Iraq Honey Market has witnessed several noteworthy developments in the period spanning from May 2025 to June 2026. These developments reflect evolving market dynamics and industry direction:
- Increased collaboration between government entities and private organizations to enhance beekeeping practices has led to innovations in honey production techniques.
- There has been a growing emphasis on export opportunities, as producers seek to tap into international markets for high-quality Iraqi honey.
- Consumer education initiatives have been launched to promote the benefits of pure honey versus adulterated alternatives, aiming to build trust and transparency in the market.
- Sustainability practices have gained traction, with more emphasis on environmentally friendly production methods that align with global market trends.
- Research on bee health has been prioritized, with a focus on establishing best practices for disease management and hive maintenance in the region.
Iraq Honey Market - Key Attractiveness of the Report
- 10 Years of Market Numbers
- Historical Data Starting from 2022 to 2025
- Base Year: 2025
- Forecast Data until 2032
- Key Performance Indicators Impacting the Market
- Major Upcoming Developments and Projects
Key Highlights of the Report:
- Iraq Honey Market Outlook
- Market Size of Iraq Honey Market, 2025
- Forecast of Iraq Honey Market, 2032F
- Historical Data and Forecast of Iraq Honey Revenues & Volume for the Period 2022-2032F
- Iraq Honey Market Trend Evolution
- Iraq Honey Market Drivers and Challenges
- Iraq Honey Price Trends
- Iraq Honey Porter's Five Forces
- Iraq Honey Industry Life Cycle
- Historical Data and Forecast of Iraq Honey Market Revenues & Volume By Type for the Period 2022-2032F
- Historical Data and Forecast of Iraq Honey Market Revenues & Volume By Alfalfa Honey for the Period 2022-2032F
- Historical Data and Forecast of Iraq Honey Market Revenues & Volume By Wildflower Honey for the Period 2022-2032F
- Historical Data and Forecast of Iraq Honey Market Revenues & Volume By Buckwheat Honey for the Period 2022-2032F
- Historical Data and Forecast of Iraq Honey Market Revenues & Volume By Acacia Honey for the Period 2022-2032F
- Historical Data and Forecast of Iraq Honey Market Revenues & Volume By Clover Honey for the Period 2022-2032F
- Historical Data and Forecast of Iraq Honey Market Revenues & Volume By Others for the Period 2022-2032F
- Historical Data and Forecast of Iraq Honey Market Revenues & Volume By Applications for the Period 2022-2032F
- Historical Data and Forecast of Iraq Honey Market Revenues & Volume By Food and Beverage for the Period 2022-2032F
- Historical Data and Forecast of Iraq Honey Market Revenues & Volume By Personal Care Products for the Period 2022-2032F
- Historical Data and Forecast of Iraq Honey Market Revenues & Volume By Pharmaceuticals for the Period 2022-2032F
- Historical Data and Forecast of Iraq Honey Market Revenues & Volume By Others for the Period 2022-2032F
- Historical Data and Forecast of Iraq Honey Market Revenues & Volume By Packaging for the Period 2022-2032F
- Historical Data and Forecast of Iraq Honey Market Revenues & Volume By Bottle for the Period 2022-2032F
- Historical Data and Forecast of Iraq Honey Market Revenues & Volume By Jar for the Period 2022-2032F
- Historical Data and Forecast of Iraq Honey Market Revenues & Volume By Tube for the Period 2022-2032F
- Historical Data and Forecast of Iraq Honey Market Revenues & Volume By Tub for the Period 2022-2032F
- Historical Data and Forecast of Iraq Honey Market Revenues & Volume By Others for the Period 2022-2032F
- Iraq Honey Import Export Trade Statistics
- Market Opportunity Assessment By Type
- Market Opportunity Assessment By Applications
- Market Opportunity Assessment By Packaging
- Iraq Honey Top Companies Market Share
- Iraq Honey Competitive Benchmarking By Technical and Operational Parameters
- Iraq Honey Company Profiles
- Iraq Honey Key Strategic Recommendations
Frequently Asked Questions About the Market Study (FAQs):
The growth is primarily driven by rising demand for natural products, increased health awareness among consumers, and government investments in the beekeeping sector.
The government is investing in training programs, developing regulatory frameworks for quality assurance, and promoting sustainable beekeeping practices.
Key challenges include high production costs, the presence of contaminated substitutes, and environmental factors affecting bee health.
Trends include increased focus on organic honey production, rising consumer education efforts, and sustainability practices within the industry.
6Wresearch actively monitors the Iraq Honey Market and publishes its comprehensive annual report, highlighting emerging trends, growth drivers, revenue analysis, and forecast outlook. Our insights help businesses to make data-backed strategic decisions with ongoing market dynamics. Our analysts track relevent industries related to the Iraq Honey Market, allowing our clients with actionable intelligence and reliable forecasts tailored to emerging regional needs.
Yes, we provide customisation as per your requirements. To learn more, feel free to contact us on sales@6wresearch.com
1 Executive Summary |
2 Introduction |
2.1 Key Highlights of the Report |
2.2 Report Description |
2.3 Market Scope & Segmentation |
2.4 Research Methodology |
2.5 Assumptions |
3 Iraq Honey Market Overview |
3.1 Iraq Country Macro Economic Indicators |
3.2 Iraq Honey Market Revenues & Volume, 2022 & 2032F |
3.3 Iraq Honey Market - Industry Life Cycle |
3.4 Iraq Honey Market - Porter's Five Forces |
3.5 Iraq Honey Market Revenues & Volume Share, By Type, 2022 & 2032F |
3.6 Iraq Honey Market Revenues & Volume Share, By Applications, 2022 & 2032F |
3.7 Iraq Honey Market Revenues & Volume Share, By Packaging, 2022 & 2032F |
4 Iraq Honey Market Dynamics |
4.1 Impact Analysis |
4.2 Market Drivers |
4.3 Market Restraints |
5 Iraq Honey Market Trends |
6 Iraq Honey Market, By Types |
6.1 Iraq Honey Market, By Type |
6.1.1 Overview and Analysis |
6.1.2 Iraq Honey Market Revenues & Volume, By Type, 2022-2032F |
6.1.3 Iraq Honey Market Revenues & Volume, By Alfalfa Honey, 2022-2032F |
6.1.4 Iraq Honey Market Revenues & Volume, By Wildflower Honey, 2022-2032F |
6.1.5 Iraq Honey Market Revenues & Volume, By Buckwheat Honey, 2022-2032F |
6.1.6 Iraq Honey Market Revenues & Volume, By Acacia Honey, 2022-2032F |
6.1.7 Iraq Honey Market Revenues & Volume, By Clover Honey, 2022-2032F |
6.1.8 Iraq Honey Market Revenues & Volume, By Others, 2022-2032F |
6.2 Iraq Honey Market, By Applications |
6.2.1 Overview and Analysis |
6.2.2 Iraq Honey Market Revenues & Volume, By Food and Beverage, 2022-2032F |
6.2.3 Iraq Honey Market Revenues & Volume, By Personal Care Products, 2022-2032F |
6.2.4 Iraq Honey Market Revenues & Volume, By Pharmaceuticals, 2022-2032F |
6.2.5 Iraq Honey Market Revenues & Volume, By Others, 2022-2032F |
6.3 Iraq Honey Market, By Packaging |
6.3.1 Overview and Analysis |
6.3.2 Iraq Honey Market Revenues & Volume, By Bottle, 2022-2032F |
6.3.3 Iraq Honey Market Revenues & Volume, By Jar, 2022-2032F |
6.3.4 Iraq Honey Market Revenues & Volume, By Tube, 2022-2032F |
6.3.5 Iraq Honey Market Revenues & Volume, By Tub, 2022-2032F |
6.3.6 Iraq Honey Market Revenues & Volume, By Others, 2022-2032F |
7 Iraq Honey Market Import-Export Trade Statistics |
7.1 Iraq Honey Market Export to Major Countries |
7.2 Iraq Honey Market Imports from Major Countries |
8 Iraq Honey Market Key Performance Indicators |
9 Iraq Honey Market - Opportunity Assessment |
9.1 Iraq Honey Market Opportunity Assessment, By Type, 2022 & 2032F |
9.2 Iraq Honey Market Opportunity Assessment, By Applications, 2022 & 2032F |
9.3 Iraq Honey Market Opportunity Assessment, By Packaging, 2022 & 2032F |
10 Iraq Honey Market - Competitive Landscape |
10.1 Iraq Honey Market Revenue Share, By Companies, 2025 |
10.2 Iraq Honey Market Competitive Benchmarking, By Operating and Technical Parameters |
11 Company Profiles |
12 Recommendations |
13 Disclaimer |
Global Go To Market Strategy - 2030
Export potential enables firms to identify high-growth global markets with greater confidence by combining advanced trade intelligence with a structured quantitative methodology. The framework analyzes emerging demand trends and country-level import patterns while integrating macroeconomic and trade datasets such as GDP and population forecasts, bilateral import–export flows, tariff structures, elasticity differentials between developed and developing economies, geographic distance, and import demand projections. Using weighted trade values from 2020–2024 as the base period to project country-to-country export potential for 2030, these inputs are operationalized through calculated drivers such as gravity model parameters, tariff impact factors, and projected GDP per-capita growth. Through an analysis of hidden potentials, demand hotspots, and market conditions that are most favorable to success, this method enables firms to focus on target countries, maximize returns, and global expansion with data, backed by accuracy.
By factoring in the projected importer demand gap that is currently unmet and could be potential opportunity, it identifies the potential for the Exporter (Country) among 190 countries, against the general trade analysis, which identifies the biggest importer or exporter.
To discover high-growth global markets and optimize your business strategy:
Click Here
Pricing
- Single User License$ 1,995
- Department License$ 2,400
- Site License$ 3,120
- Global License$ 3,795

Leadership Perspectives from Industry Events
Search
Thought Leadership and Analyst Meet


Our Clients
6WResearch In News
- India Air Conditioner Market Set for Strong Rebound in 2026 After Weather-Led Correction and GST-Driven Recovery: 6Wresearch
- ADAS in India: How Automatic Emergency Braking, Blind Spot Detection & Driver Monitoring are Transforming Road Safety
- Doha a strategic location for EV manufacturing hub: IPA Qatar
- Demand for luxury TVs surging in the GCC, says Samsung
- Empowering Growth: The Thriving Journey of Bangladesh’s Cable Industry
- Demand for luxury TVs surging in the GCC, says Samsung
Latest Reports
- Poland Fire Protection Systems Market (2026-2032)
- Cape Verde Portable Hand-Thrown Extinguisher Market (2026-2032)
- Canada Portable Hand-Thrown Extinguisher Market (2026-2032)
- Cameroon Portable Hand-Thrown Extinguisher Market (2026-2032)
- Burundi Portable Hand-Thrown Extinguisher Market (2026-2032)
- Burkina Faso Portable Hand-Thrown Extinguisher Market (2026-2032)
- Bulgaria Portable Hand-Thrown Extinguisher Market (2026-2032)
- Brunei Portable Hand-Thrown Extinguisher Market (2026-2032)
- Botswana Portable Hand-Thrown Extinguisher Market (2026-2032)
- Bosnia and Herzegovina Portable Hand-Thrown Extinguisher Market (2026-2032)
Industry Events and Analyst Meet

HIMTEX 2026

India Refining Summit 2026

India EV Show 2026

EV tech India Expo 2026

Auto Tech Asia 2026
Whitepaper
- Middle East & Africa Commercial Security Market Click here to view more.
- Middle East & Africa Fire Safety Systems & Equipment Market Click here to view more.
- GCC Drone Market Click here to view more.
- Middle East Lighting Fixture Market Click here to view more.
- GCC Physical & Perimeter Security Market Click here to view more.