Italy Anti Static Brush Market (2026-2032) Outlook | Value, Trends, Share, Industry, Companies, Size, Analysis, Revenue, Forecast & Growth
Market Forecast By Product (Toothbrush Type, Paint Brush Type, U Type, Special Type), By Application (Electronic Components, Static Charge Sensitive Products) And Competitive Landscape
| Product Code: ETC250213 | Publication Date: Aug 2022 | Updated Date: Apr 2026 | Product Type: Market Research Report | |
| Publisher: 6Wresearch | Author: Ravi Bhandari | No. of Pages: 75 | No. of Figures: 35 | No. of Tables: 20 |
Italy Anti Static Brush Market Size (2020-2030)
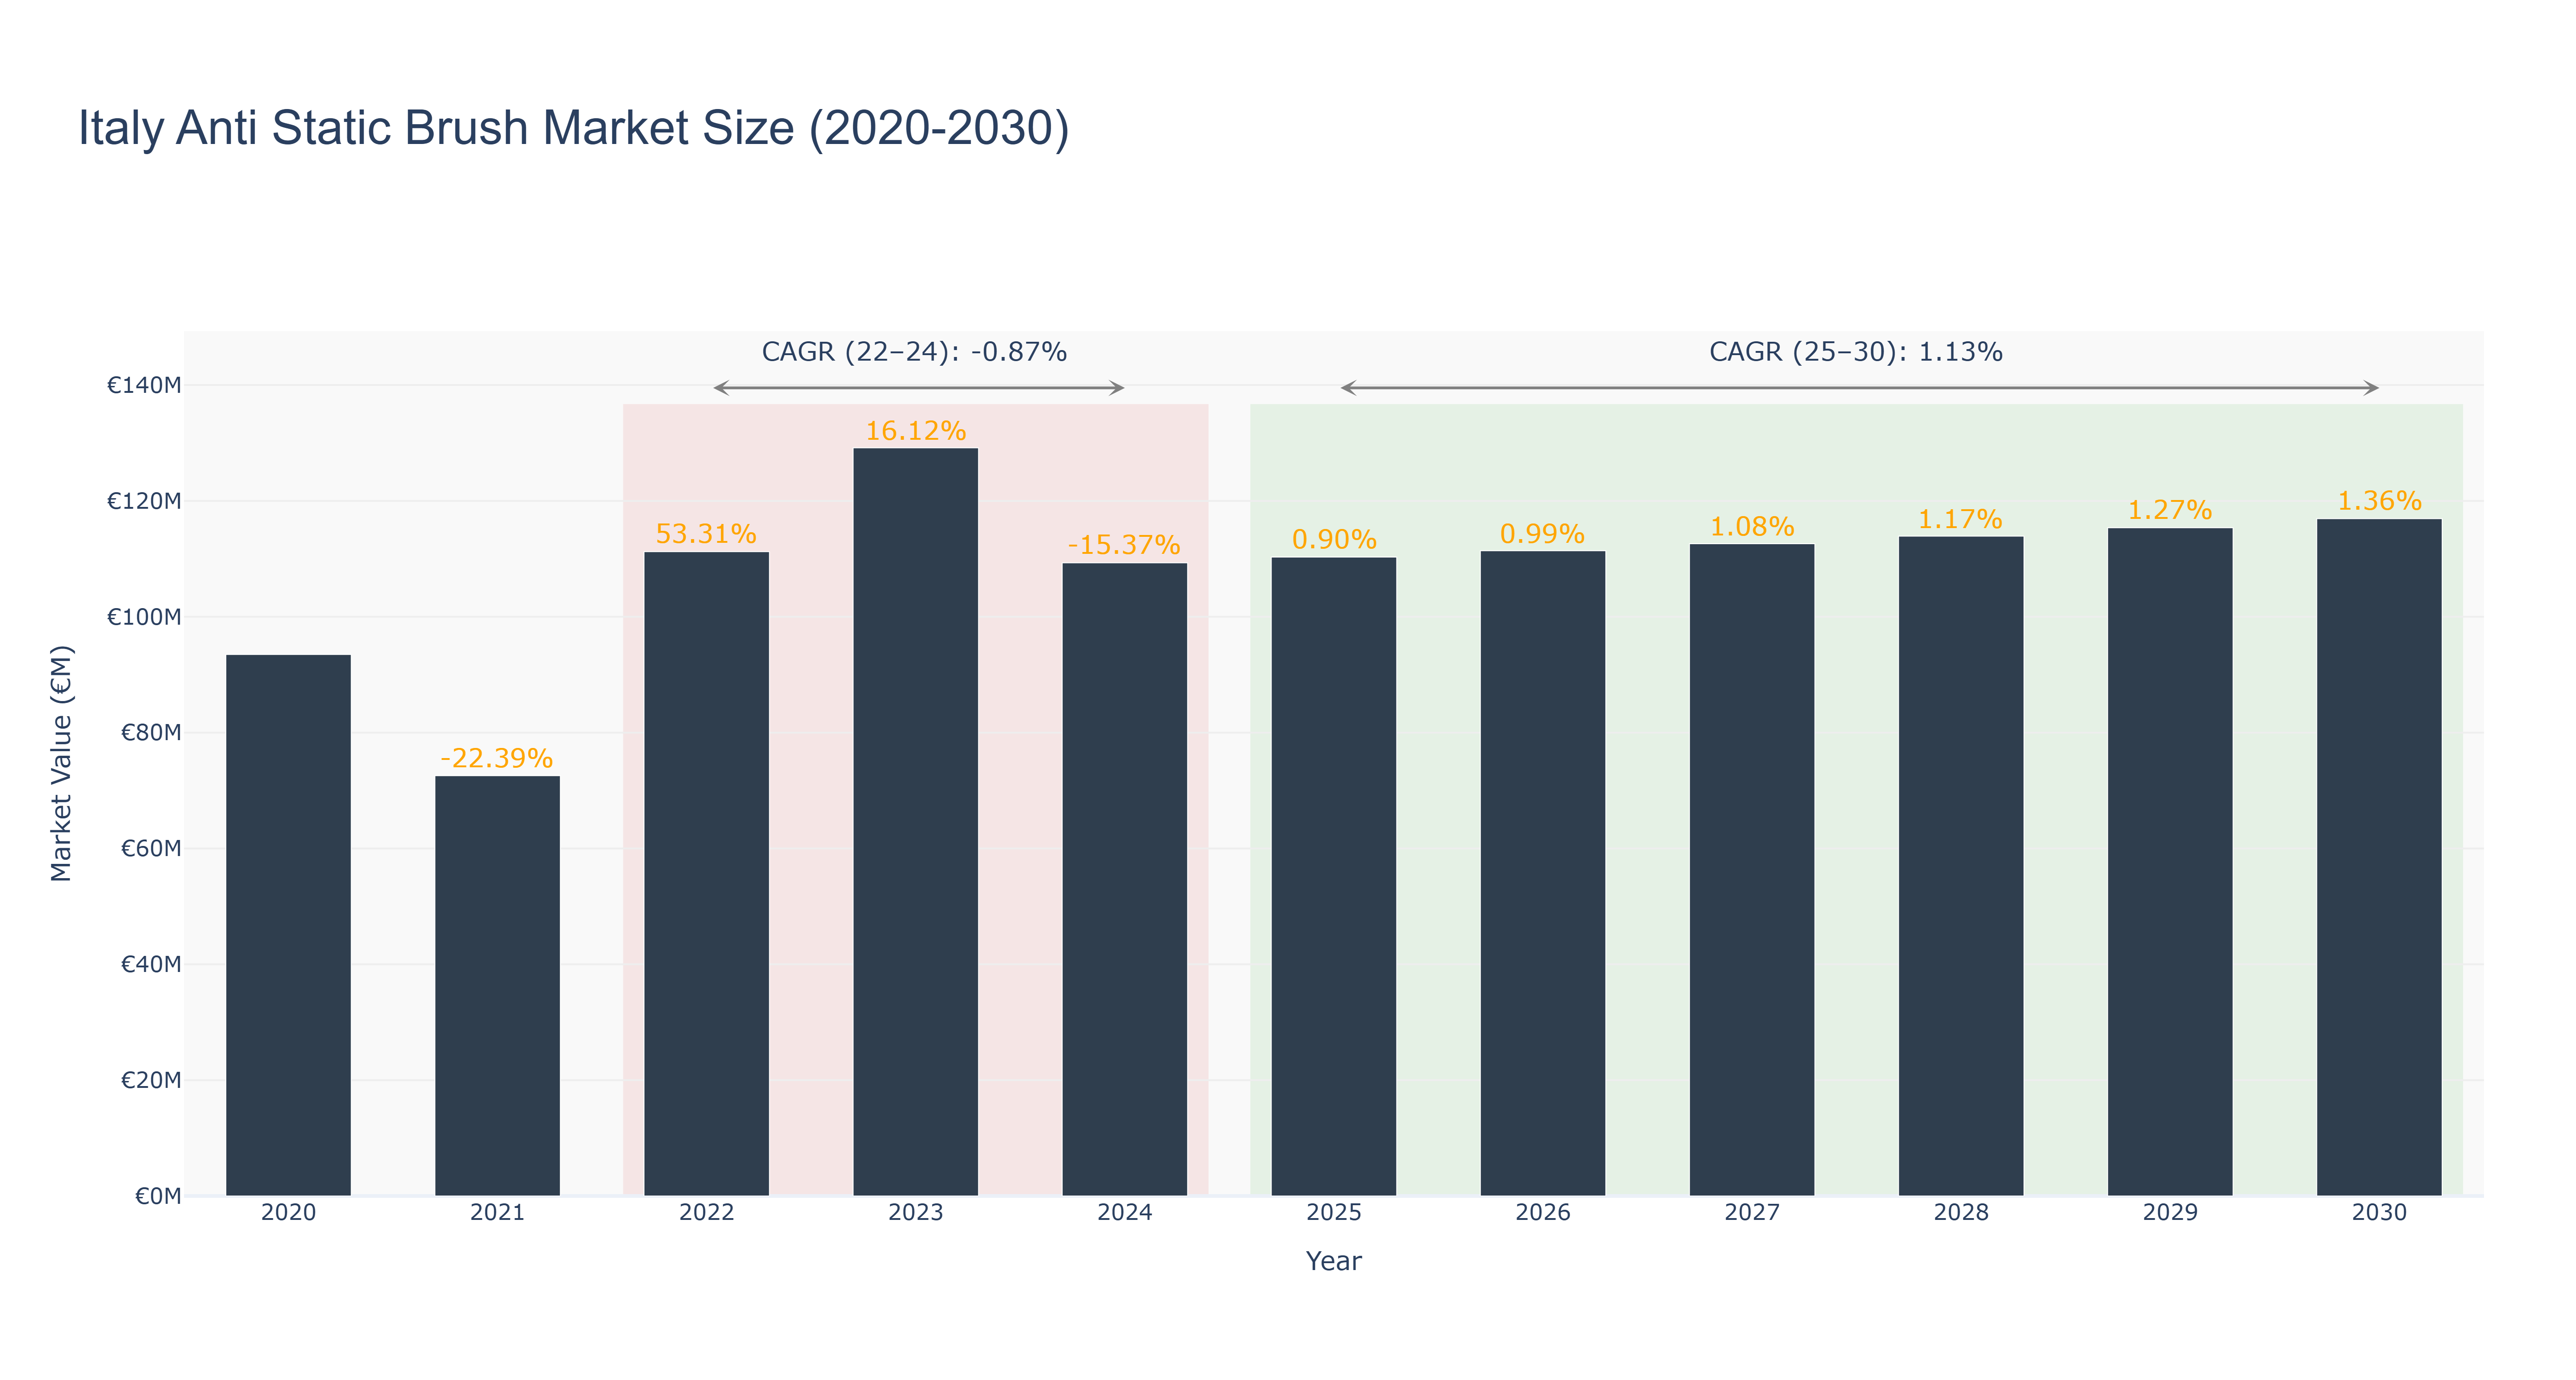
Italy's Anti Static Brush Market witnessed a peak market size of €129.17 million in 2023. The actual market size fluctuated from €93.50 million in 2020 to €109.31 million in 2024, experiencing a decline in 2024. Forecasted to grow steadily, the market is expected to reach €116.93 million by 2030, with a CAGR of -0.87% (2022-24) and 1.13% (2025-30). The market faced a downturn in 2024 due to economic uncertainties, but rebounded with consistent growth thereafter. Industry drivers such as increasing demand for electronic devices and technological advancements are propelling the market forward. Looking ahead, Italy is set to introduce new regulations promoting sustainable manufacturing practices, which will drive further growth in the Anti Static Brush Market.
Italy Anti Static Brush Market: Production & Trade Performance (2019-2025)
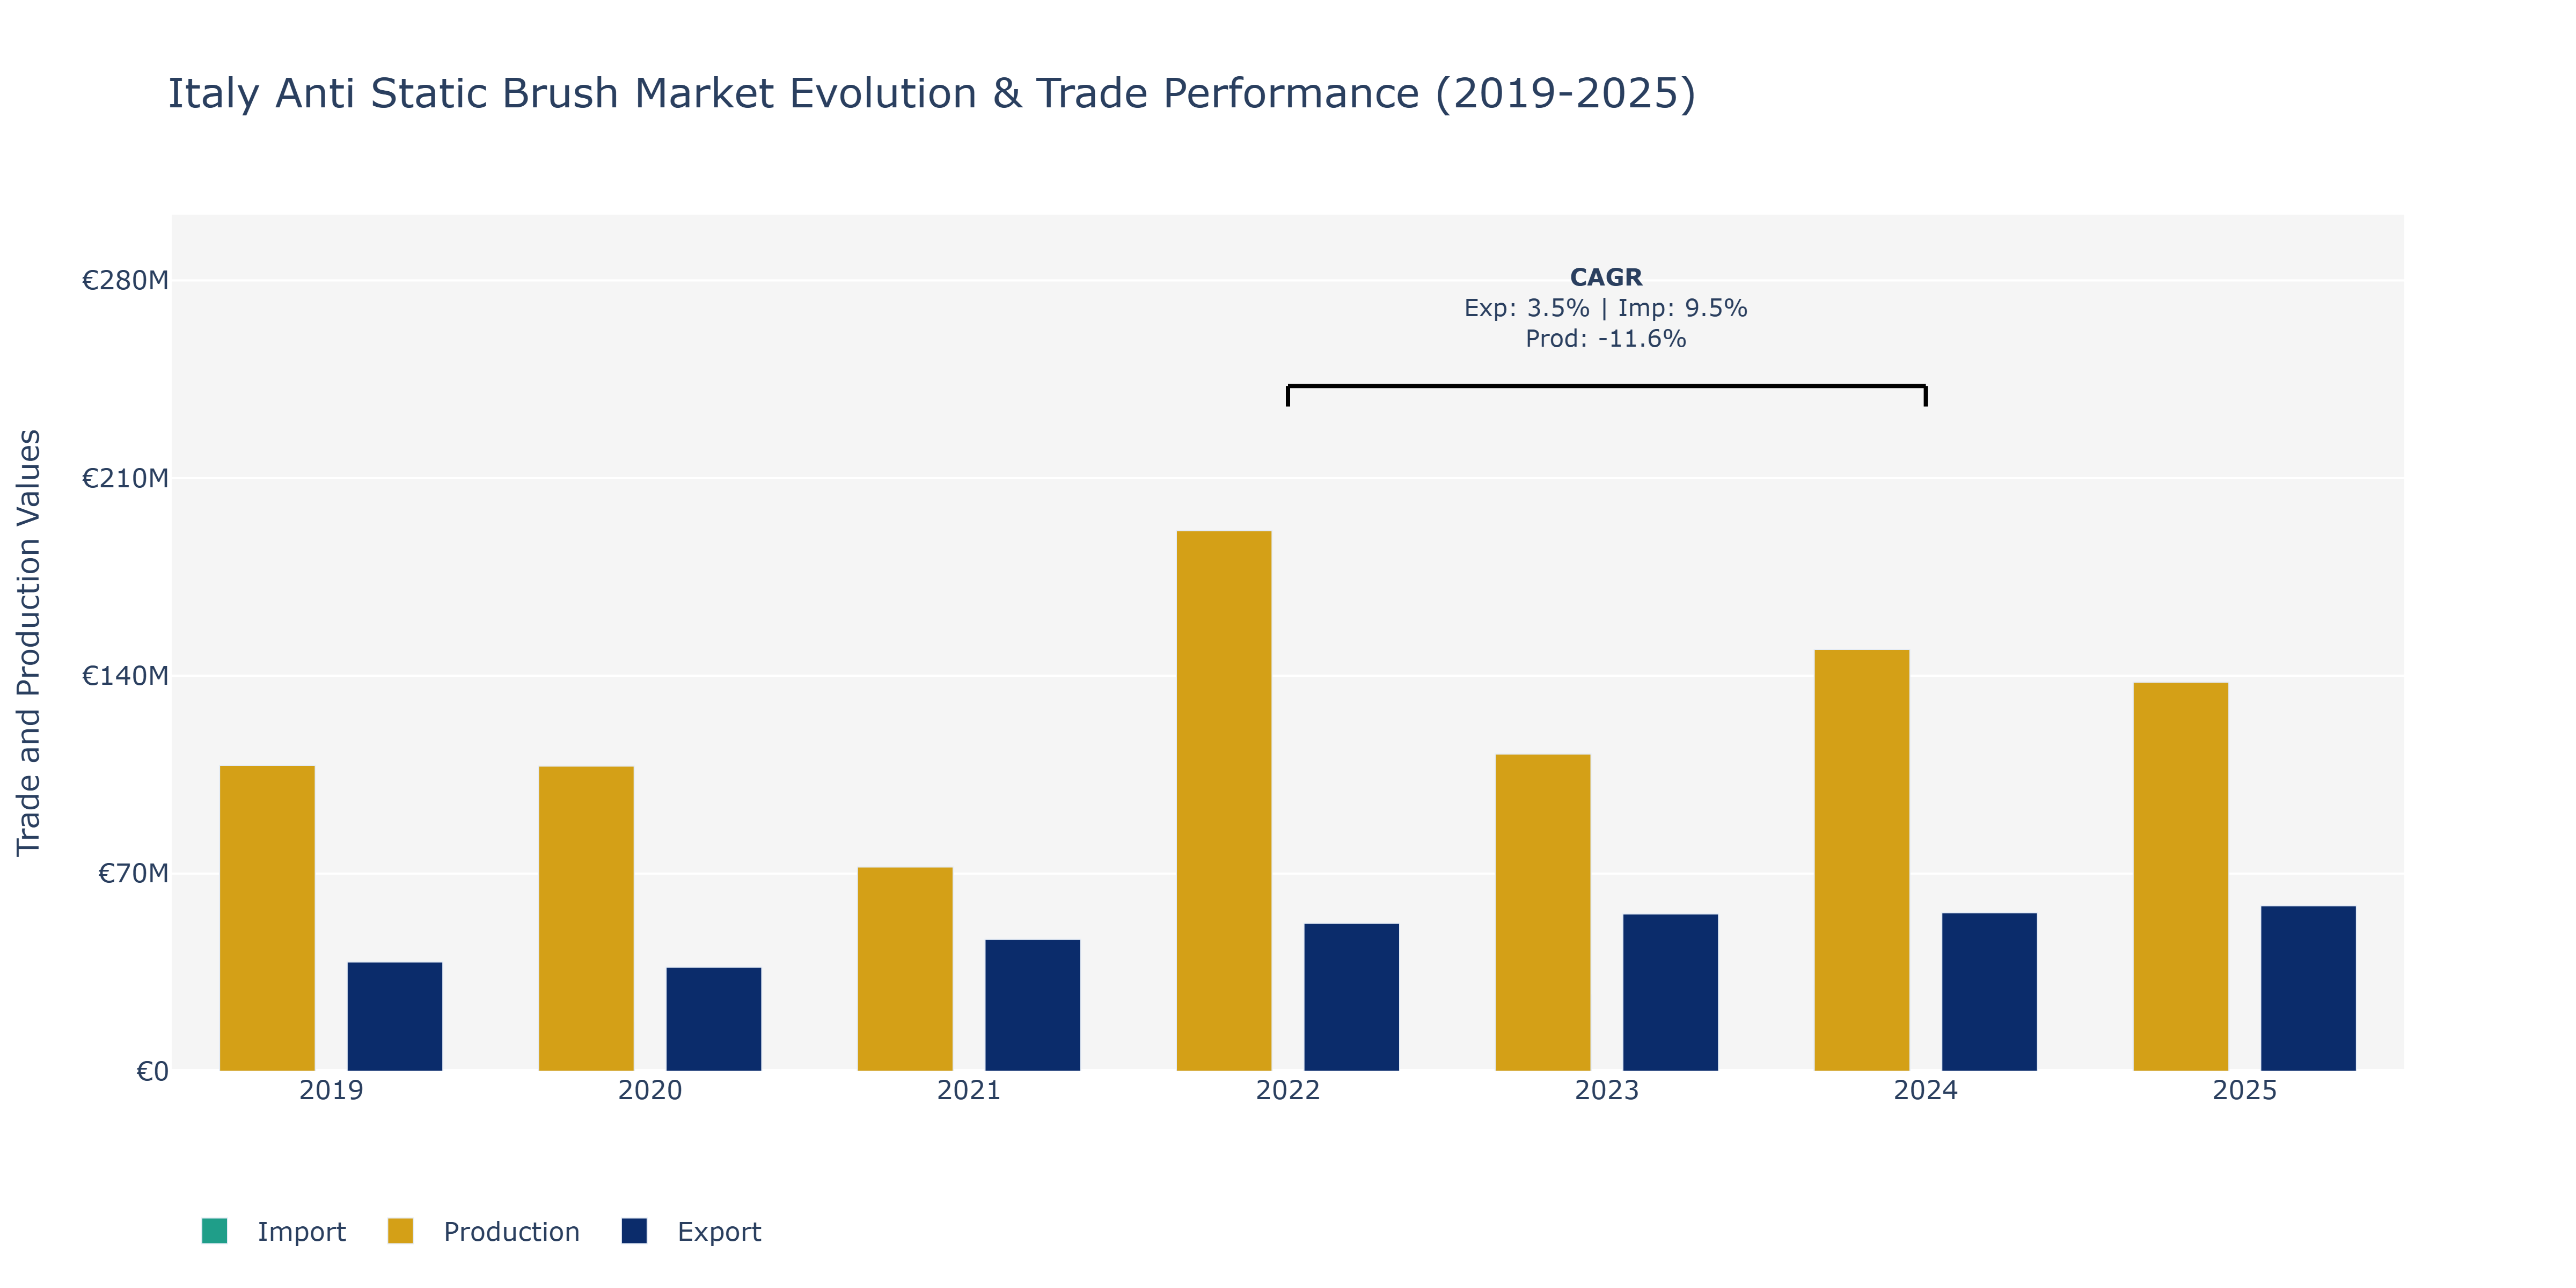
In the Italy Anti Static Brush Market, from 2019 to 2025, Exports showed fluctuations with a peak in 2025 at approximately €58.59 million while Imports experienced a steady increase, reaching about €33.04 million in 2025. Production, however, declined notably from €108.31 million in 2019 to around €72.31 million in 2021, before rebounding to about €137.74 million in 2025. The rise in Exports can be attributed to increased global demand for electronic products, driving the need for anti-static brushes in manufacturing processes. On the other hand, the upward trend in Imports could be due to the availability of technologically advanced anti-static brushes from foreign markets. The fluctuation in Production may have been influenced by supply chain disruptions and shifts in consumer preferences towards more innovative anti-static solutions. These market movements highlight the importance of adapting to evolving industry dynamics to maintain competitiveness in the anti-static brush sector.
Key Highlights of the Report:
- Italy Anti Static Brush Market Outlook
- Market Size of Italy Anti Static Brush Market, 2025
- Forecast of Italy Anti Static Brush Market, 2032
- Historical Data and Forecast of Italy Anti Static Brush Revenues & Volume for the Period 2022-2032F
- Italy Anti Static Brush Market Trend Evolution
- Italy Anti Static Brush Market Drivers and Challenges
- Italy Anti Static Brush Price Trends
- Italy Anti Static Brush Porter's Five Forces
- Italy Anti Static Brush Industry Life Cycle
- Historical Data and Forecast of Italy Anti Static Brush Market Revenues & Volume By Product for the Period 2022-2032F
- Historical Data and Forecast of Italy Anti Static Brush Market Revenues & Volume By Toothbrush Type for the Period 2022-2032F
- Historical Data and Forecast of Italy Anti Static Brush Market Revenues & Volume By Paint Brush Type for the Period 2022-2032F
- Historical Data and Forecast of Italy Anti Static Brush Market Revenues & Volume By U Type for the Period 2022-2032F
- Historical Data and Forecast of Italy Anti Static Brush Market Revenues & Volume By Special Type for the Period 2022-2032F
- Historical Data and Forecast of Italy Anti Static Brush Market Revenues & Volume By Application for the Period 2022-2032F
- Historical Data and Forecast of Italy Anti Static Brush Market Revenues & Volume By Electronic Components for the Period 2022-2032F
- Historical Data and Forecast of Italy Anti Static Brush Market Revenues & Volume By Static Charge Sensitive Products for the Period 2022-2032F
- Italy Anti Static Brush Import Export Trade Statistics
- Market Opportunity Assessment By Product
- Market Opportunity Assessment By Application
- Italy Anti Static Brush Top Companies Market Share
- Italy Anti Static Brush Competitive Benchmarking By Technical and Operational Parameters
- Italy Anti Static Brush Company Profiles
- Italy Anti Static Brush Key Strategic Recommendations
Frequently Asked Questions About the Market Study (FAQs):
6Wresearch actively monitors the Italy Anti Static Brush Market and publishes its comprehensive annual report, highlighting emerging trends, growth drivers, revenue analysis, and forecast outlook. Our insights help businesses to make data-backed strategic decisions with ongoing market dynamics. Our analysts track relevent industries related to the Italy Anti Static Brush Market, allowing our clients with actionable intelligence and reliable forecasts tailored to emerging regional needs.
Yes, we provide customisation as per your requirements. To learn more, feel free to contact us on sales@6wresearch.com
1 Executive Summary |
2 Introduction |
2.1 Key Highlights of the Report |
2.2 Report Description |
2.3 Market Scope & Segmentation |
2.4 Research Methodology |
2.5 Assumptions |
3 Italy Anti Static Brush Market Overview |
3.1 Italy Country Macro Economic Indicators |
3.2 Italy Anti Static Brush Market Revenues & Volume, 2022 & 2032F |
3.3 Italy Anti Static Brush Market - Industry Life Cycle |
3.4 Italy Anti Static Brush Market - Porter's Five Forces |
3.5 Italy Anti Static Brush Market Revenues & Volume Share, By Product, 2022 & 2032F |
3.6 Italy Anti Static Brush Market Revenues & Volume Share, By Application, 2022 & 2032F |
4 Italy Anti Static Brush Market Dynamics |
4.1 Impact Analysis |
4.2 Market Drivers |
4.2.1 Increasing focus on workplace safety and cleanliness leading to higher demand for anti static brushes. |
4.2.2 Growing adoption of advanced manufacturing processes in industries such as electronics and automotive requiring anti static brushes. |
4.2.3 Rising awareness about the importance of static control measures among consumers and businesses. |
4.3 Market Restraints |
4.3.1 Intense competition from alternative solutions such as anti static sprays and mats. |
4.3.2 Fluctuations in raw material prices affecting production costs and pricing of anti static brushes. |
4.3.3 Lack of standardized regulations and guidelines for anti static products leading to market confusion. |
5 Italy Anti Static Brush Market Trends |
6 Italy Anti Static Brush Market, By Types |
6.1 Italy Anti Static Brush Market, By Product |
6.1.1 Overview and Analysis |
6.1.2 Italy Anti Static Brush Market Revenues & Volume, By Product, 2022 - 2032F |
6.1.3 Italy Anti Static Brush Market Revenues & Volume, By Toothbrush Type, 2022 - 2032F |
6.1.4 Italy Anti Static Brush Market Revenues & Volume, By Paint Brush Type, 2022 - 2032F |
6.1.5 Italy Anti Static Brush Market Revenues & Volume, By U Type, 2022 - 2032F |
6.1.6 Italy Anti Static Brush Market Revenues & Volume, By Special Type, 2022 - 2032F |
6.2 Italy Anti Static Brush Market, By Application |
6.2.1 Overview and Analysis |
6.2.2 Italy Anti Static Brush Market Revenues & Volume, By Electronic Components, 2022 - 2032F |
6.2.3 Italy Anti Static Brush Market Revenues & Volume, By Static Charge Sensitive Products, 2022 - 2032F |
7 Italy Anti Static Brush Market Import-Export Trade Statistics |
7.1 Italy Anti Static Brush Market Export to Major Countries |
7.2 Italy Anti Static Brush Market Imports from Major Countries |
8 Italy Anti Static Brush Market Key Performance Indicators |
8.1 Number of new product launches in the anti static brush market. |
8.2 Adoption rate of anti static brushes in key industries. |
8.3 Customer satisfaction levels with anti static brush performance. |
8.4 Percentage of market expansion into new regions or applications. |
8.5 Innovation rate within the anti static brush market. |
9 Italy Anti Static Brush Market - Opportunity Assessment |
9.1 Italy Anti Static Brush Market Opportunity Assessment, By Product, 2022 & 2032F |
9.2 Italy Anti Static Brush Market Opportunity Assessment, By Application, 2022 & 2032F |
10 Italy Anti Static Brush Market - Competitive Landscape |
10.1 Italy Anti Static Brush Market Revenue Share, By Companies, 2025 |
10.2 Italy Anti Static Brush Market Competitive Benchmarking, By Operating and Technical Parameters |
11 Company Profiles |
12 Recommendations |
13 Disclaimer |
Global Go To Market Strategy - 2030
Export potential enables firms to identify high-growth global markets with greater confidence by combining advanced trade intelligence with a structured quantitative methodology. The framework analyzes emerging demand trends and country-level import patterns while integrating macroeconomic and trade datasets such as GDP and population forecasts, bilateral import–export flows, tariff structures, elasticity differentials between developed and developing economies, geographic distance, and import demand projections. Using weighted trade values from 2020–2024 as the base period to project country-to-country export potential for 2030, these inputs are operationalized through calculated drivers such as gravity model parameters, tariff impact factors, and projected GDP per-capita growth. Through an analysis of hidden potentials, demand hotspots, and market conditions that are most favorable to success, this method enables firms to focus on target countries, maximize returns, and global expansion with data, backed by accuracy.
By factoring in the projected importer demand gap that is currently unmet and could be potential opportunity, it identifies the potential for the Exporter (Country) among 190 countries, against the general trade analysis, which identifies the biggest importer or exporter.
To discover high-growth global markets and optimize your business strategy:
Click Here
Pricing
- Single User License$ 1,995
- Department License$ 2,400
- Site License$ 3,120
- Global License$ 3,795

Leadership Perspectives from Industry Events
Search
Thought Leadership and Analyst Meet


Our Clients
6WResearch In News
- India Air Conditioner Market Set for Strong Rebound in 2026 After Weather-Led Correction and GST-Driven Recovery: 6Wresearch
- ADAS in India: How Automatic Emergency Braking, Blind Spot Detection & Driver Monitoring are Transforming Road Safety
- Doha a strategic location for EV manufacturing hub: IPA Qatar
- Demand for luxury TVs surging in the GCC, says Samsung
- Empowering Growth: The Thriving Journey of Bangladesh’s Cable Industry
- Demand for luxury TVs surging in the GCC, says Samsung
Latest Reports
- Poland Fire Protection Systems Market (2026-2032)
- Cape Verde Portable Hand-Thrown Extinguisher Market (2026-2032)
- Canada Portable Hand-Thrown Extinguisher Market (2026-2032)
- Cameroon Portable Hand-Thrown Extinguisher Market (2026-2032)
- Burundi Portable Hand-Thrown Extinguisher Market (2026-2032)
- Burkina Faso Portable Hand-Thrown Extinguisher Market (2026-2032)
- Bulgaria Portable Hand-Thrown Extinguisher Market (2026-2032)
- Brunei Portable Hand-Thrown Extinguisher Market (2026-2032)
- Botswana Portable Hand-Thrown Extinguisher Market (2026-2032)
- Bosnia and Herzegovina Portable Hand-Thrown Extinguisher Market (2026-2032)
Industry Events and Analyst Meet

HIMTEX 2026

India Refining Summit 2026

India EV Show 2026

EV tech India Expo 2026

Auto Tech Asia 2026
Whitepaper
- Middle East & Africa Commercial Security Market Click here to view more.
- Middle East & Africa Fire Safety Systems & Equipment Market Click here to view more.
- GCC Drone Market Click here to view more.
- Middle East Lighting Fixture Market Click here to view more.
- GCC Physical & Perimeter Security Market Click here to view more.