Japan Bicycle Sharing Market Size & Growth Rate
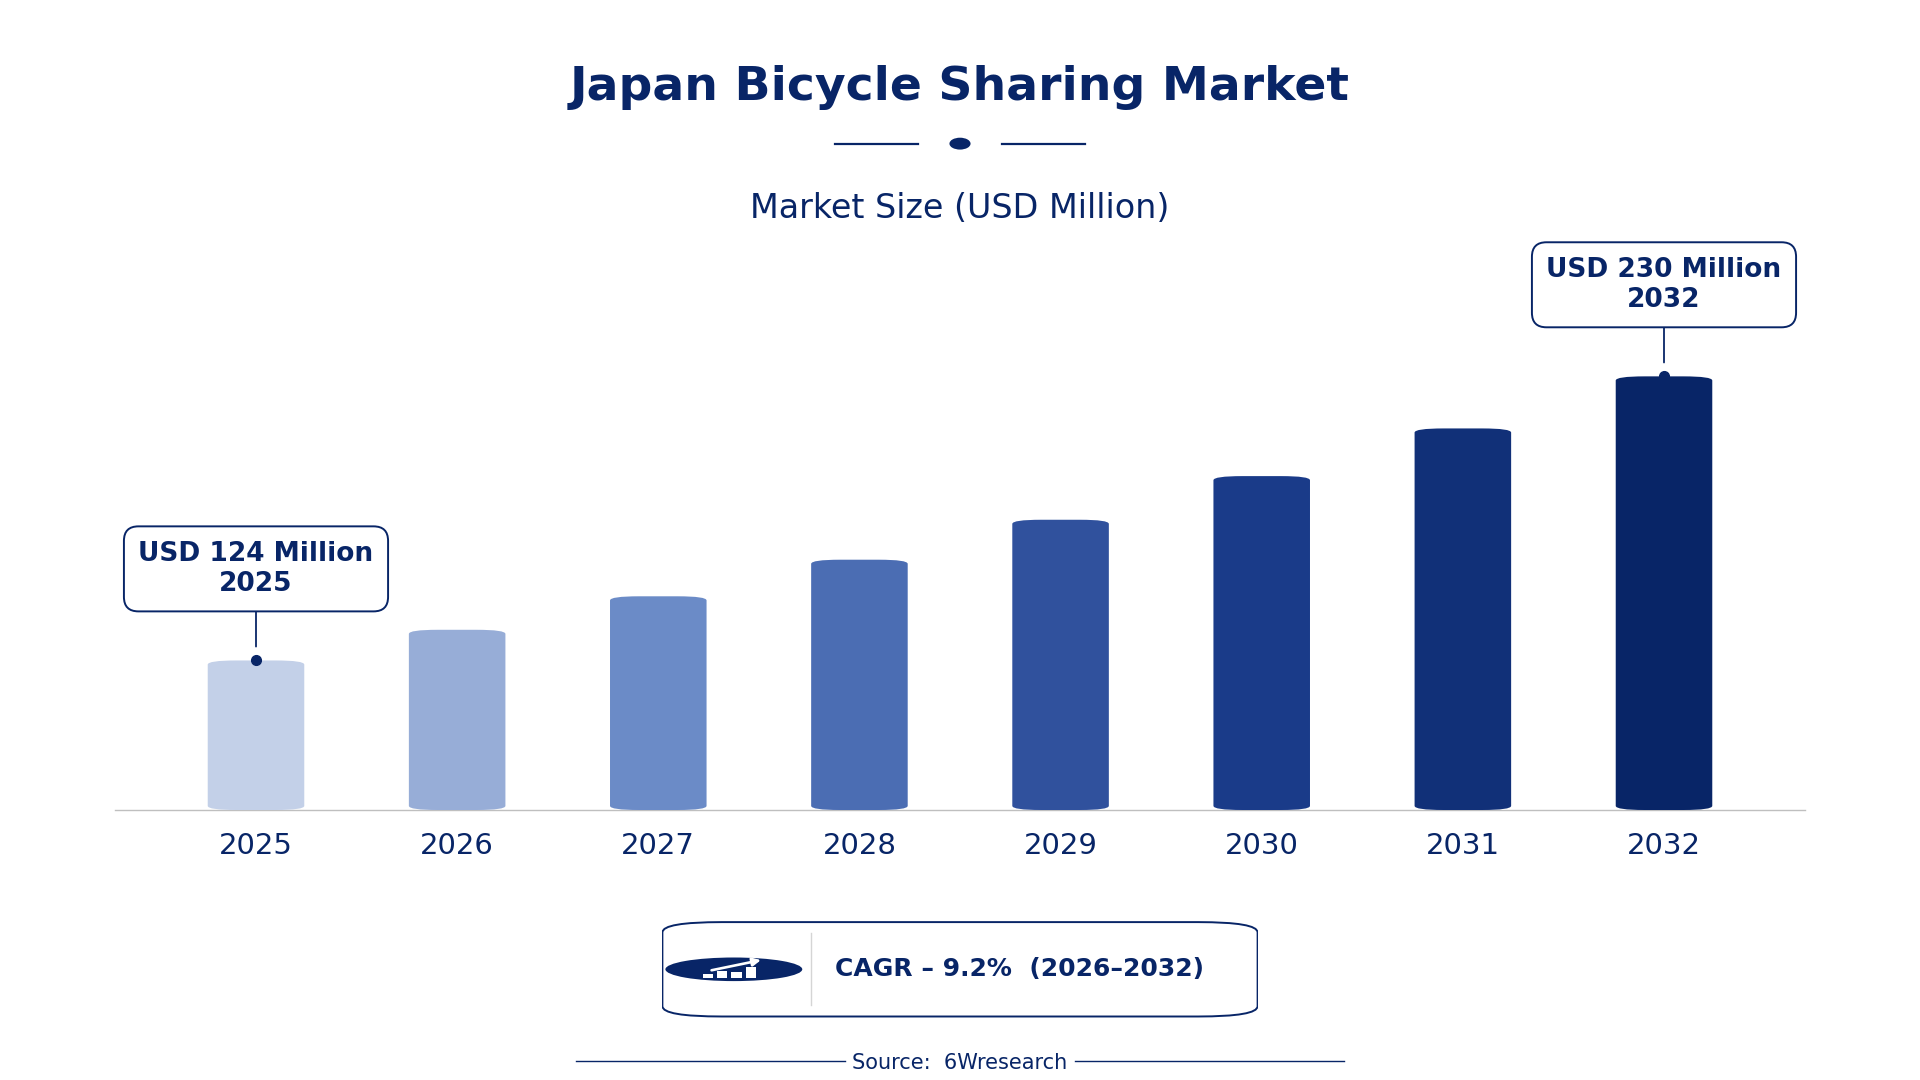
According to 6Wresearch internal database and industry insights, the Japan Bicycle Sharing Market was valued at USD 124 Million in 2025 and is projected to reach USD 230 Million by 2032, growing at a CAGR of approximately 9.2% during 2026–2032.
Japan Bicycle Sharing Market Highlights
| Report Metric | Details |
| Report Name | Japan Bicycle Sharing Market (2026-2032) |
| Market Size 2025 | USD 124 Million |
| Market Size 2032 | USD 230 Million |
| Absolute Growth 2025–2032 | USD 106 Million |
| CAGR 2026–2032 | 9.2% |
| Peak Annual Growth | 9.8% in 2032 |
| Forecast Period | 2026–2032 |
| Historical Data | 2022–2025 |
| Base Year | 2025 |
| Leading Bicycle Type, 2025 | Docked Bicycles (42% share) |
| Leading Functionality, 2025 | Urban Mobility (45% share) |
| Leading Application Area, 2025 | Public Transport (36% share) |
| Leading Distribution Channel, 2025 | Mobile Apps (40% share) |
| Leading End User, 2025 | Commuters (40% share) |
| Fastest-Growing Bicycle Type | Electric Bikes (13.1% CAGR) |
| Fastest-Growing Functionality | App-based Rental (11.7% CAGR) |
| Fastest-Growing Application Area | Smart Cities (11.1% CAGR) |
| Fastest-Growing End User | Residents (11.6% CAGR) |
| Growing Sector | Urban Mobility |
| Key End Users | Commuters, Tourists, Local Municipalities, Corporate Employees |
Japan Bicycle Sharing Market Year-wise Growth Rate and Key Drivers (2022–2032)
This graph illustrates the annual growth rates of the market from 2022 to 2032, highlighting a steady upward trajectory and projected market expansion over the forecast period.
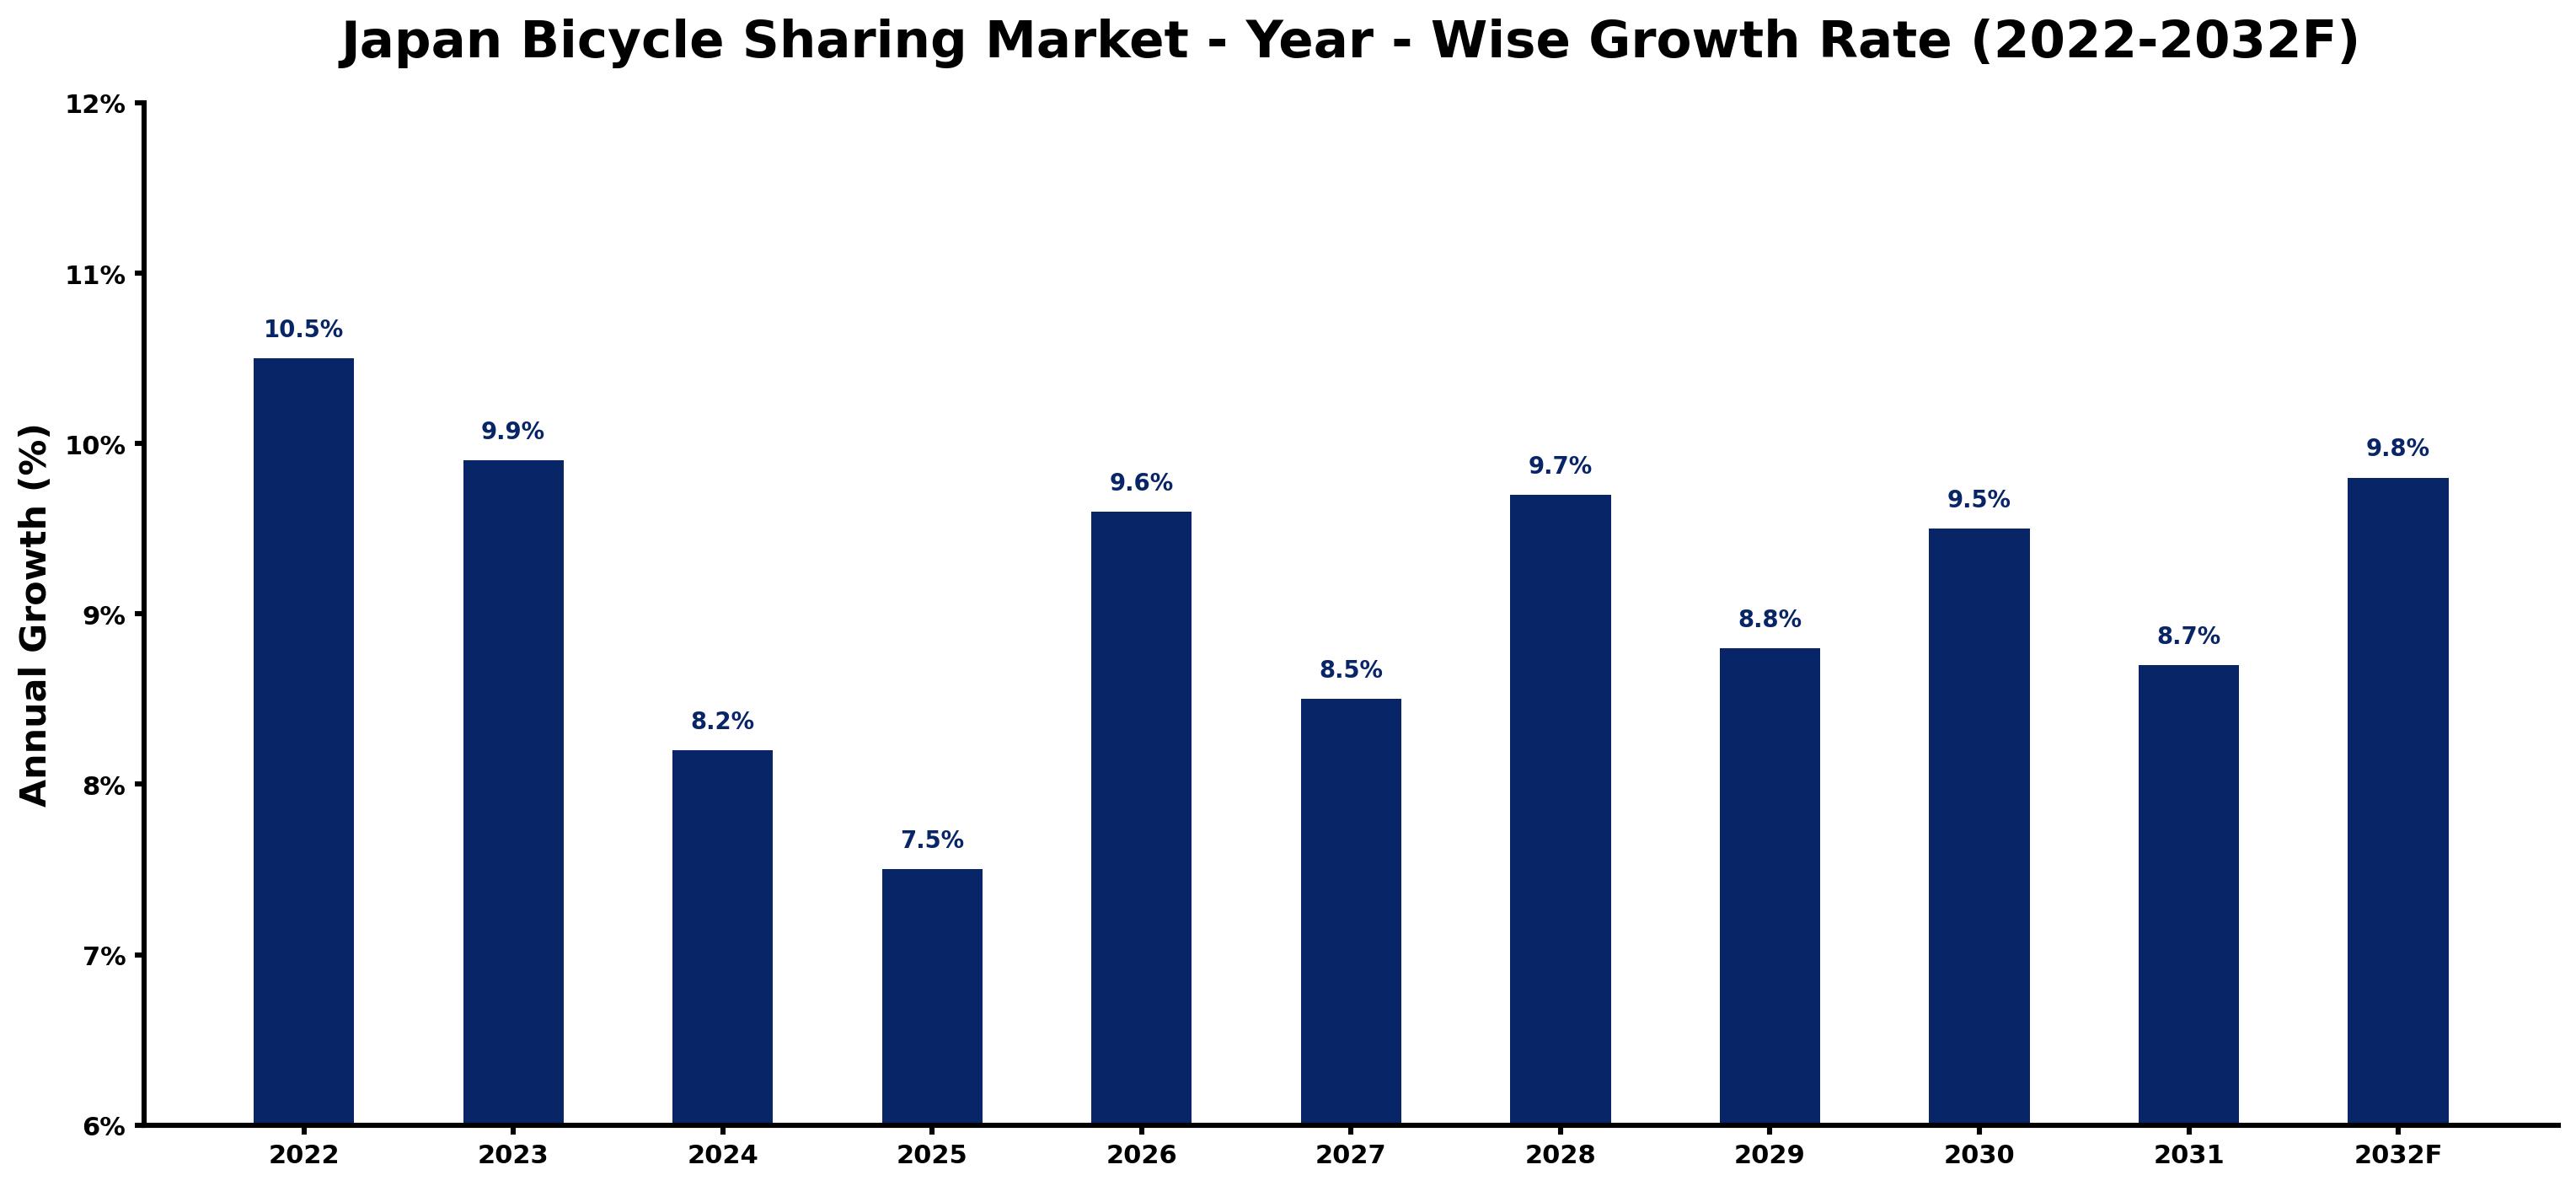
Below, each year's estimated growth is shown next to the factor that most influenced it.
| Year | Estimated Annual Growth (%) | Market Rationale |
| 2022 | 10.5 | The market experienced strong demand due to the Tokyo 2020 Olympics showcasing bike-sharing as a transport solution. |
| 2023 | 9.9 | Growth slowed as the market adjusted after the peak demand seen during the Olympics. |
| 2024 | 8.2 | Continued interest in eco-friendly transport options maintained market growth, albeit at a slower pace. |
| 2025 | 7.5 | The market stabilised as urban mobility initiatives began to mature, leading to consistent demand. |
| 2026 | 9.6 | Growth is expected to accelerate as urban areas invest more in bike-sharing infrastructure and technology. |
| 2027 | 8.5 | A slight slowdown is projected as the market reaches a saturation point in some urban regions. |
| 2028 | 9.7 | Renewed interest in smart city initiatives is expected to spur demand for bike-sharing systems once more. |
| 2029 | 8.8 | Growth is projected to slow again as competition increases among bike-sharing providers in major cities. |
| 2030 | 9.5 | A resurgence in demand is expected due to rising environmental awareness and urban congestion. |
| 2031 | 8.7 | The market growth rate is projected to moderate as infrastructure developments begin to plateau. |
| 2032 | 9.8 | Demand is expected to surge again as new smart mobility solutions are integrated into bike-sharing systems. |
Note: Market size estimations and growth projections presented in this report are based on 6Wresearch's proprietary forecasting methodology, utilizing the latest available industry data, government publications, and primary research inputs.
Japan Bicycle Sharing Market Synopsis
Bicycle sharing is a transportation system allowing users to rent bicycles for short periods, promoting urban mobility and reducing traffic congestion. The Japan Bicycle Sharing Market is thriving, with over 200,000 trips recorded in Yokohama in 2023. Growth is driven by high population density, local government support for cycling initiatives, and increased integration with public transport systems, making it an attractive option for commuters and tourists alike.
Market Dynamics Impact Analysis (2026–2032)
| Factor | Type | Impact | Primary Segment Affected |
| High population density in urban areas drives demand for convenient transport solutions. | Driver | High | Urban Mobility |
| Integration with public transport systems enhances accessibility and convenience for users. | Driver | High | Public Transport |
| Growing interest in eco-friendly transport options presents a significant market opportunity. | Opportunity | High | Smart Cities |
| Local municipalities are increasingly subsidising bike-sharing programs to promote cycling. | Opportunity | Medium | City Operators |
| Limited infrastructure in rural areas restricts the expansion of bike-sharing systems. | Restraint | High | Docked Bicycles |
| High competition among bike-sharing providers can lead to price wars, affecting profitability. | Restraint | Medium | Dockless Bicycles |
| Regulatory challenges related to safety standards can delay new bike-sharing implementations. | Challenge | High | Electric Bikes |
| Technological barriers in app development can hinder user experience and system efficiency. | Challenge | Medium | Mobile Apps |
Evaluation of Drivers in Japan Bicycle Sharing Market (2026–2032)
Demand rests on the following drivers, each shown with the segment it touches most.
| Drivers | Primary Segment Affected | Why It Matters (Evidence) |
| High population density encourages short-term rentals, increasing usage of bike-sharing systems. | Urban Mobility | Japan's urban areas, like Tokyo, have a population density that supports high bike-sharing usage. |
| Integration with public transport systems improves user convenience, driving higher adoption rates. | Public Transport | In Kyoto, bike-sharing systems are integrated with public transport, facilitating travel. |
| Local government initiatives promote cycling, leading to increased funding for bike-sharing programs. | City Operators | The Ministry of Land, Infrastructure, Transport and Tourism promotes cycling as a sustainable option. |
| Technological advancements in mobile apps streamline the rental process, attracting more users. | Mobile Apps | Local governments are partnering with tech firms to improve bike-sharing app functionalities. |
| Growing interest in electric bikes provides an alternative for users in hilly urban areas. | Electric Bikes | Electric bikes are gaining popularity in urban areas with steep terrain, improving accessibility. |
Behind the steady rise in orders sits a marked increase in urban population density, supporting high bike-sharing usage in cities like Tokyo, where over 500 bike-sharing stations are operational. In 2023, over 200,000 bike-sharing trips were recorded in Yokohama, reflecting strong demand. The integration of bike-sharing systems with public transport in cities like Kyoto improves user convenience, further driving adoption. Advancements in mobile applications streamline the rental process, making it easier for users to access services.
Evaluation of Restraints in Japan Bicycle Sharing Market
The following restraints limit how fast demand can grow.
| Market Restraint | Primary Segment Affected | Why It Matters (Evidence) |
| Limited infrastructure in rural areas restricts the expansion of bike-sharing systems, reducing potential user base. | Docked Bicycles | The lack of bike-sharing stations in less populated regions limits accessibility and convenience. |
| High competition among bike-sharing providers can lead to price wars, affecting profitability for operators. | Dockless Bicycles | In major cities, numerous providers compete for the same user base, driving prices down. |
| Regulatory challenges related to safety standards can delay new bike-sharing implementations, hindering growth. | Electric Bikes | Compliance with ISO 4210 standards for bicycle safety can slow down market entry for new products. |
| Technological barriers in app development can hinder user experience and system efficiency, limiting user adoption. | Mobile Apps | Issues with app functionality can deter users from engaging with bike-sharing services. |
| High initial investment costs for infrastructure can limit the entry of new operators into the market. | City Operators | The need for substantial funding to establish bike-sharing stations can deter potential entrants. |
Japan Bicycle Sharing Market Challenges
Osaka's bike-sharing program struggles with compliance to ISO 4210 standards, which delays service expansion for local municipalities and increases operational costs by 15%. Many bike-sharing apps lack user-friendly features, causing frustration among over 10,000 monthly users and reducing rental frequency. A shortage of skilled tech professionals hampers the development of advanced systems, resulting in slower innovation that affects suppliers' ability to meet market demands. Buyers encounter limited availability of bicycles, which can deter usage among commuters seeking efficient transport options in densely populated areas.
Trends in the Japan Bicycle Sharing Market
The shifts below are changing how Japan Bicycle Sharing Market products are bought and supplied.
- Shift towards Smart City Initiatives: Cities like Tokyo are increasingly adopting smart city strategies that integrate bike-sharing systems with urban planning. In 2023, bike-sharing initiatives were included in the Smart City Strategy, promoting sustainable transport solutions for residents.
- Transition from Docked to Dockless Systems: The rise of dockless bike-sharing systems is changing urban mobility. In major cities, users prefer the flexibility of dockless options, leading to a notable increase in rentals, with over 10,000 users monthly in Osaka.
- Public Transport Integration Gaining Importance: Public transport systems are increasingly incorporating bike-sharing options to improve last-mile connectivity. In Kyoto, bike-sharing is integrated with public transport, supporting travel for commuters and tourists alike.
- Corporate Programs Expanding in Urban Areas: Corporate bike-sharing programs are becoming more prevalent in Tokyo's business districts, with companies adopting these solutions for employee transport. Local municipalities are subsidising bike-sharing programs to promote cycling.
Investment Opportunities in the Japan Bicycle Sharing Market
Where to invest in the Japan Bicycle Sharing Market: the main openings are set out below.
- Growing Demand for Eco-Friendly Transport Solutions: With rising environmental awareness, there is an opportunity to invest in bike-sharing infrastructure. Local municipalities are looking to improve urban mobility solutions, with subsidies available for new programs.
- Investment in Electric Bikes: The increasing popularity of electric bikes presents an opportunity to supply innovative solutions. Urban areas with steep terrain are seeking electric options to cater to commuter needs, improving accessibility.
- Expansion of Mobile App Solutions: There is a gap in user-friendly mobile applications for bike-sharing services. Tech firms can partner with local governments to develop efficient apps, improving user experience and engagement.
- Corporate Partnerships for Employee Programs: With corporate bike-sharing programs on the rise, companies are seeking reliable solutions for employee transport. Collaborating with local municipalities can facilitate entry into this growing market.
Government Initiatives in the Japan Bicycle Sharing Market
The Electrical Appliance and Material Safety Act regulates the safety of bicycles and related equipment, ensuring all products meet stringent safety standards. Compliance with these regulations impacts market entry and consumer trust in bike-sharing systems, benefiting both producers and users.
Funding for bike-sharing initiatives is allocated by the Digital Agency, established in September 2021, which leads the government's digital transformation efforts. This initiative aims to improve user experience and accessibility, with investments directed towards technology upgrades and integration with existing transport systems.
Future Insight of the Japan Bicycle Sharing Market
Corporate bike-sharing programs in Tokyo will expand by 2032, driven by increased demand from businesses for sustainable transport solutions. Local municipalities will strengthen partnerships with tech firms to develop more integrated apps, improving user experience and accessibility. In 2023, over 200,000 bike-sharing trips were recorded in Yokohama, indicating a growing trend. Enhanced cycling infrastructure will make cycling a viable option for a broader demographic, promoting urban mobility.
Market Segmentation Analysis
Japan Bicycle Sharing Market report covers a detailed analysis of the following market segments:
By Bicycle Type – Docked Bicycles Lead, Electric Bikes Expected to Grow Fastest
According to Ayushi Shukla, Senior Research Analyst at 6Wresearch, the largest bicycle type category in 2025 was Docked Bicycles, at 42% of revenue. Docked bicycles dominate the market due to their established presence in urban infrastructure, particularly in cities like Tokyo with over 500 bike-sharing stations. Their reliability and integration into public transport systems make them a preferred choice for daily commuters and tourists alike. The quickest growth will come from Electric Bikes, forecast to expand at a CAGR of 13.1% between 2026 and 2032. Electric bikes are rapidly gaining traction as they offer an easier riding experience, especially in hilly urban areas, appealing to users seeking convenience. The increasing number of electric bike rentals in cities reflects this growing interest, indicating a shift towards more accessible options. Suppliers should focus on expanding electric bike offerings to meet the rising demand for user-friendly transportation solutions.
By Functionality – Urban Mobility Leads, App-based Rental Expected to Grow Fastest
With 45% of functionality revenue in 2025, Urban Mobility was the largest category. Urban mobility commands the largest share due to its essential role in Japan's transportation framework, especially in densely populated areas. For example, Tokyo's extensive network of over 500 bike-sharing stations caters effectively to the commuting needs of its residents. App-based Rental is set to record the highest CAGR in this split, 11.7% over 2026–2032. App-based rental is experiencing rapid growth as it provides users with a convenient way to locate and rent bicycles using their smartphones. The high smartphone penetration in Japan, exceeding 80%, is a key factor driving this trend. Suppliers should prioritise app development to enhance user engagement and streamline access to bike-sharing services.
By Application Area – Public Transport Leads, Smart Cities Expected to Grow Fastest
Public Transport accounted for 36% of the market by application area in 2025. Public transport leads the application area segment as bike-sharing systems are integrated with existing transport networks, facilitating smooth transitions for users. This integration is particularly notable in cities like Kyoto, where bike-sharing complements public transport options effectively. Smart Cities are projected to grow fastest, at a CAGR of 11.1% during 2026–2032. Smart cities represent the fastest-growing application area, reflecting urban development strategies that advocate for sustainable transport solutions. The 2023 Smart City Strategy highlights the importance of incorporating bike-sharing into urban planning initiatives. Suppliers should align their strategies with smart city frameworks to leverage growth opportunities in urban mobility.
By Distribution Channel – Mobile Apps Lead and Record the Fastest Growth
Mobile Apps held 40% of the Japan Bicycle Sharing Market by distribution channel in 2025. Mobile apps are the dominant distribution channel, serving as the primary method for users to access bike-sharing services with ease. The prevalence of smartphones in Japan has solidified mobile apps as the preferred choice for renting bicycles. Mobile Apps are also forecast to expand faster than any other category, at a CAGR of 12.0% over 2026–2032. Mobile apps also rank as the fastest-growing channel, as they continually adapt to improve user experience and simplify the rental process. The introduction of advanced functionalities within these apps is attracting an increasing number of users to bike-sharing services. Suppliers must focus on enhancing app capabilities to meet user demands and maintain a competitive edge in the market.
By End User – Commuters Lead, Residents Expected to Grow Fastest
In 2025, Commuters led the end user split with a 40% share. Commuters represent the largest end-user group, as they rely on bike-sharing for daily travel to work or school, particularly in urban areas with high population density. This demographic's consistent demand ensures a stable user base for bike-sharing services. The quickest growth will come from Residents, forecast to expand at a CAGR of 11.6% between 2026 and 2032. Residents are the fastest-growing end-user segment, benefiting from local bike-sharing services that cater to their daily needs. The increasing awareness of sustainable transport options among local populations is driving this growth. Suppliers should target local marketing strategies to engage residents and expand their user base.
Key Attractiveness of the Report
- 10 Years of Market Numbers
- Historical Data Starting from 2022 to 2025
- Base Year 2025
- Forecast Data until 2032
- Key Performance Indicators Impacting the Market
- Major Upcoming Developments and Projects
Key Highlights of the Report:
- Japan Bicycle Sharing Market Outlook
- Market Size of Japan Bicycle Sharing Market, 2025
- Forecast of Japan Bicycle Sharing Market, 2032
- Historical Data and Forecast of Japan Bicycle Sharing Market Revenues & Volume for the Period 2022-2032F
- Japan Bicycle Sharing Market Trend Evolution
- Japan Bicycle Sharing Market Drivers and Challenges
- Japan Bicycle Sharing Market Price Trends
- Japan Bicycle Sharing Market Porter's Five Forces
- Japan Bicycle Sharing Market Industry Life Cycle
- Historical Data and Forecast of Japan Bicycle Sharing Market Revenues & Volume By Bicycle Type for the Period 2022-2032F
- Historical Data and Forecast of Japan Bicycle Sharing Market Revenues & Volume By Docked Bicycles for the Period 2022-2032F
- Historical Data and Forecast of Japan Bicycle Sharing Market Revenues & Volume By Dockless Bicycles for the Period 2022-2032F
- Historical Data and Forecast of Japan Bicycle Sharing Market Revenues & Volume By Electric Bikes for the Period 2022-2032F
- Historical Data and Forecast of Japan Bicycle Sharing Market Revenues & Volume By Foldable Bikes for the Period 2022-2032F
- Historical Data and Forecast of Japan Bicycle Sharing Market Revenues & Volume By Functionality for the Period 2022-2032F
- Historical Data and Forecast of Japan Bicycle Sharing Market Revenues & Volume By Urban Mobility for the Period 2022-2032F
- Historical Data and Forecast of Japan Bicycle Sharing Market Revenues & Volume By App-based Rental for the Period 2022-2032F
- Historical Data and Forecast of Japan Bicycle Sharing Market Revenues & Volume By Assisted Pedaling for the Period 2022-2032F
- Historical Data and Forecast of Japan Bicycle Sharing Market Revenues & Volume By Portability for the Period 2022-2032F
- Historical Data and Forecast of Japan Bicycle Sharing Market Revenues & Volume By Application Area for the Period 2022-2032F
- Historical Data and Forecast of Japan Bicycle Sharing Market Revenues & Volume By Public Transport for the Period 2022-2032F
- Historical Data and Forecast of Japan Bicycle Sharing Market Revenues & Volume By Smart Cities for the Period 2022-2032F
- Historical Data and Forecast of Japan Bicycle Sharing Market Revenues & Volume By Last-mile Connectivity for the Period 2022-2032F
- Historical Data and Forecast of Japan Bicycle Sharing Market Revenues & Volume By Corporate Programs for the Period 2022-2032F
- Historical Data and Forecast of Japan Bicycle Sharing Market Revenues & Volume By Distribution Channel for the Period 2022-2032F
- Historical Data and Forecast of Japan Bicycle Sharing Market Revenues & Volume By SaaS for the Period 2022-2032F
- Historical Data and Forecast of Japan Bicycle Sharing Market Revenues & Volume By Mobile Apps for the Period 2022-2032F
- Historical Data and Forecast of Japan Bicycle Sharing Market Revenues & Volume By Direct Sales for the Period 2022-2032F
- Historical Data and Forecast of Japan Bicycle Sharing Market Revenues & Volume By Online Platforms for the Period 2022-2032F
- Historical Data and Forecast of Japan Bicycle Sharing Market Revenues & Volume By End User for the Period 2022-2032F
- Historical Data and Forecast of Japan Bicycle Sharing Market Revenues & Volume By City Operators for the Period 2022-2032F
- Historical Data and Forecast of Japan Bicycle Sharing Market Revenues & Volume By Commuters for the Period 2022-2032F
- Historical Data and Forecast of Japan Bicycle Sharing Market Revenues & Volume By Residents for the Period 2022-2032F
- Historical Data and Forecast of Japan Bicycle Sharing Market Revenues & Volume By Employees for the Period 2022-2032F
- Japan Bicycle Sharing Market Import Export Trade Statistics
- Market Opportunity Assessment By Bicycle Type
- Market Opportunity Assessment By Functionality
- Market Opportunity Assessment By Application Area
- Market Opportunity Assessment By Distribution Channel
- Market Opportunity Assessment By End User
- Japan Bicycle Sharing Market Top Companies Market Share
- Japan Bicycle Sharing Market Competitive Benchmarking By Technical and Operational Parameters
- Japan Bicycle Sharing Market Company Profiles
- Japan Bicycle Sharing Market Key Strategic Recommendations
Market Covered
Coverage by segment is as follows.
By Bicycle Type
- Docked Bicycles
- Dockless Bicycles
- Electric Bikes
- Foldable Bikes
By Functionality
- Urban Mobility
- App-based Rental
- Assisted Pedaling
- Portability
By Application Area
- Public Transport
- Smart Cities
- Last-mile Connectivity
- Corporate Programs
By Distribution Channel
- SaaS
- Mobile Apps
- Direct Sales
- Online Platforms
By End User
- City Operators
- Commuters
- Residents
- Employees