Japan Bismuth Iodide Market (2026-2032) | Outlook, Industry, Analysis, Trends, Growth, Revenue, Value, Share, Size, Companies & Forecast
Market Forecast By Product Type (99% Purity, 99.998% Purity, 99.999% Purity, Other), By Application (Electronics, Environment, Chemical Industry, Research, Other) And Competitive Landscape
| Product Code: ETC207094 | Publication Date: May 2022 | Updated Date: May 2026 | Product Type: Market Research Report | |
| Publisher: 6Wresearch | Author: Ravi Bhandari | No. of Pages: 70 | No. of Figures: 35 | No. of Tables: 5 |
Japan Bismuth Iodide Market Growth Rate
According to 6Wresearch internal database and industry insights, the Japan Bismuth Iodide Market is growing at a compound annual growth rate (CAGR) of 5.5% during the forecast period (2026-2032).
Japan Bismuth Iodide Market Year-wise Growth Rate and Key Drivers
This graph highlights how the Japan Bismuth Iodide Market has steadily grown over the past five years, supported by major growth factors.
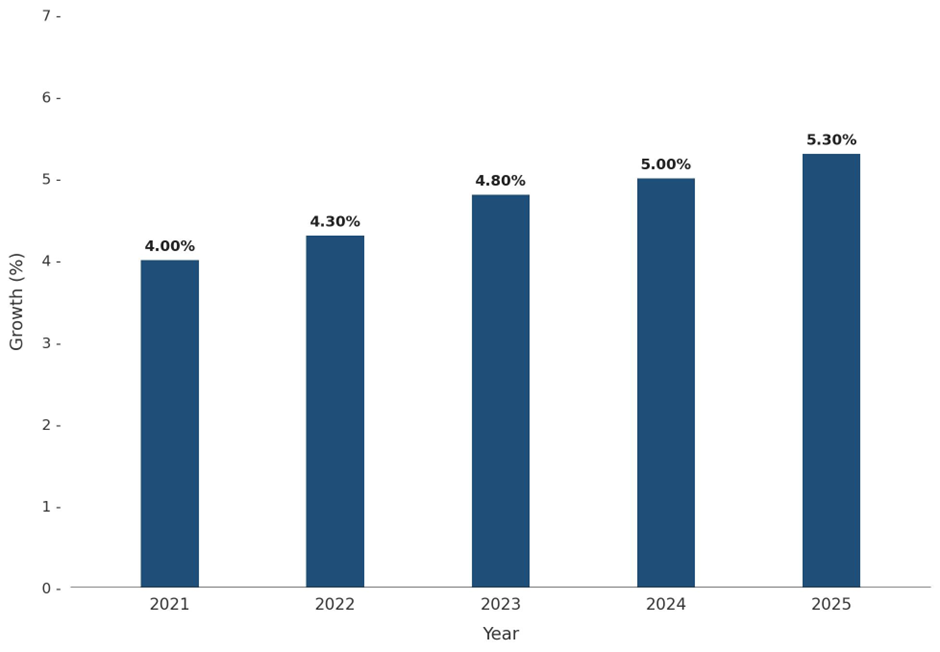
The table below presents the year‑wise growth rates along with the key drivers influencing the market
| Years | Est. Annual Growth in % | Growth Drivers |
| 2021 | 4% | Increasing demand in the electronics and chemical industries for high-purity bismuth iodide. |
| 2022 | 4.3% | Expanding adoption of bismuth iodide in research applications, particularly in the medical field. |
| 2023 | 4.8% | Development of electronics industry post advancements in bismuth iodide-based semiconductors. |
| 2024 | 5% | Increasing government initiatives to promote the use of eco-friendly materials in electronics. |
| 2025 | 5.3% | Expansion of bismuth iodide applications in environmental and chemical industries for clean technologies. |
Topics Covered in the Japan Bismuth Iodide Market Report
The Japan Bismuth Iodide Market report thoroughly covers the market by product types and applications. The market report provides an unbiased and detailed analysis of ongoing market trends, opportunities/high growth areas, and market drivers, which would help stakeholders devise and align their market strategies according to the current and future market dynamics.
Japan Bismuth Iodide Market Highlights
| Report Name | Japan Bismuth Iodide Market |
| Forecast period | 2026-2032 |
| CAGR | 5.5% |
| Growing Sector | Electronics |
Japan Bismuth Iodide Market Synopsis
The Japan Bismuth Iodide Market is poised for strong growth, led by the increase in demand for high-purity bismuth iodide in various sectors, which includes electronics, chemical industries, and research. Apart from that, advances in semiconductor technology and eco-friendly solutions gain momentum, bismuth iodide’s role is expanding. Government policies promoting the adoption of sustainable materials are further supporting this growth. Additionally, the material’s applications in medical and environmental sectors are expected to enhance market development over the forecast period.
Evaluation of Growth Drivers in the Japan Bismuth Iodide Market (2026-2032)
Below mentioned are some growth drivers and their impact on market dynamics:
| Drivers | Primary Segments Affected | Why It Matters |
| Government Support & Eco-friendly Policies | Electronics, Environment, Chemical Industry | Promotes the use of sustainable materials like bismuth iodide in industrial applications. |
| Growing Electronics Industry | Electronics | Drives demand for bismuth iodide as a key material in semiconductors and electronic components. |
| Demand for High-Purity Materials | 99% Purity, 99.998% Purity, 99.999% Purity | High-purity bismuth iodide is essential in advanced applications, especially in research and high-tech industries. |
| R&D Investment in New Applications | Electronics, Research, Chemical Industry | Increase in investment of R&D opens new opportunities for bismuth iodide across the industries. |
| Increasing Environmental Concerns | Environment, Chemical Industry | Bismuth iodide plays an important role in environmental applications, especially in clean technologies. |
The Japan Bismuth Iodide Market is projected to grow significantly, with a CAGR of 5.5% during the forecast period of 2026-2032. This growth is attributed to the increase in demand for high-purity bismuth iodide in electronics, research, and environmental applications. Along with that, the government policies aimed at promoting eco-friendly materials and the expansion of applications in semiconductors and clean technologies are driving the market. Additionally, the material’s versatility and sustainable nature are set to further fuel market’s expansion.
Evaluation of Restraints in the Japan Bismuth Iodide Market
Below mentioned are some major restraints and their influence on market dynamics:
| Restraints | Primary Segments Affected | What This Means |
| High Production Costs | 99.998% Purity, 99.999% Purity | Limits the widespread use of high-purity bismuth iodide in various applications. |
| Limited Availability of Raw Materials | All Segments | Affects supply consistency and raises material costs. |
| Regulatory Challenges in Application | Electronics, Chemical Industry | Increased regulation may slow the introduction of new applications and delay market access. |
| Lack of Awareness in Emerging Markets | Electronics, Chemical Industry | Delays market’s penetration in regions where bismuth iodide has less awareness or being used. |
| Competition from Alternative Materials | All Segments | Competing materials may limit the demand for bismuth iodide in certain applications. |
Japan Bismuth Iodide Market Challenges
The Japan Bismuth Iodide Market faces challenges such as high production costs, with limited availability of raw materials, and competition from alternative materials. These factors may restrict the global adoption of bismuth iodide, particularly in emerging markets. Apart from that, the strict regulatory frameworks for its use in electronics and chemicals may delay the development of new applications, although the ongoing advancements in sustainability and eco-friendly initiatives are predicted to mitigate these challenges.
Japan Bismuth Iodide Market Trends
Some major trends contributing to the Japan Bismuth Iodide Market Growth are:
- Advancements in Semiconductor Technology: Bismuth iodide is increasingly used in next-generation semiconductors, which enhances electronic component performance and also enables innovative in high-tech electronics and communication systems.
- Sustainability in Electronics Manufacturing: This growth in the eco-friendly materials like bismuth iodide in electronics is helping manufacturers align with global sustainability programs and reduce environment’s impact.
- Growth in R&D: Through the continued investments in R&D are uncovering new bismuth iodide applications, particularly in the medical devices and innovative industrial technologies.
Investment Opportunities in the Japan Bismuth Iodide Market
Below mentioned are some investment opportunities in the Japan Bismuth Iodide Industry:
- Eco-friendly Electronics Manufacturing: By investing in the development and adoption of bismuth iodide-based semiconductors can cater to the growing demand for sustainable electronics.
- Environmental Technologies: By capitalizing on the increasing demand for eco-friendly technologies, such as air and water purification, can create new market opportunities for bismuth iodide.
- Research Innovations: By supporting R&D for an advanced bismuth iodide application, which helps the medical field and new industrial processes, that offers substantial growth potential.
Top 5 Leading Players in the Japan Bismuth Iodide Market
Here are some top companies contributing to Japan Bismuth Iodide Market Share:
Merck KGaA (MilliporeSigma in Japan)
| Company Name | Merck KGaA (MilliporeSigma in Japan) |
| Established Year | 1668 |
| Headquarters | Tokyo, Japan |
| Official Website | Click Here |
Merck is a global specialty chemicals leader offering high purity bismuth iodide for research, electronics, and pharmaceutical applications.
Wako Pure Chemical Industries, Ltd.
| Company Name | Wako Pure Chemical Industries, Ltd. |
| Established Year | 1931 |
| Headquarters | Osaka, Japan |
| Official Website | Click Here |
Wako Pure produces high grade chemical reagents including bismuth iodide, serving research institutes and industrial clients. Wako supports advanced applications in electronics and life sciences.
Kanto Chemical Co., Inc.
| Company Name | Kanto Chemical Co., Inc. |
| Established Year | 1946 |
| Headquarters | Tokyo, Japan |
| Official Website | Click Here |
Kanto Chemical manufactures bismuth iodide for use in electronics and environmental technologies, focusing on innovation and the development of eco-friendly solutions.
Tokyo Chemical Industry Co., Ltd.
| Company Name | Tokyo Chemical Industry Co., Ltd. |
| Established Year | 1946 |
| Headquarters | Tokyo, Japan |
| Official Website | Click Here |
Tokyo Chemical Industry produces a wide range of high-purity chemicals, including bismuth iodide, used in various research, environmental, and industrial applications.
Showa Denko Materials Co., Ltd.
| Company Name | Showa Denko Materials Co., Ltd. |
| Established Year | 1939 |
| Headquarters | Tokyo, Japan |
| Official Website | - |
Showa Denko is a major manufacturer of specialty chemicals, including bismuth iodide, for the electronics, chemical, and environmental industries. They emphasize sustainable development.
Government Regulations Introduced in the Japan Bismuth Iodide Market
According to Japanese government data, has launched regulations which play a crucial role in shaping the development of Japan Bismuth Iodide Market. Along with that, the Ministry of the Environment (MOE) has been surging the use of eco-friendly and sustainable materials, such as bismuth iodide, especially in industries like electronics and environmental remediation. Additionally, Japan’s Chemical Substances Control Law sets regulations to ensure the safe use of chemicals in manufacturing, encouraging companies to comply with high environmental and safety standards.
Future Insights of the Japan Bismuth Iodide Market
The outcome for the Japan Bismuth Iodide Market seems to be positive, with a steady growth expected over the next few years. The market will get benefit from technological innovations, especially in semiconductors and environmental technologies, which will lead to demand for bismuth iodide. Moreover, the government support for sustainable materials and ongoing research policies will continue to expand the material’s applications. As Japan moves toward greener technologies and solutions, bismuth iodide is expected to play a key role in these transitions.
Market Segmentation Analysis
The report offers a comprehensive study of the subsequent market segments and their leading categories.
99.999% Purity to Dominate the Market: By Product Type
According to Kanak Phartiyal, Senior Research Analyst at 6Wresearch, 99.999% Purity dominates the market due to its high performance and suitability for sensitive applications such as advanced electronics and research.
Electronics applications to Dominate the Market: By Application
Electronics applications lead the market as bismuth iodide is increasingly used in semiconductors and other electronic components requiring high-purity materials.
Key attractiveness of the report
- 10 Years Market Numbers.
- Historical Data Starting from 2022 to 2025.
- Base Year: 2025
- Forecast Data until 2032.
- Key Performance Indicators Impacting the Market.
- Major Upcoming Developments and Projects.
Key Highlights of the Report:
- Japan Bismuth Iodide Market Outlook
- Market Size of Japan Bismuth Iodide Market, 2025
- Forecast of Japan Bismuth Iodide Market, 2032
- Historical Data and Forecast of Japan Bismuth Iodide Revenues & Volume for the Period 2022 - 2032
- Japan Bismuth Iodide Market Trend Evolution
- Japan Bismuth Iodide Market Drivers and Challenges
- Japan Bismuth Iodide Price Trends
- Japan Bismuth Iodide Porter's Five Forces
- Japan Bismuth Iodide Industry Life Cycle
- Historical Data and Forecast of Japan Bismuth Iodide Market Revenues & Volume By Product Type for the Period 2022 - 2032
- Historical Data and Forecast of Japan Bismuth Iodide Market Revenues & Volume By 99% Purity for the Period 2022 - 2032
- Historical Data and Forecast of Japan Bismuth Iodide Market Revenues & Volume By 99.998% Purity for the Period 2022 - 2032
- Historical Data and Forecast of Japan Bismuth Iodide Market Revenues & Volume By 99.999% Purity for the Period 2022 - 2032
- Historical Data and Forecast of Japan Bismuth Iodide Market Revenues & Volume By Other for the Period 2022 - 2032
- Historical Data and Forecast of Japan Bismuth Iodide Market Revenues & Volume By Application for the Period 2022 - 2032
- Historical Data and Forecast of Japan Bismuth Iodide Market Revenues & Volume By Electronics for the Period 2022 - 2032
- Historical Data and Forecast of Japan Bismuth Iodide Market Revenues & Volume By Environment for the Period 2022 - 2032
- Historical Data and Forecast of Japan Bismuth Iodide Market Revenues & Volume By Chemical Industry for the Period 2022 - 2032
- Historical Data and Forecast of Japan Bismuth Iodide Market Revenues & Volume By Research for the Period 2022 - 2032
- Historical Data and Forecast of Japan Bismuth Iodide Market Revenues & Volume By Other for the Period 2022 - 2032
- Japan Bismuth Iodide Import Export Trade Statistics
- Market Opportunity Assessment By Product Type
- Market Opportunity Assessment By Application
- Japan Bismuth Iodide Top Companies Market Share
- Japan Bismuth Iodide Competitive Benchmarking By Technical and Operational Parameters
- Japan Bismuth Iodide Company Profiles
- Japan Bismuth Iodide Key Strategic Recommendations
Market covered
The report subsequently covers the market by the following segments and subsegments.
By Product Type
- 99% Purity
- 99.998% Purity
- 99.999% Purity
- Other
By Application
- Electronics
- Environment
- Chemical Industry
- Research
- Other
Japan Bismuth Iodide Market (2026-2032) : FAQs
The Japan Bismuth Iodide Market is projected to grow at a CAGR of 5.5% during the forecast period (2026-2032).
The technological advancements in semiconductor technology and environmental applications are driving the use of high-purity bismuth iodide in electronics and clean technologies.
The key growth drivers include the growing demand in electronics, research, and environmental sectors, supported by government policies promoting sustainable materials.
The key challenges include high production costs, limited raw material availability, and regulatory hurdles that may slow market adoption in certain applications.
6Wresearch actively monitors the Japan Bismuth Iodide Market and publishes its comprehensive annual report, highlighting emerging trends, growth drivers, revenue analysis, and forecast outlook. Our insights help businesses to make data-backed strategic decisions with ongoing market dynamics. Our analysts track relevent industries related to the Japan Bismuth Iodide Market, allowing our clients with actionable intelligence and reliable forecasts tailored to emerging regional needs.
Yes, we provide customisation as per your requirements. To learn more, feel free to contact us on sales@6wresearch.com
| 1 Executive Summary |
| 2 Introduction |
| 2.1 Key Highlights of the Report |
| 2.2 Report Description |
| 2.3 Market Scope & Segmentation |
| 2.4 Research Methodology |
| 2.5 Assumptions |
| 3 Japan Bismuth Iodide Market Overview |
| 3.1 Japan Country Macro Economic Indicators |
| 3.2 Japan Bismuth Iodide Market Revenues & Volume, 2022 & 2032F |
| 3.3 Japan Bismuth Iodide Market - Industry Life Cycle |
| 3.4 Japan Bismuth Iodide Market - Porter's Five Forces |
| 3.5 Japan Bismuth Iodide Market Revenues & Volume Share, By Product Type, 2022 & 2032F |
| 3.6 Japan Bismuth Iodide Market Revenues & Volume Share, By Application, 2022 & 2032F |
| 4 Japan Bismuth Iodide Market Dynamics |
| 4.1 Impact Analysis |
| 4.2 Market Drivers |
| 4.2.1 Increasing demand for bismuth iodide in the pharmaceutical industry for applications such as contrast agents and radiopharmaceuticals. |
| 4.2.2 Growing awareness about the benefits of bismuth iodide in the electronics sector for use in semiconductors and photodetectors. |
| 4.2.3 Rising investments in research and development activities related to bismuth iodide for new applications and technologies. |
| 4.3 Market Restraints |
| 4.3.1 High production costs and limited availability of raw materials for manufacturing bismuth iodide. |
| 4.3.2 Stringent regulations and compliance requirements related to the use of bismuth iodide in certain industries. |
| 5 Japan Bismuth Iodide Market Trends |
| 6 Japan Bismuth Iodide Market, By Types |
| 6.1 Japan Bismuth Iodide Market, By Product Type |
| 6.1.1 Overview and Analysis |
| 6.1.2 Japan Bismuth Iodide Market Revenues & Volume, By Product Type, 2022 - 2032F |
| 6.1.3 Japan Bismuth Iodide Market Revenues & Volume, By 99% Purity, 2022 - 2032F |
| 6.1.4 Japan Bismuth Iodide Market Revenues & Volume, By 99.998% Purity, 2022 - 2032F |
| 6.1.5 Japan Bismuth Iodide Market Revenues & Volume, By 99.999% Purity, 2022 - 2032F |
| 6.1.6 Japan Bismuth Iodide Market Revenues & Volume, By Other, 2022 - 2032F |
| 6.2 Japan Bismuth Iodide Market, By Application |
| 6.2.1 Overview and Analysis |
| 6.2.2 Japan Bismuth Iodide Market Revenues & Volume, By Electronics, 2022 - 2032F |
| 6.2.3 Japan Bismuth Iodide Market Revenues & Volume, By Environment, 2022 - 2032F |
| 6.2.4 Japan Bismuth Iodide Market Revenues & Volume, By Chemical Industry, 2022 - 2032F |
| 6.2.5 Japan Bismuth Iodide Market Revenues & Volume, By Research, 2022 - 2032F |
| 6.2.6 Japan Bismuth Iodide Market Revenues & Volume, By Other, 2022 - 2032F |
| 7 Japan Bismuth Iodide Market Import-Export Trade Statistics |
| 7.1 Japan Bismuth Iodide Market Export to Major Countries |
| 7.2 Japan Bismuth Iodide Market Imports from Major Countries |
| 8 Japan Bismuth Iodide Market Key Performance Indicators |
| 8.1 Research and development expenditure in the bismuth iodide sector. |
| 8.2 Number of patents filed for bismuth iodide-based technologies. |
| 8.3 Adoption rate of bismuth iodide in new applications and industries. |
| 8.4 Investment in infrastructure for bismuth iodide production and supply chain optimization. |
| 8.5 Environmental impact assessments and sustainability practices in bismuth iodide manufacturing processes. |
| 9 Japan Bismuth Iodide Market - Opportunity Assessment |
| 9.1 Japan Bismuth Iodide Market Opportunity Assessment, By Product Type, 2022 & 2032F |
| 9.2 Japan Bismuth Iodide Market Opportunity Assessment, By Application, 2022 & 2032F |
| 10 Japan Bismuth Iodide Market - Competitive Landscape |
| 10.1 Japan Bismuth Iodide Market Revenue Share, By Companies, 2025 |
| 10.2 Japan Bismuth Iodide Market Competitive Benchmarking, By Operating and Technical Parameters |
| 11 Company Profiles |
| 12 Recommendations |
| 13 Disclaimer |
Global Go To Market Strategy - 2030
Export potential enables firms to identify high-growth global markets with greater confidence by combining advanced trade intelligence with a structured quantitative methodology. The framework analyzes emerging demand trends and country-level import patterns while integrating macroeconomic and trade datasets such as GDP and population forecasts, bilateral import–export flows, tariff structures, elasticity differentials between developed and developing economies, geographic distance, and import demand projections. Using weighted trade values from 2020–2024 as the base period to project country-to-country export potential for 2030, these inputs are operationalized through calculated drivers such as gravity model parameters, tariff impact factors, and projected GDP per-capita growth. Through an analysis of hidden potentials, demand hotspots, and market conditions that are most favorable to success, this method enables firms to focus on target countries, maximize returns, and global expansion with data, backed by accuracy.
By factoring in the projected importer demand gap that is currently unmet and could be potential opportunity, it identifies the potential for the Exporter (Country) among 190 countries, against the general trade analysis, which identifies the biggest importer or exporter.
To discover high-growth global markets and optimize your business strategy:
Click Here
Pricing
- Single User License$ 1,995
- Department License$ 2,400
- Site License$ 3,120
- Global License$ 3,795

Leadership Perspectives from Industry Events
Search
Thought Leadership and Analyst Meet


Our Clients
6WResearch In News
- India Air Conditioner Market Set for Strong Rebound in 2026 After Weather-Led Correction and GST-Driven Recovery: 6Wresearch
- ADAS in India: How Automatic Emergency Braking, Blind Spot Detection & Driver Monitoring are Transforming Road Safety
- Doha a strategic location for EV manufacturing hub: IPA Qatar
- Demand for luxury TVs surging in the GCC, says Samsung
- Empowering Growth: The Thriving Journey of Bangladesh’s Cable Industry
- Demand for luxury TVs surging in the GCC, says Samsung
Latest Reports
- Poland Fire Protection Systems Market (2026-2032)
- Cape Verde Portable Hand-Thrown Extinguisher Market (2026-2032)
- Canada Portable Hand-Thrown Extinguisher Market (2026-2032)
- Cameroon Portable Hand-Thrown Extinguisher Market (2026-2032)
- Burundi Portable Hand-Thrown Extinguisher Market (2026-2032)
- Burkina Faso Portable Hand-Thrown Extinguisher Market (2026-2032)
- Bulgaria Portable Hand-Thrown Extinguisher Market (2026-2032)
- Brunei Portable Hand-Thrown Extinguisher Market (2026-2032)
- Botswana Portable Hand-Thrown Extinguisher Market (2026-2032)
- Bosnia and Herzegovina Portable Hand-Thrown Extinguisher Market (2026-2032)
Industry Events and Analyst Meet

HIMTEX 2026

India Refining Summit 2026

India EV Show 2026

EV tech India Expo 2026

Auto Tech Asia 2026
Whitepaper
- Middle East & Africa Commercial Security Market Click here to view more.
- Middle East & Africa Fire Safety Systems & Equipment Market Click here to view more.
- GCC Drone Market Click here to view more.
- Middle East Lighting Fixture Market Click here to view more.
- GCC Physical & Perimeter Security Market Click here to view more.