Japan Cast & Forged Market (2026-2032) | Size, Industry, Companies, COVID-19 IMPACT, Analysis, Outlook, Share, Value, Growth, Trends, Revenue & Forecast
Market Forecast By Product Types (Light Alloys, Copper Alloys, Iron Casting, Steel Casting, Miscellaneous), By Activity Types (Closed Die Forging, Open Die Forging, Rolled Ring Forging, Cold Forging, Non-ferrous Closed Die Forging), By Applications (Automotive, Aerospace, Oil & Gas, Construction, Agriculture, Industrial, Others) And Competitive Landscape
| Product Code: ETC004191 | Publication Date: Sep 2020 | Updated Date: Jun 2026 | Product Type: Report | |
| Publisher: 6Wresearch | Author: Ravi Bhandari | No. of Pages: 70 | No. of Figures: 35 | No. of Tables: 5 |
Japan Cast & Forged Market Summary
The japan cast & forged market was estimated at USD 138 Million in 2025 and is projected to reach USD 147 Million by 2032, growing at a CAGR of 2.2% from 2026 to 2032.
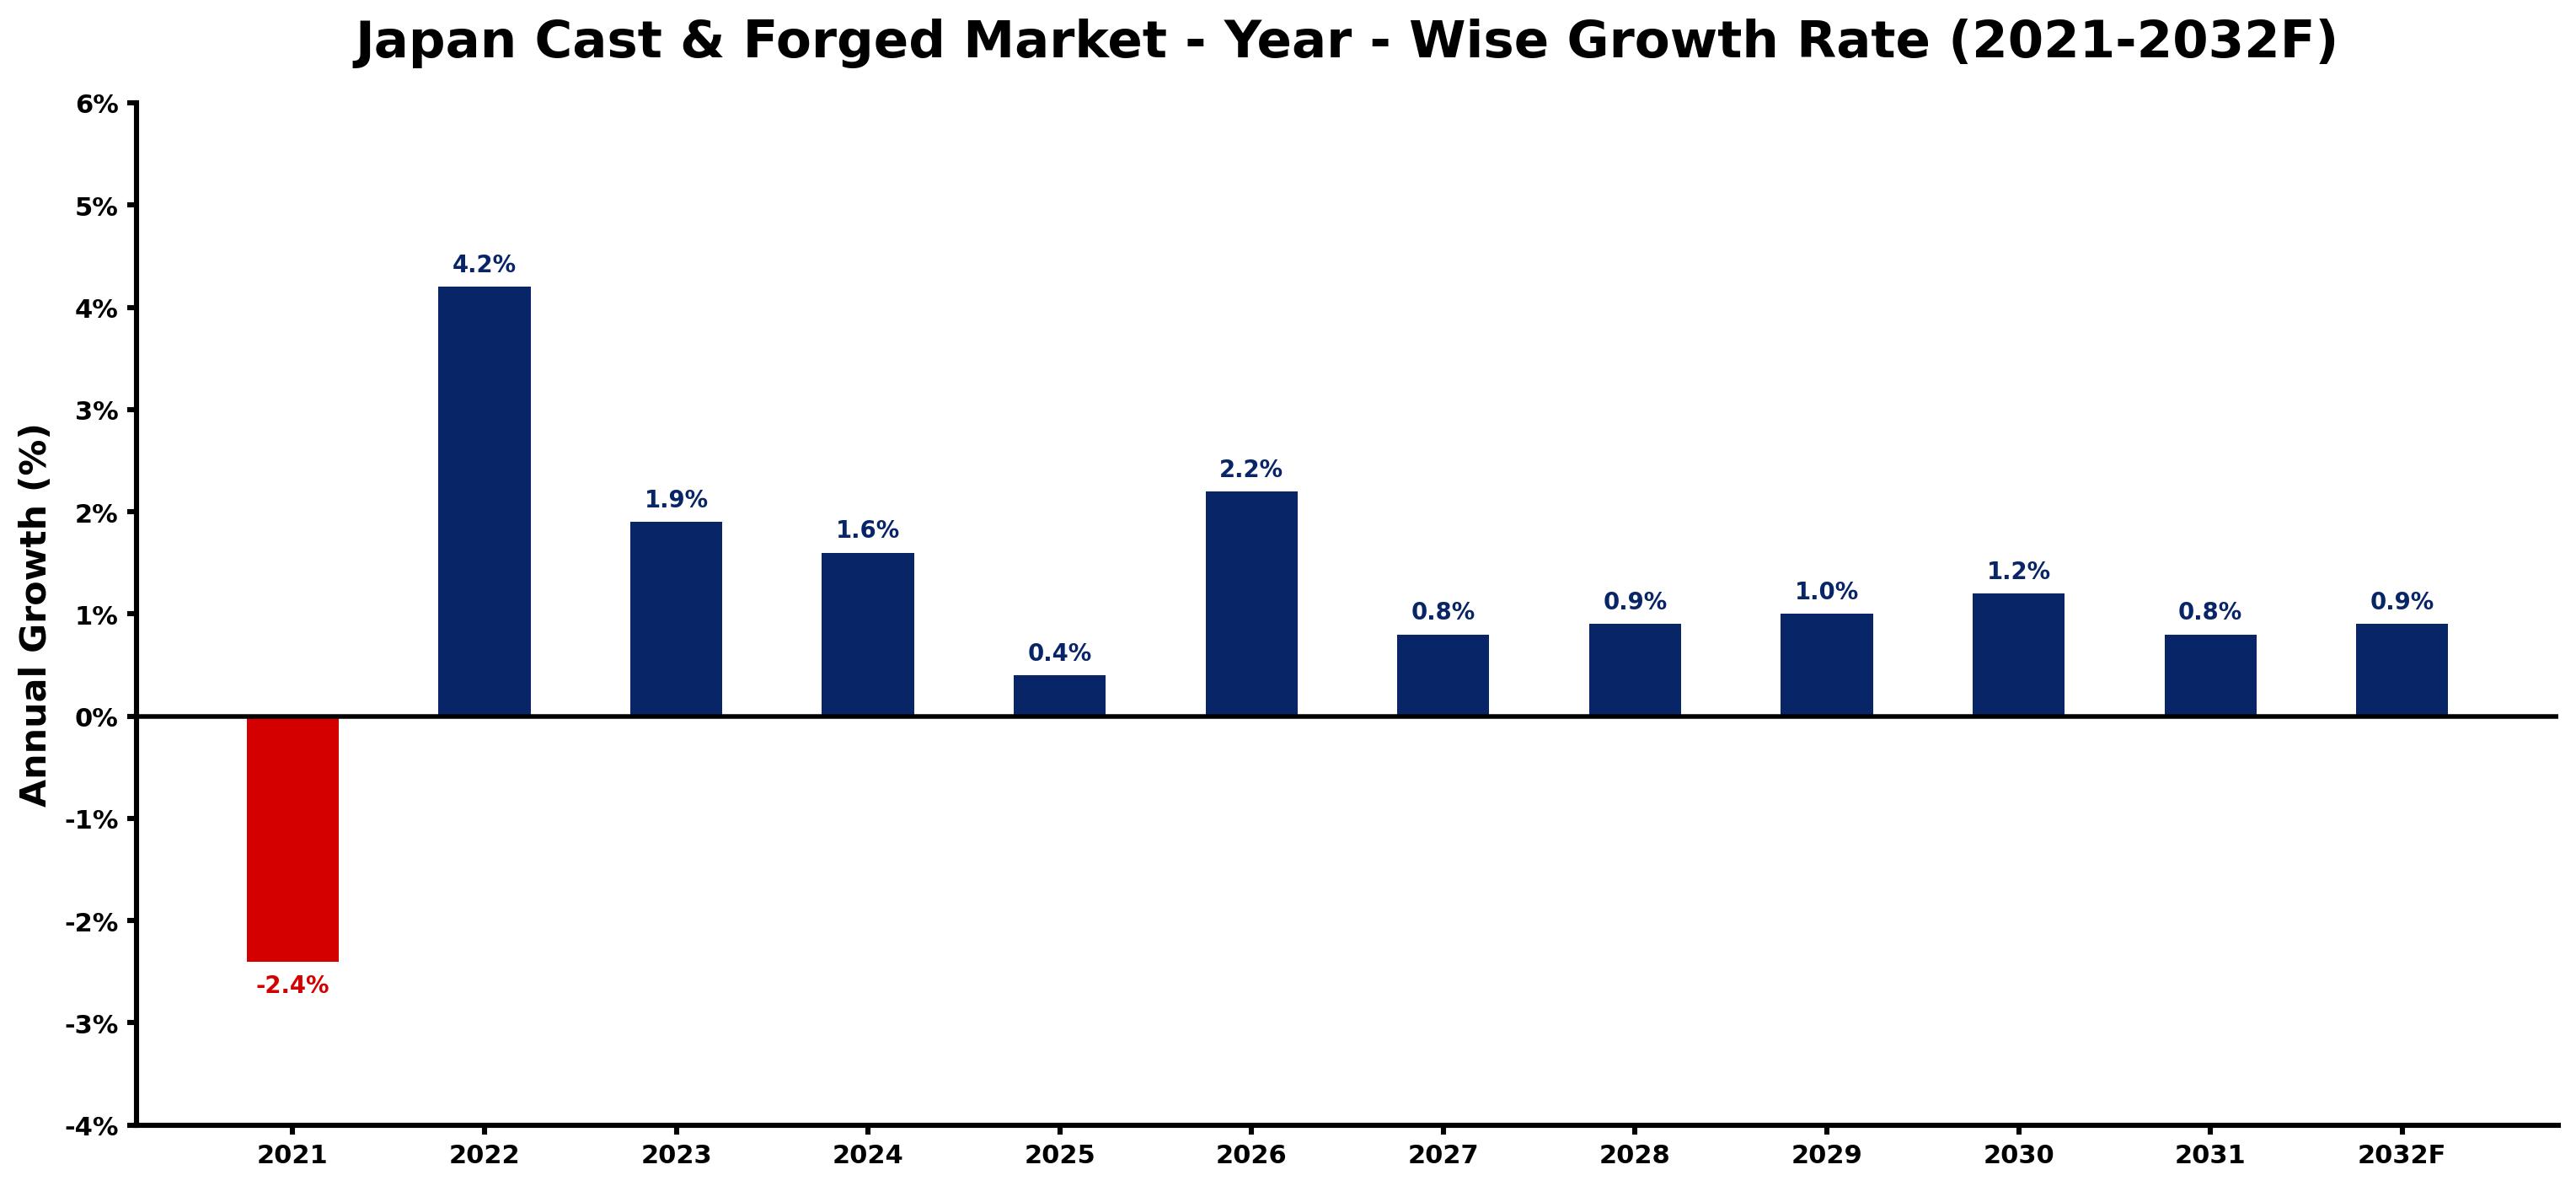
Japan Cast & Forged Market Growth Rate Analysis (2021-2032)
The Japanese cast and forged market witnessed a rebound in 2022, growing by 4.2% after a decline of 2.4% in 2021. This upturn can be attributed to increased investments in infrastructure and a resurgence in manufacturing, which surged consumer demand. Growth stabilized in 2023 at 1.9%, reflecting adaptability to the shifting energy transition and technological advancements. However, projections indicate a gradual slowdown, with expected growth rates of 1.6% in 2024, tapering to 0.4% by 2025, as market saturation and global economic uncertainties take hold. Despite these fluctuations, the sector remains resilient, bolstered by ongoing innovations and supportive government policies aimed at enhancing industrial productivity.
Japan Cast & Forged Market Year-wise Growth Rate and Key Drivers
This graph highlights how the Japan Cast & Forged Market has steadily grown over the past five years, supported by major growth factors.
The table below presents the year wise growth rates along with the key drivers influencing the market
| Year | Growth Rate | Major Drivers |
| 2021 | -2.4% | Supply chain disruptions caused by the pandemic significantly hampered production capabilities in the casting and forging industry. |
| 2022 | 4.2% | Increased infrastructure investments enhance demand for high-quality cast products across sectors. |
| 2023 | 1.9% | Technological upgrades in casting methods improve quality, attracting more industrial clients. |
| 2024 | 1.6% | Local manufacturers focus on sustainability, integrating eco-friendly processes into production. |
| 2025 | 0.4% | Rising automotive sector requirements stimulate innovation in lightweight forged materials. |
| 2026 | 2.2% | Industrial robotics implementation leads to higher efficiency in casting operations nationwide. |
| 2027 | 0.8% | Export opportunities expand as Japan's forged goods gain traction in Asian markets. |
| 2028 | 0.9% | Smart manufacturing initiatives promote digitization and data analytics in casting facilities. |
| 2029 | 1.0% | Aging infrastructure demands urgent upgrades, boosting orders for cast and forged solutions. |
| 2030 | 1.2% | Regional collaborations enhance research and development for technologically advanced materials. |
| 2031 | 0.8% | Emerging green technologies redefine traditional casting methods, attracting environmentally focused investments. |
| 2032 | 0.9% | Workforce development initiatives create a skilled labor pool for complex forging operations. |
Note - Market size estimations and growth projections presented in this report are based on 6Wresearch's advanced forecasting approach, validated with industry datasets as of June 2026.
Key Highlights of the Report:
- Japan Cast & Forged Market Overview
- Japan Cast & Forged Market Outlook
- Market Size of Japan Cast & Forged Market, 2025
- Forecast of Japan Cast & Forged Market, 2032F
- Historical Data and Forecast of Japan Cast & Forged Revenues & Volume for the Period 2022-2032F
- Japan Cast & Forged Market Trend Evolution
- Japan Cast & Forged Market Drivers and Challenges
- Japan Cast & Forged Price Trends
- Japan Cast & Forged Porter's Five Forces
- Japan Cast & Forged Industry Life Cycle
- Historical Data and Forecast of Japan Cast & Forged Market Revenues & Volume By Product Types for the Period 2022-2032F
- Historical Data and Forecast of Japan Cast & Forged Market Revenues & Volume By Light Alloys for the Period 2022-2032F
- Historical Data and Forecast of Japan Cast & Forged Market Revenues & Volume By Copper Alloys for the Period 2022-2032F
- Historical Data and Forecast of Japan Cast & Forged Market Revenues & Volume By Iron Casting for the Period 2022-2032F
- Historical Data and Forecast of Japan Cast & Forged Market Revenues & Volume By Steel Casting for the Period 2022-2032F
- Historical Data and Forecast of Japan Cast & Forged Market Revenues & Volume By Miscellaneous for the Period 2022-2032F
- Historical Data and Forecast of Japan Cast & Forged Market Revenues & Volume By Activity Types for the Period 2022-2032F
- Historical Data and Forecast of Japan Cast & Forged Market Revenues & Volume By Closed Die Forging for the Period 2022-2032F
- Historical Data and Forecast of Japan Cast & Forged Market Revenues & Volume By Open Die Forging for the Period 2022-2032F
- Historical Data and Forecast of Japan Cast & Forged Market Revenues & Volume By Rolled Ring Forging for the Period 2022-2032F
- Historical Data and Forecast of Japan Cast & Forged Market Revenues & Volume By Cold Forging for the Period 2022-2032F
- Historical Data and Forecast of Japan Cast & Forged Market Revenues & Volume By Non-ferrous Closed Die Forging for the Period 2022-2032F
- Historical Data and Forecast of Japan Cast & Forged Market Revenues & Volume By Applications for the Period 2022-2032F
- Historical Data and Forecast of Japan Cast & Forged Market Revenues & Volume By Automotive for the Period 2022-2032F
- Historical Data and Forecast of Japan Cast & Forged Market Revenues & Volume By Aerospace for the Period 2022-2032F
- Historical Data and Forecast of Japan Cast & Forged Market Revenues & Volume By Oil & Gas for the Period 2022-2032F
- Historical Data and Forecast of Japan Cast & Forged Market Revenues & Volume By Construction for the Period 2022-2032F
- Historical Data and Forecast of Japan Cast & Forged Market Revenues & Volume By Agriculture for the Period 2022-2032F
- Historical Data and Forecast of Japan Cast & Forged Market Revenues & Volume By Industrial for the Period 2022-2032F
- Historical Data and Forecast of Japan Cast & Forged Market Revenues & Volume By Others for the Period 2022-2032F
- Japan Cast & Forged Import Export Trade Statistics
- Market Opportunity Assessment By Product Types
- Market Opportunity Assessment By Activity Types
- Market Opportunity Assessment By Applications
- Japan Cast & Forged Top Companies Market Share
- Japan Cast & Forged Competitive Benchmarking By Technical and Operational Parameters
- Japan Cast & Forged Company Profiles
- Japan Cast & Forged Key Strategic Recommendations
Frequently Asked Questions About the Market Study (FAQs):
6Wresearch actively monitors the Japan Cast & Forged Market and publishes its comprehensive annual report, highlighting emerging trends, growth drivers, revenue analysis, and forecast outlook. Our insights help businesses to make data-backed strategic decisions with ongoing market dynamics. Our analysts track relevent industries related to the Japan Cast & Forged Market, allowing our clients with actionable intelligence and reliable forecasts tailored to emerging regional needs.
Yes, we provide customisation as per your requirements. To learn more, feel free to contact us on sales@6wresearch.com
| Table of Contents |
| 1. Executive Summary |
| 2. Introduction |
| 2.1. Key Highlights of the Report |
| 2.2. Report Description |
| 2.3. Market Scope & Segmentation |
| 2.4. Research Methodology |
| 2.5. Assumptions |
| 3. Japan Cast & Forged Market Overview |
| 3.1. Japan Country Macro Economic Indicators |
| 3.2. Japan Cast & Forged Market Revenues & Volume, 2022 & 2032F |
| 3.3. Japan Cast & Forged Market - Industry Life Cycle |
| 3.4. Japan Cast & Forged Market - Porter's Five Forces |
| 3.5. Japan Cast & Forged Market Revenues & Volume Share, By Product Types, 2022 & 2032F |
| 3.6. Japan Cast & Forged Market Revenues & Volume Share, By Activity Types, 2022 & 2032F |
| 3.7. Japan Cast & Forged Market Revenues & Volume Share, By Applications, 2022 & 2032F |
| 4. Japan Cast & Forged Market Dynamics |
| 4.1. Impact Analysis |
| 4.2. Market Drivers |
| 4.2.1 Increasing demand for lightweight and high-strength materials in automotive and aerospace industries |
| 4.2.2 Growing focus on precision engineering and quality control in manufacturing processes |
| 4.2.3 Technological advancements leading to improved efficiency and productivity in cast forged production |
| 4.3. Market Restraints |
| 4.3.1 Fluctuating raw material prices impacting production costs |
| 4.3.2 Intense competition from substitute materials like composites and plastics |
| 4.3.3 Stringent environmental regulations affecting the manufacturing processes |
| 5. Japan Cast & Forged Market Trends |
| 6. Japan Cast & Forged Market, By Types |
| 6.1. Japan Cast & Forged Market, By Product Types |
| 6.1.1 Overview and Analysis |
| 6.1.2. Japan Cast & Forged Market Revenues & Volume, By Product Types, 2022-2032F |
| 6.1.3. Japan Cast & Forged Market Revenues & Volume, By Light Alloys, 2022-2032F |
| 6.1.4. Japan Cast & Forged Market Revenues & Volume, By Copper Alloys, 2022-2032F |
| 6.1.5. Japan Cast & Forged Market Revenues & Volume, By Iron Casting, 2022-2032F |
| 6.1.6. Japan Cast & Forged Market Revenues & Volume, By Steel Casting, 2022-2032F |
| 6.1.7. Japan Cast & Forged Market Revenues & Volume, By Miscellaneous, 2022-2032F |
| 6.2. Japan Cast & Forged Market, By Activity Types |
| 6.2.1. Overview and Analysis |
| 6.2.2. Japan Cast & Forged Market Revenues & Volume, By Closed Die Forging, 2022-2032F |
| 6.2.3. Japan Cast & Forged Market Revenues & Volume, By Open Die Forging, 2022-2032F |
| 6.2.4. Japan Cast & Forged Market Revenues & Volume, By Rolled Ring Forging, 2022-2032F |
| 6.2.5. Japan Cast & Forged Market Revenues & Volume, By Cold Forging, 2022-2032F |
| 6.2.6. Japan Cast & Forged Market Revenues & Volume, By Non-ferrous Closed Die Forging, 2022-2032F |
| 6.3. Japan Cast & Forged Market, By Applications |
| 6.3.1. Overview and Analysis |
| 6.3.2. Japan Cast & Forged Market Revenues & Volume, By Automotive, 2022-2032F |
| 6.3.3 Japan Cast & Forged Market Revenues & Volume, By Aerospace, 2022-2032F |
| 6.3.4. Japan Cast & Forged Market Revenues & Volume, By Oil & Gas, 2022-2032F |
| 6.3.5. Japan Cast & Forged Market Revenues & Volume, By Construction, 2022-2032F |
| 6.3.6. Japan Cast & Forged Market Revenues & Volume, By Agriculture, 2022-2032F |
| 6.3.7. Japan Cast & Forged Market Revenues & Volume, By Industrial, 2022-2032F |
| 7. Japan Cast & Forged Market Import-Export Trade Statistics |
| 7.1. Japan Cast & Forged Market Export to Major Countries |
| 7.2. Japan Cast & Forged Market Imports from Major Countries |
| 8. Japan Cast & Forged Market Key Performance Indicators |
| 8.1 Percentage of scrap material generated in the production process |
| 8.2 Energy consumption per unit of output |
| 8.3 Number of new product innovations or process improvements implemented |
| 8.4 Rate of adoption of advanced manufacturing technologies |
| 8.5 Customer satisfaction scores related to product quality and delivery timelines. |
| 9. Japan Cast & Forged Market - Opportunity Assessment |
| 9.1. Japan Cast & Forged Market Opportunity Assessment, By Product Types, 2022 & 2032F |
| 9.2. Japan Cast & Forged Market Opportunity Assessment, By Activity Types, 2022 & 2032F |
| 9.3. Japan Cast & Forged Market Opportunity Assessment, By Applications, 2022 & 2032F |
| 10. Japan Cast & Forged Market - Competitive Landscape |
| 10.1. Japan Cast & Forged Market Revenue Share, By Companies, 2025 |
| 10.2. Japan Cast & Forged Market Competitive Benchmarking, By Operating and Technical Parameters |
| 11. Company Profiles |
| 12. Recommendations |
| 13. Disclaimer |
Global Go To Market Strategy - 2030
Export potential enables firms to identify high-growth global markets with greater confidence by combining advanced trade intelligence with a structured quantitative methodology. The framework analyzes emerging demand trends and country-level import patterns while integrating macroeconomic and trade datasets such as GDP and population forecasts, bilateral import–export flows, tariff structures, elasticity differentials between developed and developing economies, geographic distance, and import demand projections. Using weighted trade values from 2020–2024 as the base period to project country-to-country export potential for 2030, these inputs are operationalized through calculated drivers such as gravity model parameters, tariff impact factors, and projected GDP per-capita growth. Through an analysis of hidden potentials, demand hotspots, and market conditions that are most favorable to success, this method enables firms to focus on target countries, maximize returns, and global expansion with data, backed by accuracy.
By factoring in the projected importer demand gap that is currently unmet and could be potential opportunity, it identifies the potential for the Exporter (Country) among 190 countries, against the general trade analysis, which identifies the biggest importer or exporter.
To discover high-growth global markets and optimize your business strategy:
Click Here
Pricing
- Single User License$ 1,995
- Department License$ 2,400
- Site License$ 3,120
- Global License$ 3,795

Leadership Perspectives from Industry Events
Search
Thought Leadership and Analyst Meet


Our Clients
6WResearch In News
- India Air Conditioner Market Set for Strong Rebound in 2026 After Weather-Led Correction and GST-Driven Recovery: 6Wresearch
- ADAS in India: How Automatic Emergency Braking, Blind Spot Detection & Driver Monitoring are Transforming Road Safety
- Doha a strategic location for EV manufacturing hub: IPA Qatar
- Demand for luxury TVs surging in the GCC, says Samsung
- Empowering Growth: The Thriving Journey of Bangladesh’s Cable Industry
- Demand for luxury TVs surging in the GCC, says Samsung
Latest Reports
- Poland Fire Protection Systems Market (2026-2032)
- Cape Verde Portable Hand-Thrown Extinguisher Market (2026-2032)
- Canada Portable Hand-Thrown Extinguisher Market (2026-2032)
- Cameroon Portable Hand-Thrown Extinguisher Market (2026-2032)
- Burundi Portable Hand-Thrown Extinguisher Market (2026-2032)
- Burkina Faso Portable Hand-Thrown Extinguisher Market (2026-2032)
- Bulgaria Portable Hand-Thrown Extinguisher Market (2026-2032)
- Brunei Portable Hand-Thrown Extinguisher Market (2026-2032)
- Botswana Portable Hand-Thrown Extinguisher Market (2026-2032)
- Bosnia and Herzegovina Portable Hand-Thrown Extinguisher Market (2026-2032)
Industry Events and Analyst Meet

HIMTEX 2026

India Refining Summit 2026

India EV Show 2026

EV tech India Expo 2026

Auto Tech Asia 2026
Whitepaper
- Middle East & Africa Commercial Security Market Click here to view more.
- Middle East & Africa Fire Safety Systems & Equipment Market Click here to view more.
- GCC Drone Market Click here to view more.
- Middle East Lighting Fixture Market Click here to view more.
- GCC Physical & Perimeter Security Market Click here to view more.