Japan Custom Interactive Video Wall Market Size & Growth Rate
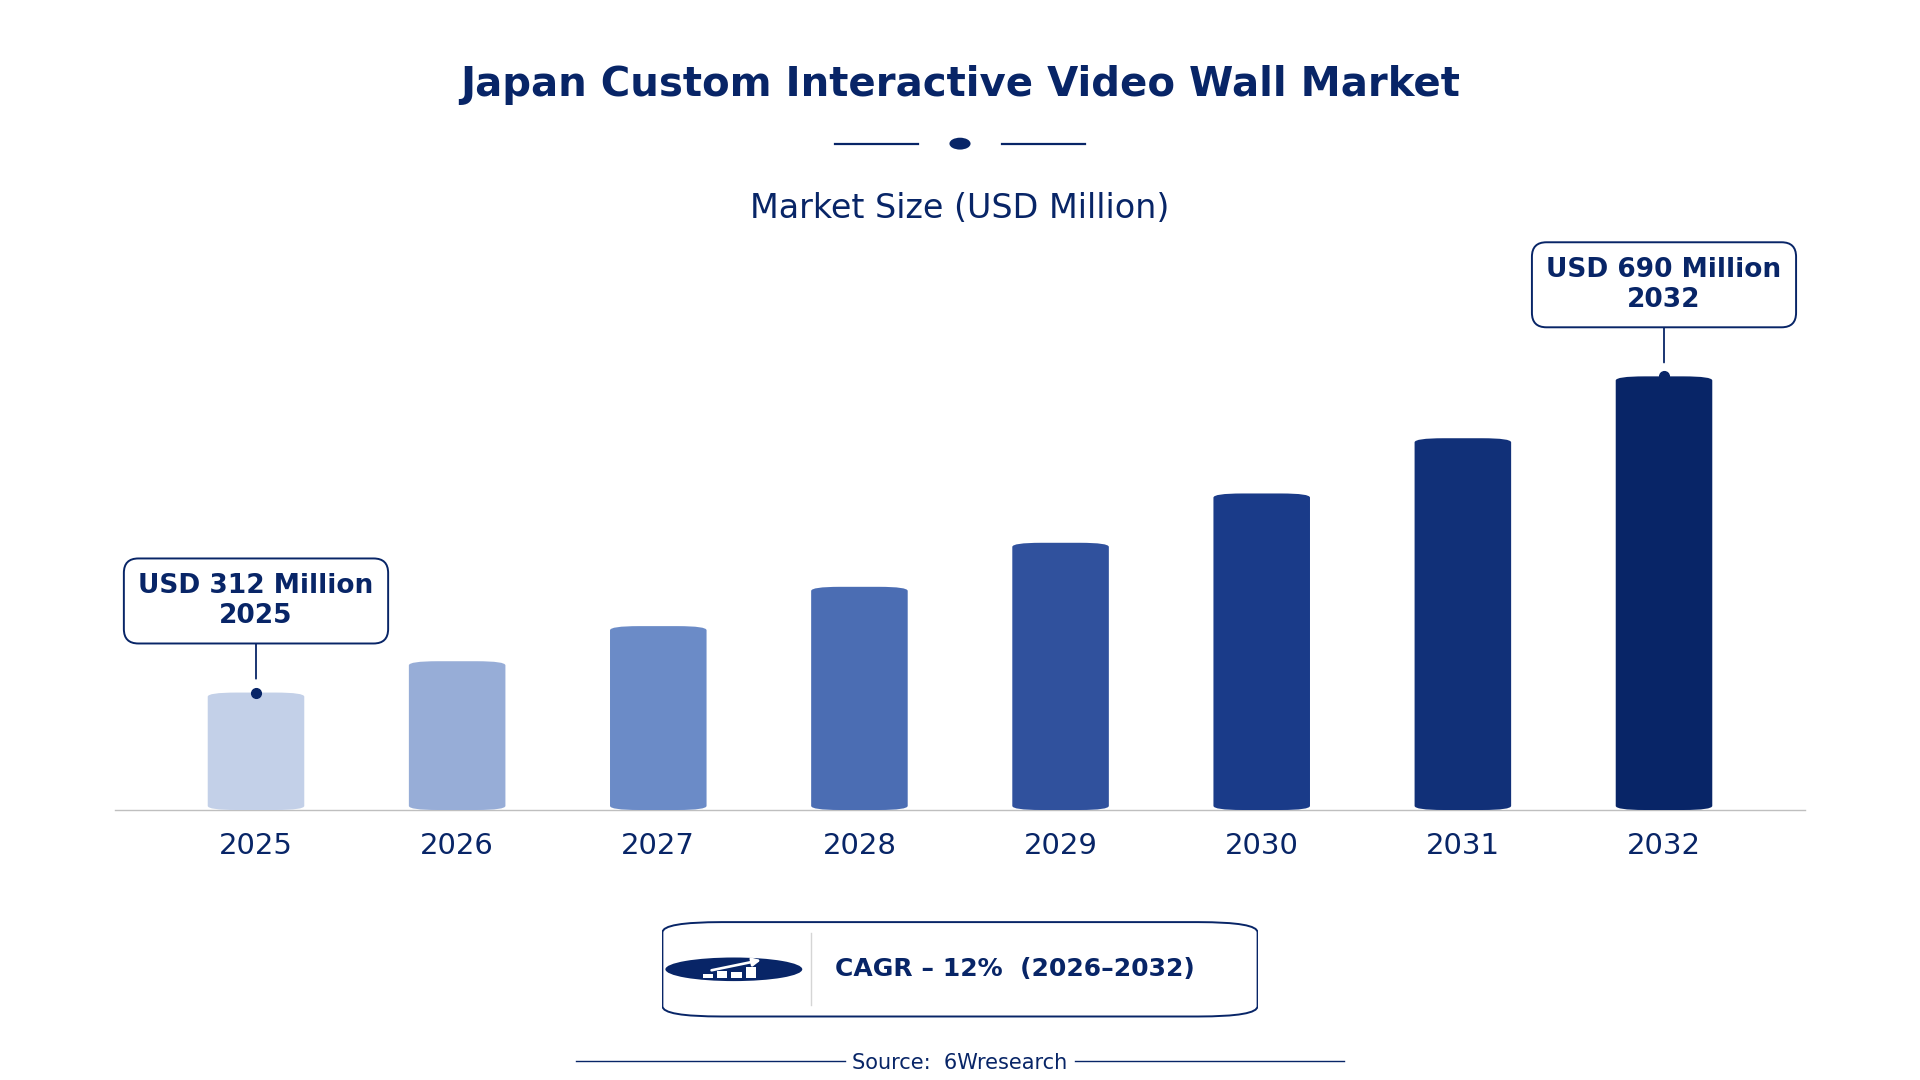
According to 6Wresearch internal database and industry insights, the Japan Custom Interactive Video Wall Market was valued at USD 312 Million in 2025 and is projected to reach USD 690 Million by 2032, growing at a CAGR of approximately 12% during 2026–2032.
Japan Custom Interactive Video Wall Market Highlights
| Report Metric | Details |
| Report Name | Japan Custom Interactive Video Wall Market (2026-2032) |
| Market Size 2025 | USD 312 Million |
| Market Size 2032 | USD 690 Million |
| Absolute Growth 2025–2032 | USD 378 Million |
| CAGR 2026–2032 | 12% |
| Peak Annual Growth | 13.8% in 2027 |
| Forecast Period | 2026–2032 |
| Historical Data | 2022–2025 |
| Base Year | 2025 |
| Leading Display Unit, 2025 | LCD (40% share) |
| Leading Frame Size, 2025 | 2x2 (47% share) |
| Leading Deployment Type, 2025 | Touch-Based (46% share) |
| Leading Organisation Size, 2025 | Small Scale Enterprise (42% share) |
| Leading End User, 2025 | Retail (43% share) |
| Fastest-Growing Display Unit | LED (14.9% CAGR) |
| Fastest-Growing Frame Size | 3x3 (15.3% CAGR) |
| Fastest-Growing Deployment Type | Touch less (16.1% CAGR) |
| Fastest-Growing Organisation Size | Medium Scale Enterprise (15.4% CAGR) |
| Fastest-Growing End User | Corporate (15.5% CAGR) |
| Growing Sector | Retail |
| Key End Users | Retail, Corporate, Healthcare, Urban Development |
Japan Custom Interactive Video Wall Market Year-wise Growth Rate and Key Drivers (2022–2032)
This graph illustrates the annual growth rates of the market from 2022 to 2032, highlighting a steady upward trajectory and projected market expansion over the forecast period.
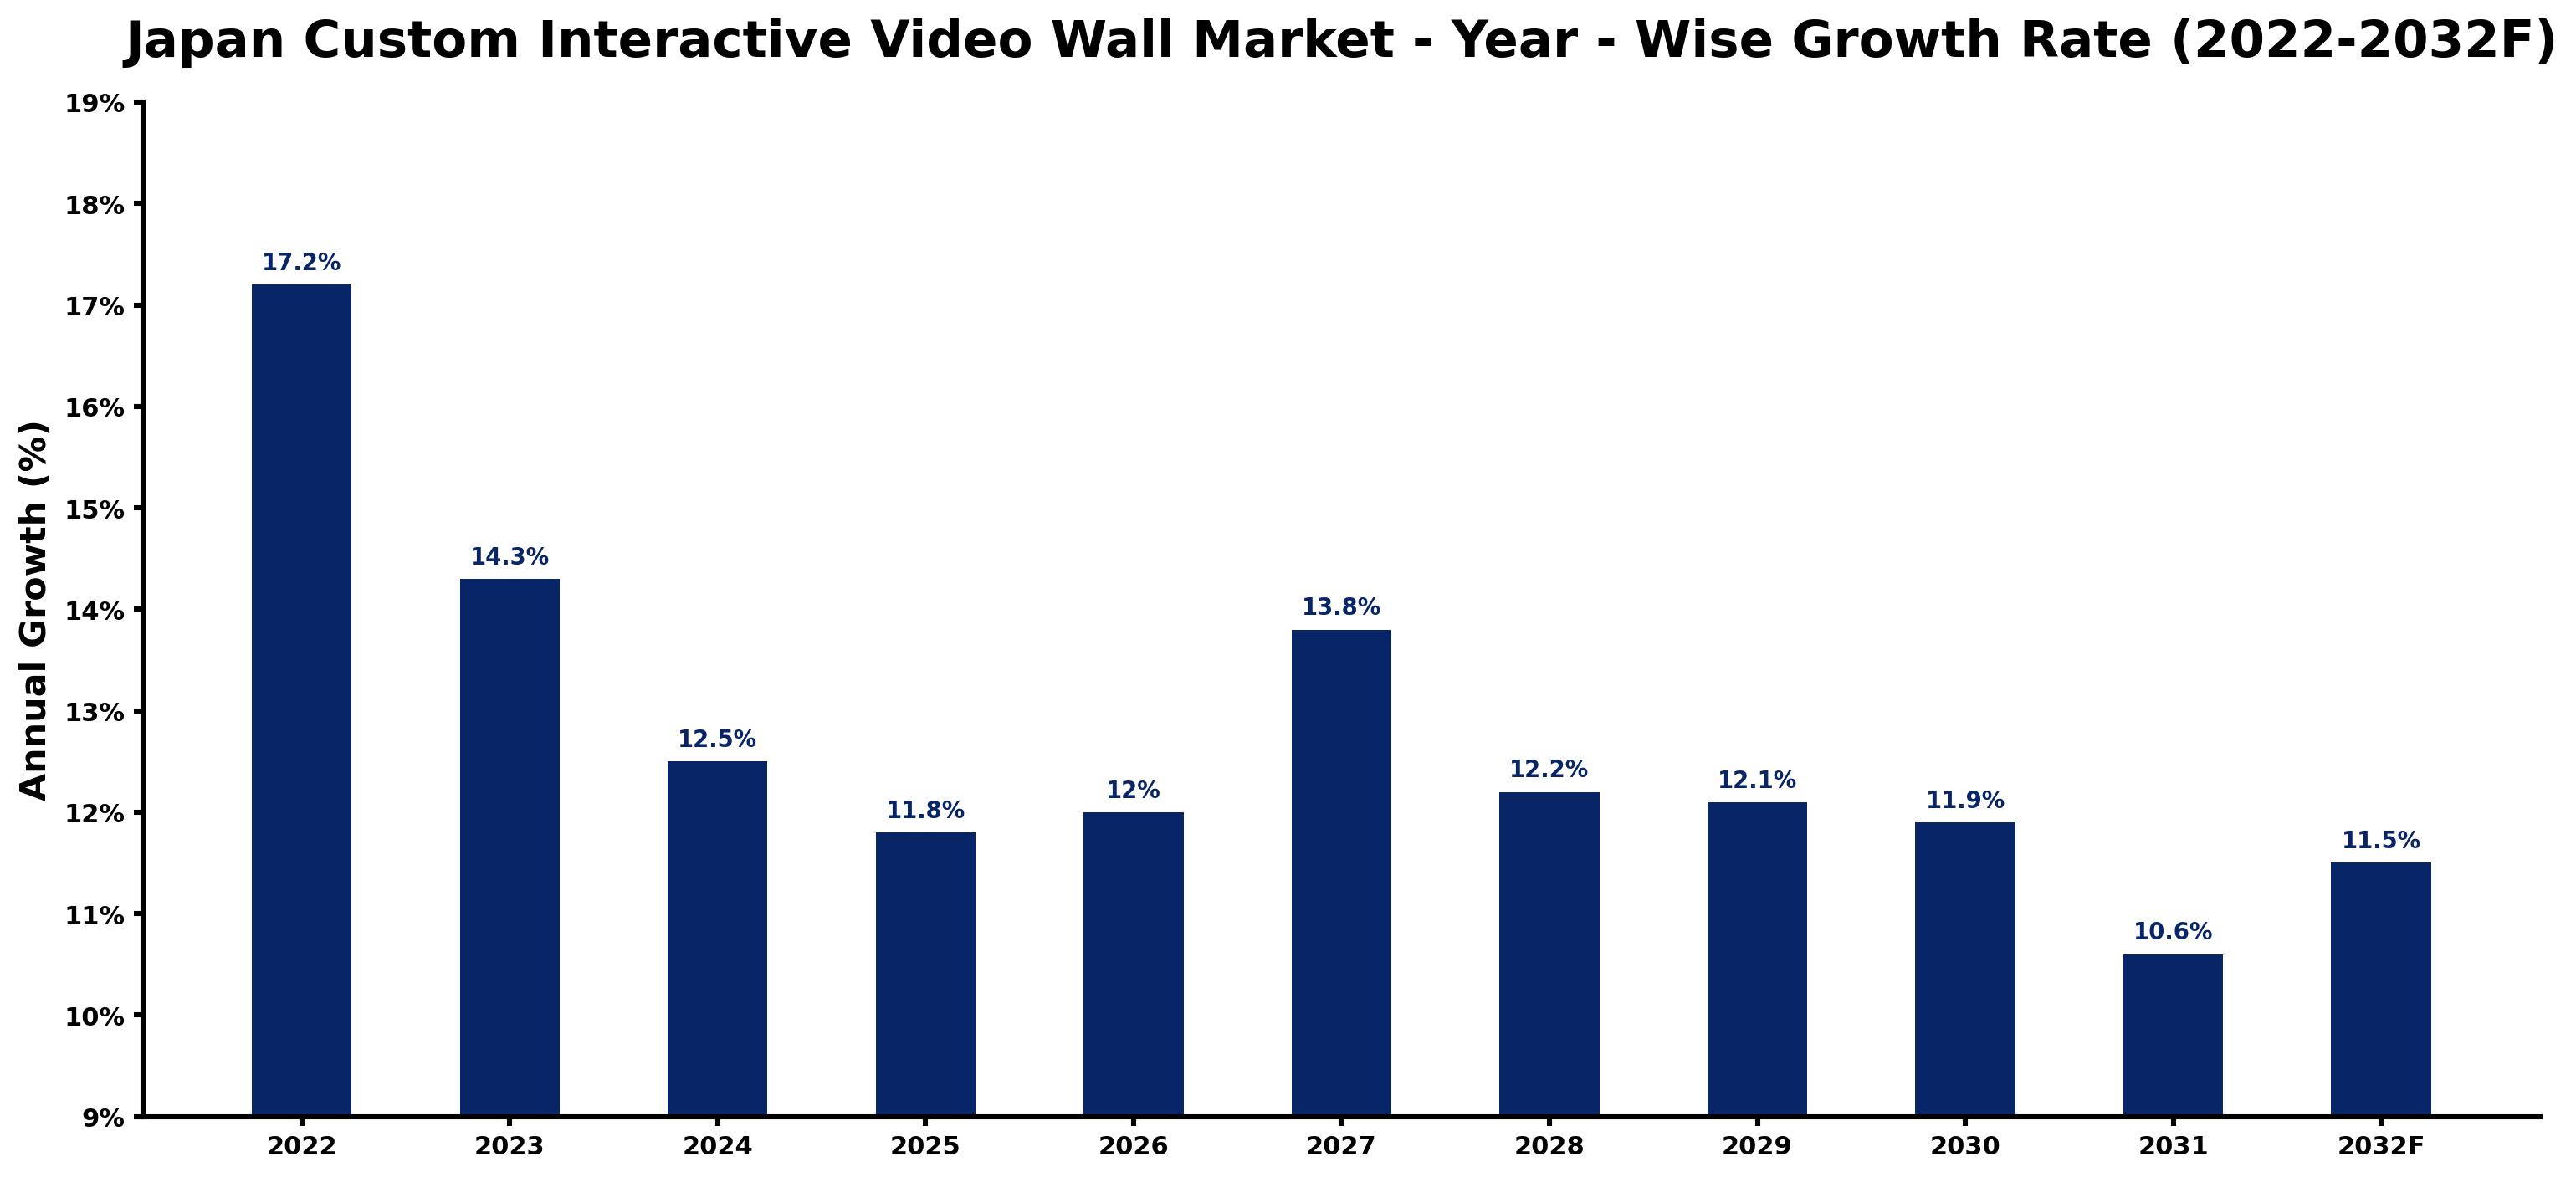
Year by year, the estimates below pair each growth rate with the development that shaped it.
| Year | Estimated Annual Growth (%) | Market Rationale |
| 2022 | 17.2 | The market experienced strong demand from the retail sector, driving growth. |
| 2023 | 14.3 | Growth slowed due to market saturation in urban areas, yet demand remained steady. |
| 2024 | 12.5 | The market continued to grow, supported by rising corporate investments in digital signage solutions. |
| 2025 | 11.8 | Growth slowed as competition intensified among suppliers for market share. |
| 2026 | 12.0 | Demand is expected to rise as businesses invest in customer engagement technologies. |
| 2027 | 13.8 | Growth is projected to accelerate with new display solutions entering the market. |
| 2028 | 12.2 | The market is likely to experience a slight slowdown as saturation effects emerge. |
| 2029 | 12.1 | Demand is expected to remain steady as businesses adapt to changing consumer preferences. |
| 2030 | 11.9 | Growth is projected to slow as economic factors influence corporate spending. |
| 2031 | 10.6 | The market is anticipated to grow as technological advancements create new opportunities. |
| 2032 | 11.5 | Demand is expected to rise with increased investments in smart city projects. |
Note: Market size estimations and growth projections presented in this report are based on 6Wresearch's proprietary forecasting methodology, utilizing the latest available industry data, government publications, and primary research inputs.
Japan Custom Interactive Video Wall Market Synopsis
Custom Interactive Video Walls are advanced display systems that combine multiple screens for presentations, primarily utilised in advertising and information dissemination. The Japan Custom Interactive Video Wall Market is growing due to increased investments in digital signage, particularly within the retail and corporate sectors, which represent 35% and 43% of the market respectively. Government initiatives such as Tokyo's smart city project are driving demand for these technologies, improving customer engagement and information delivery.
Market Dynamics Impact Analysis (2026–2032)
| Factor | Type | Impact | Primary Segment Affected |
| Rising demand for digital signage in retail | Driver | High | Retail |
| Increasing corporate investments in interactive displays | Driver | High | Corporate |
| Expansion of smart city projects incorporating video walls | Opportunity | High | LCD |
| Growing adoption of video walls in healthcare facilities | Opportunity | Medium | Healthcare |
| High initial investment costs for advanced systems | Restraint | High | Corporate |
| Limited awareness of technology benefits among SMEs | Restraint | Medium | Small Scale Enterprise |
| Intense competition among suppliers leading to price wars | Challenge | High | LCD |
| Supply chain disruptions affecting timely installations | Challenge | Medium | LCD |
Evaluation of Drivers in Japan Custom Interactive Video Wall Market (2026–2032)
Demand rests on the following drivers, each shown with the segment it touches most.
| Drivers | Primary Segment Affected | Why It Matters (Evidence) |
| Increased advertising budgets in retail | Retail | Retailers are allocating more funds to digital signage, driving demand for video walls, with the sector accounting for 35% of the market. |
| Corporate digital transformation initiatives | Corporate | Businesses are investing in interactive video walls to improve presentations, with an average corporate setup being 3x3 configurations. |
| Government support for digital signage initiatives | LCD | The Tokyo Metropolitan Government's smart city project in 2023 allocated ¥500 million for digital transformation, boosting demand. |
| Healthcare facilities adopting digital displays | Healthcare | Major hospitals are increasingly using video walls for patient information, with 20% adoption reported. |
| Technological advancements in display systems | LED | Improvements in LED technology increase visibility and energy efficiency, making video walls more appealing. |
Much of the new demand traces back to the retail sector's increasing advertising budgets, which accounted for 35% of the market. Healthcare facilities are adopting video walls for patient information, with 20% of major hospitals now using them. Advances in LED technology improve visibility and energy efficiency, making these systems more appealing to various sectors.
Evaluation of Restraints in Japan Custom Interactive Video Wall Market
The main factors holding the market back are set out below.
| Market Restraint | Primary Segment Affected | Why It Matters (Evidence) |
| High initial investment costs for advanced systems | Corporate | The average cost of a 4x4 video wall setup is around ¥3 million, limiting adoption among smaller businesses. |
| Limited awareness of technology benefits among SMEs | Small Scale Enterprise | Many small businesses have not fully recognised the advantages of interactive video walls, hindering growth. |
| Supply chain disruptions affecting timely installations | LCD | Delays in component availability can lead to longer installation times, frustrating potential buyers. |
| Intense competition among suppliers leading to price wars | LED | Price wars can erode profit margins, making it difficult for suppliers to sustain operations. |
| Regulatory compliance costs for manufacturers | LCD | Manufacturers often seek ISO 9001 certification, which incurs additional costs and time. |
Japan Custom Interactive Video Wall Market Challenges
In 2022, the average cost of a 4x4 video wall setup in Japan was around ¥3 million, which restricts investment for buyers in interactive display systems. Many suppliers struggle with outdated technology, as a lack of adoption of the latest display standards delays product availability for buyers. Compliance with ISO 9001 certification complicates operations for suppliers, resulting in extended lead times that can disrupt project schedules for buyers. Increased competition from alternative display solutions forces suppliers to lower prices, which can compromise quality and service for buyers seeking reliable installations.
Trends in the Japan Custom Interactive Video Wall Market
Several trends are reshaping the Japan Custom Interactive Video Wall Market; the most important are set out below.
- Shift from Traditional to Interactive Displays: Retailers are increasingly moving towards interactive video walls to engage customers, as seen in Tokyo's smart city project, which has over 1,000 units deployed.
- Transition to Energy-Efficient Technologies: Healthcare facilities are adopting LED video walls for patient information, with 20% of major hospitals implementing these systems to reduce energy consumption.
- Emergence of Touchless Technology: Touchless interactive displays are gaining traction, particularly in public spaces, with demand increasing as hygiene concerns rise.
- Prioritisation of Multi-Touch Capabilities: Corporate environments are focusing on multi-touch video walls to improve collaboration, reflecting a growing trend towards interactive meeting solutions.
Investment Opportunities in the Japan Custom Interactive Video Wall Market
Several openings in the Japan Custom Interactive Video Wall Market merit attention from investors.
- Supply of Interactive Video Wall Systems: With the retail sector's demand, suppliers can concentrate on providing interactive video walls, as this sector accounts for 35% of the market.
- Engagement in Smart City Projects: Involvement in urban development projects can be profitable, particularly with Tokyo's smart city initiative allocating funds for digital transformation.
- Investment in Healthcare Display Solutions: Healthcare facilities are increasingly adopting video walls, creating opportunities for suppliers to deliver tailored solutions, especially in major hospitals.
- Focus on Corporate Digital Transformation: Corporate clients are actively pursuing advanced display solutions, and suppliers can penetrate this market through partnerships with technology firms.
Government Initiatives in the Japan Custom Interactive Video Wall Market
The smart city project launched in 2023 by the Tokyo Metropolitan Government adds to existing digital signage initiatives, improving the framework for video wall deployment. This initiative complements the Long-Term Care Insurance Act, which supports technology integration in healthcare facilities, encouraging broader adoption of interactive displays.
The Ministry of Internal Affairs and Communications oversees funding for digital signage initiatives, which benefits buyers in retail and corporate sectors. The program allocates resources to support the integration of interactive video walls, facilitating their adoption in various applications.
Future Insight of the Japan Custom Interactive Video Wall Market
By 2032, government initiatives will substantially increase funding for digital transformation, generating strong demand for interactive display systems. The Tokyo Metropolitan Government's smart city project will incorporate advanced display technologies into urban environments, improving user engagement. Healthcare facilities will persist in adopting interactive solutions for patient information, driving advancements in display formats. As digital signage initiatives gain traction, suppliers will focus on developing more intuitive and versatile display systems to meet evolving market demands.
Market Segmentation Analysis
Japan Custom Interactive Video Wall Market report covers a detailed analysis of the following market segments:
By Display Unit – LCD Leads, LED Expected to Grow Fastest
According to Sumit Sagar, AM at 6Wresearch, LCD held 40% of the Japan Custom Interactive Video Wall Market by display unit in 2025. LCD technology leads the market due to its clarity and brightness, making it a preferred choice for various display wall installations. Its widespread use in retail environments, where visual impact is critical, supports its dominant position. The quickest growth will come from LED, forecast to expand at a CAGR of 14.9% between 2026 and 2032. LED technology is rapidly gaining traction as it offers high visibility and energy efficiency, appealing to sectors prioritising sustainability. The increasing adoption of LED in advertising displays is a key factor in its growth. Suppliers should prioritise LED solutions to align with the rising demand for energy-efficient display technologies.
By Frame Size – 2x2 Leads, 3x3 Expected to Grow Fastest
With 47% of frame size revenue in 2025, 2x2 was the largest category. The 2x2 frame size leads the market as it is a common configuration for small spaces, making it ideal for retail and corporate environments with limited room. This size allows for effective use in various applications without overwhelming the area. 3x3 is set to record the highest CAGR in this split, 15.3% over 2026–2032. The 3x3 frame size is gaining traction due to its suitability for medium-sized installations, which are increasingly being adopted for events and presentations. This growth reflects a shift towards more versatile display solutions. Buyers should consider the 3x3 configuration for expanding their interactive display capabilities.
By Deployment Type – Touch-Based Leads, Touch less Expected to Grow Fastest
The largest deployment type category in 2025 was Touch-Based, at 46% of revenue. Touch-Based deployment leads the market as it is crucial for interactive experiences, particularly in retail where customer engagement is paramount. This approach allows users to engage directly with content, making it an integral part of the shopping experience. Touch less is projected to grow fastest, at a CAGR of 16.1% during 2026–2032. Touchless deployment is rapidly gaining traction, primarily due to heightened hygiene awareness in public spaces. This trend is especially relevant in environments that prioritise cleanliness, such as corporate offices and healthcare facilities. Suppliers should prioritise the development of touchless technologies to meet the rising demand for hygienic interactive solutions.
By Organisation Size – Small Scale Enterprise Leads, Medium Scale Enterprise Expected to Grow Fastest
Small Scale Enterprise took 42% of organisation size revenue in 2025, more than any other category. Small Scale Enterprises hold the largest share largely due to budget limitations, which restrict their capacity to invest in larger display systems. Their cautious spending habits often lead to smaller installations that align with their financial constraints. Over 2026–2032, Medium Scale Enterprise is expected to post the fastest growth, at a CAGR of 15.4%. Medium Scale Enterprises are witnessing the fastest growth as they increasingly recognise the value of video walls for marketing purposes. This trend reflects a broader shift towards more advanced marketing strategies that enhance brand visibility. Suppliers must tailor their products to address the specific requirements of Medium Scale Enterprises.
By End User – Retail Leads, Corporate Expected to Grow Fastest
Retail accounted for 43% of the market by end user in 2025. The retail sector captures the largest share owing to its substantial demand for advertising solutions that effectively draw in customers. Retailers utilise interactive video walls to enhance their marketing strategies and engage shoppers more effectively. The quickest growth will come from Corporate, forecast to expand at a CAGR of 15.5% between 2026 and 2032. The corporate sector is experiencing the fastest growth as businesses adopt video walls for presentations and meetings, acknowledging their role in improving communication. This trend is expected to persist as companies aim to enhance collaboration and engagement. Buyers in the corporate sector should consider investing in advanced video wall technology to improve their meeting and presentation effectiveness.
Key Attractiveness of the Report
- 10 Years of Market Numbers
- Historical Data Starting from 2022 to 2025
- Base Year 2025
- Forecast Data until 2032
- Key Performance Indicators Impacting the Market
- Major Upcoming Developments and Projects
Key Highlights of the Report:
- Japan Custom Interactive Video Wall Market Outlook
- Market Size of Japan Custom Interactive Video Wall Market, 2025
- Forecast of Japan Custom Interactive Video Wall Market, 2032
- Historical Data and Forecast of Japan Custom Interactive Video Wall Revenues & Volume for the Period 2022-2032
- Japan Custom Interactive Video Wall Market Trend Evolution
- Japan Custom Interactive Video Wall Market Drivers and Challenges
- Japan Custom Interactive Video Wall Price Trends
- Japan Custom Interactive Video Wall Porter's Five Forces
- Japan Custom Interactive Video Wall Industry Life Cycle
- Historical Data and Forecast of Japan Custom Interactive Video Wall Market Revenues & Volume By Display Unit for the Period 2022-2032
- Historical Data and Forecast of Japan Custom Interactive Video Wall Market Revenues & Volume By LCD for the Period 2022-2032
- Historical Data and Forecast of Japan Custom Interactive Video Wall Market Revenues & Volume By LED for the Period 2022-2032
- Historical Data and Forecast of Japan Custom Interactive Video Wall Market Revenues & Volume By LPD for the Period 2022-2032
- Historical Data and Forecast of Japan Custom Interactive Video Wall Market Revenues & Volume By Others for the Period 2022-2032
- Historical Data and Forecast of Japan Custom Interactive Video Wall Market Revenues & Volume By Frame Size for the Period 2022-2032
- Historical Data and Forecast of Japan Custom Interactive Video Wall Market Revenues & Volume By 2x2 for the Period 2022-2032
- Historical Data and Forecast of Japan Custom Interactive Video Wall Market Revenues & Volume By 3x3 for the Period 2022-2032
- Historical Data and Forecast of Japan Custom Interactive Video Wall Market Revenues & Volume By 4x4 for the Period 2022-2032
- Historical Data and Forecast of Japan Custom Interactive Video Wall Market Revenues & Volume By Others for the Period 2022-2032
- Historical Data and Forecast of Japan Custom Interactive Video Wall Market Revenues & Volume By Deployment Type for the Period 2022-2032
- Historical Data and Forecast of Japan Custom Interactive Video Wall Market Revenues & Volume By Touch-Based for the Period 2022-2032
- Historical Data and Forecast of Japan Custom Interactive Video Wall Market Revenues & Volume By Touch less for the Period 2022-2032
- Historical Data and Forecast of Japan Custom Interactive Video Wall Market Revenues & Volume By Multi Touch for the Period 2022-2032
- Historical Data and Forecast of Japan Custom Interactive Video Wall Market Revenues & Volume By Others for the Period 2022-2032
- Historical Data and Forecast of Japan Custom Interactive Video Wall Market Revenues & Volume By Organisation Size for the Period 2022-2032
- Historical Data and Forecast of Japan Custom Interactive Video Wall Market Revenues & Volume By Small Scale Enterprise for the Period 2022-2032
- Historical Data and Forecast of Japan Custom Interactive Video Wall Market Revenues & Volume By Medium Scale Enterprise for the Period 2022-2032
- Historical Data and Forecast of Japan Custom Interactive Video Wall Market Revenues & Volume By Large Scale Enterprise for the Period 2022-2032
- Historical Data and Forecast of Japan Custom Interactive Video Wall Market Revenues & Volume By End User for the Period 2022-2032
- Historical Data and Forecast of Japan Custom Interactive Video Wall Market Revenues & Volume By Retail for the Period 2022-2032
- Historical Data and Forecast of Japan Custom Interactive Video Wall Market Revenues & Volume By Corporate for the Period 2022-2032
- Historical Data and Forecast of Japan Custom Interactive Video Wall Market Revenues & Volume By Transportation for the Period 2022-2032
- Historical Data and Forecast of Japan Custom Interactive Video Wall Market Revenues & Volume By Healthcare for the Period 2022-2032
- Historical Data and Forecast of Japan Custom Interactive Video Wall Market Revenues & Volume By Hospitality for the Period 2022-2032
- Historical Data and Forecast of Japan Custom Interactive Video Wall Market Revenues & Volume By Others for the Period 2022-2032
- Historical Data and Forecast of Japan Custom Interactive Video Wall Market Revenues & Volume By Distribution Channel for the Period 2022-2032
- Historical Data and Forecast of Japan Custom Interactive Video Wall Market Revenues & Volume By Online for the Period 2022-2032
- Historical Data and Forecast of Japan Custom Interactive Video Wall Market Revenues & Volume By Offline for the Period 2022-2032
- Japan Custom Interactive Video Wall Import Export Trade Statistics
- Market Opportunity Assessment By Display Unit
- Market Opportunity Assessment By Frame Size
- Market Opportunity Assessment By Deployment Type
- Market Opportunity Assessment By Organisation Size
- Market Opportunity Assessment By End User
- Market Opportunity Assessment By Distribution Channel
- Japan Custom Interactive Video Wall Top Companies Market Share
- Japan Custom Interactive Video Wall Competitive Benchmarking By Technical and Operational Parameters
- Japan Custom Interactive Video Wall Company Profiles
- Japan Custom Interactive Video Wall Key Strategic Recommendations
Market Covered
This report examines the market across the segments below.
By Display Unit
- LCD
- LED
- LPD
- Others
By Frame Size
- 2x2
- 3x3
- 4x4
- Others
By Deployment Type
- Touch-Based
- Touch less
- Multi Touch
- Others
By Organisation Size
- Small Scale Enterprise
- Medium Scale Enterprise
- Large Scale Enterprise
By End User
- Retail
- Corporate
- Transportation
- Healthcare
- Hospitality
- Others































