Japan Electronic Appliance Stores Market Size & Growth Rate
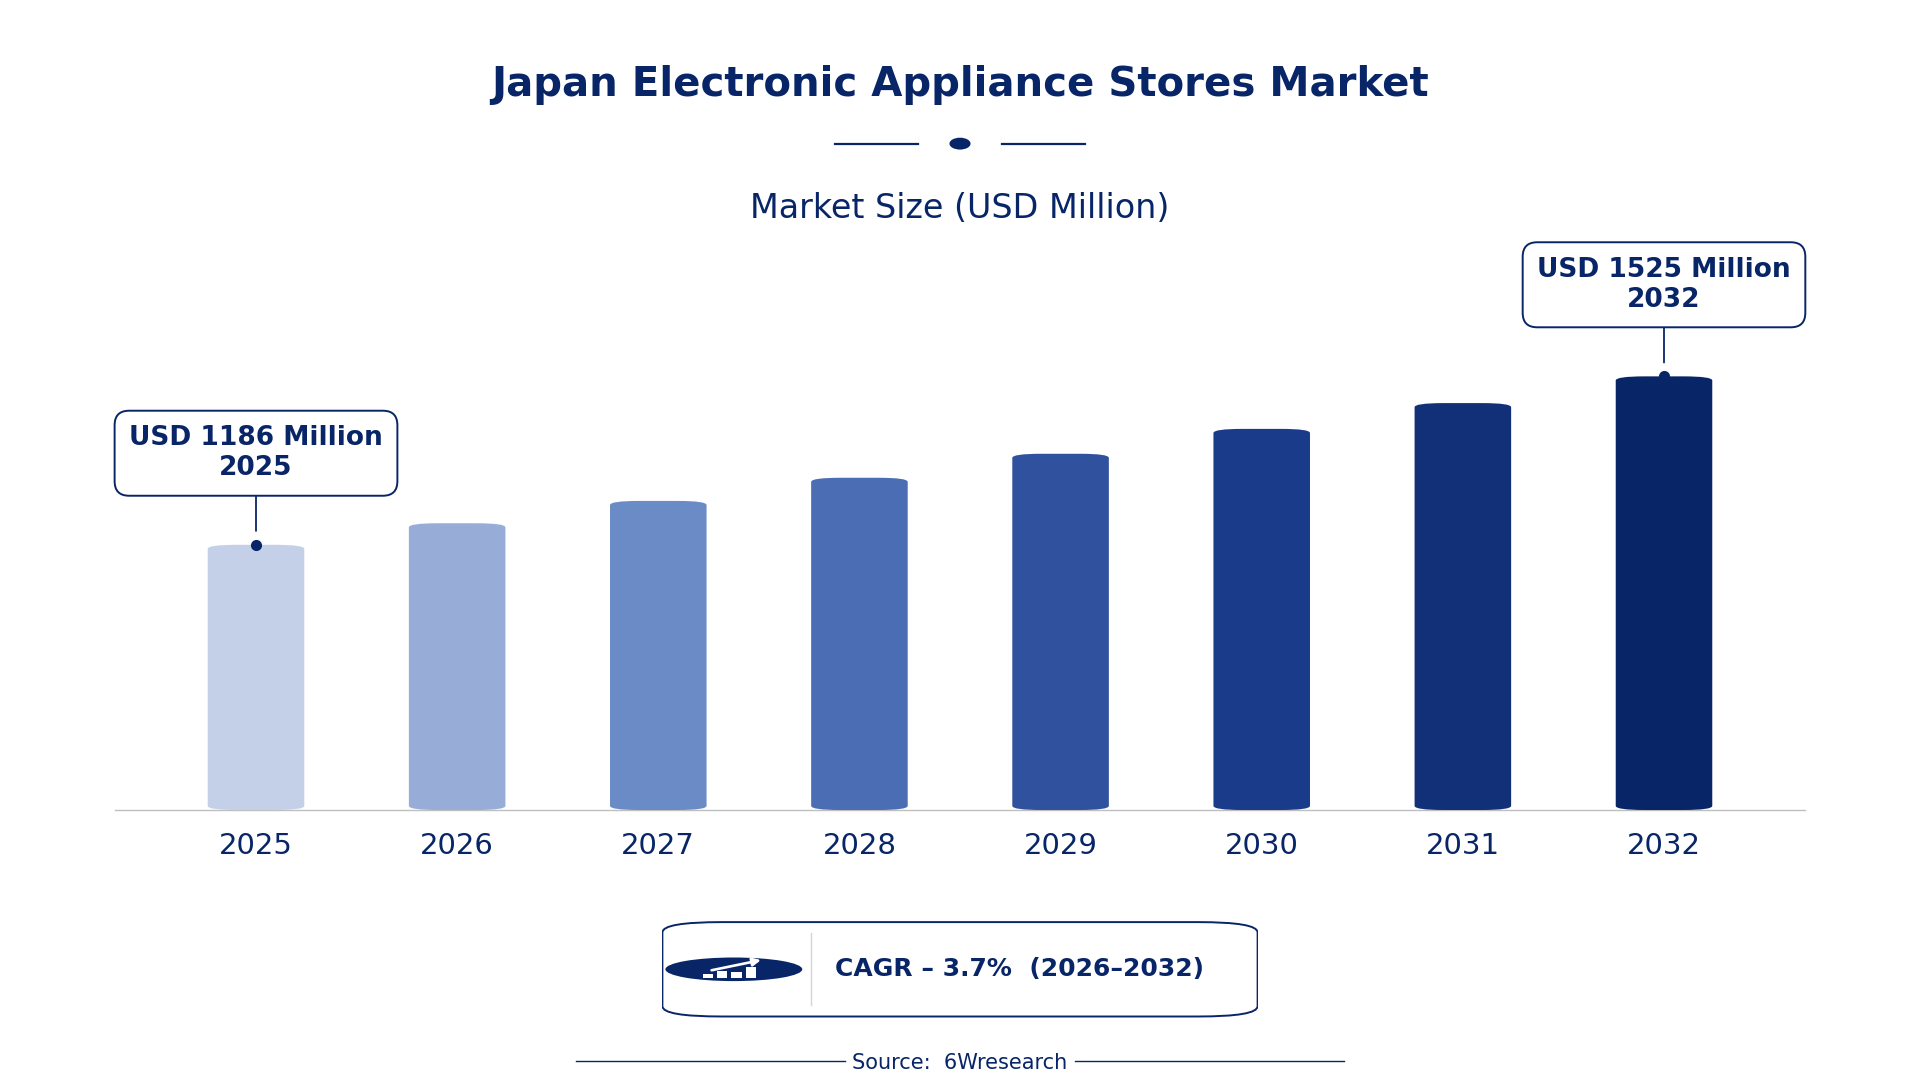
According to 6Wresearch internal database and industry insights, the Japan Electronic Appliance Stores Market was valued at USD 1,186 Million in 2025 and is projected to reach USD 1,525 Million by 2032, growing at a CAGR of approximately 3.7% during 2026–2032.
Japan Electronic Appliance Stores Market Highlights
| Report Metric | Details |
| Report Name | Japan Electronic Appliance Stores Market (2026-2032) |
| Market Size 2025 | USD 1,186 Million |
| Market Size 2032 | USD 1,525 Million |
| Absolute Growth 2025–2032 | USD 339 Million |
| CAGR 2026–2032 | 3.7% |
| Peak Annual Growth | 4.5% in 2029 |
| Forecast Period | 2026–2032 |
| Historical Data | 2022–2025 |
| Base Year | 2025 |
| Leading Store Type, 2025 | Specialty Electronics Stores (37% share) |
| Leading Features, 2025 | Warranty Services (45% share) |
| Leading Product Category, 2025 | Smartphones (47% share) |
| Leading End User, 2025 | Consumers (33% share) |
| Leading Sales Channel, 2025 | Online & Offline (43% share) |
| Fastest-Growing Store Type | Online Electronics Marketplaces (5.3% CAGR) |
| Fastest-Growing Features | In-Store Demos (4.7% CAGR) |
| Fastest-Growing Product Category | Wearables (5.7% CAGR) |
| Fastest-Growing End User | Gamers (4.8% CAGR) |
| Fastest-Growing Sales Channel | E-commerce (4.9% CAGR) |
| Growing Sector | Consumer Electronics |
| Key End Users | Consumers, Homeowners, Small Businesses |
Japan Electronic Appliance Stores Market Year-wise Growth Rate and Key Drivers (2022–2032)
This graph illustrates the annual growth rates of the market from 2022 to 2032, highlighting a steady upward trajectory and projected market expansion over the forecast period.
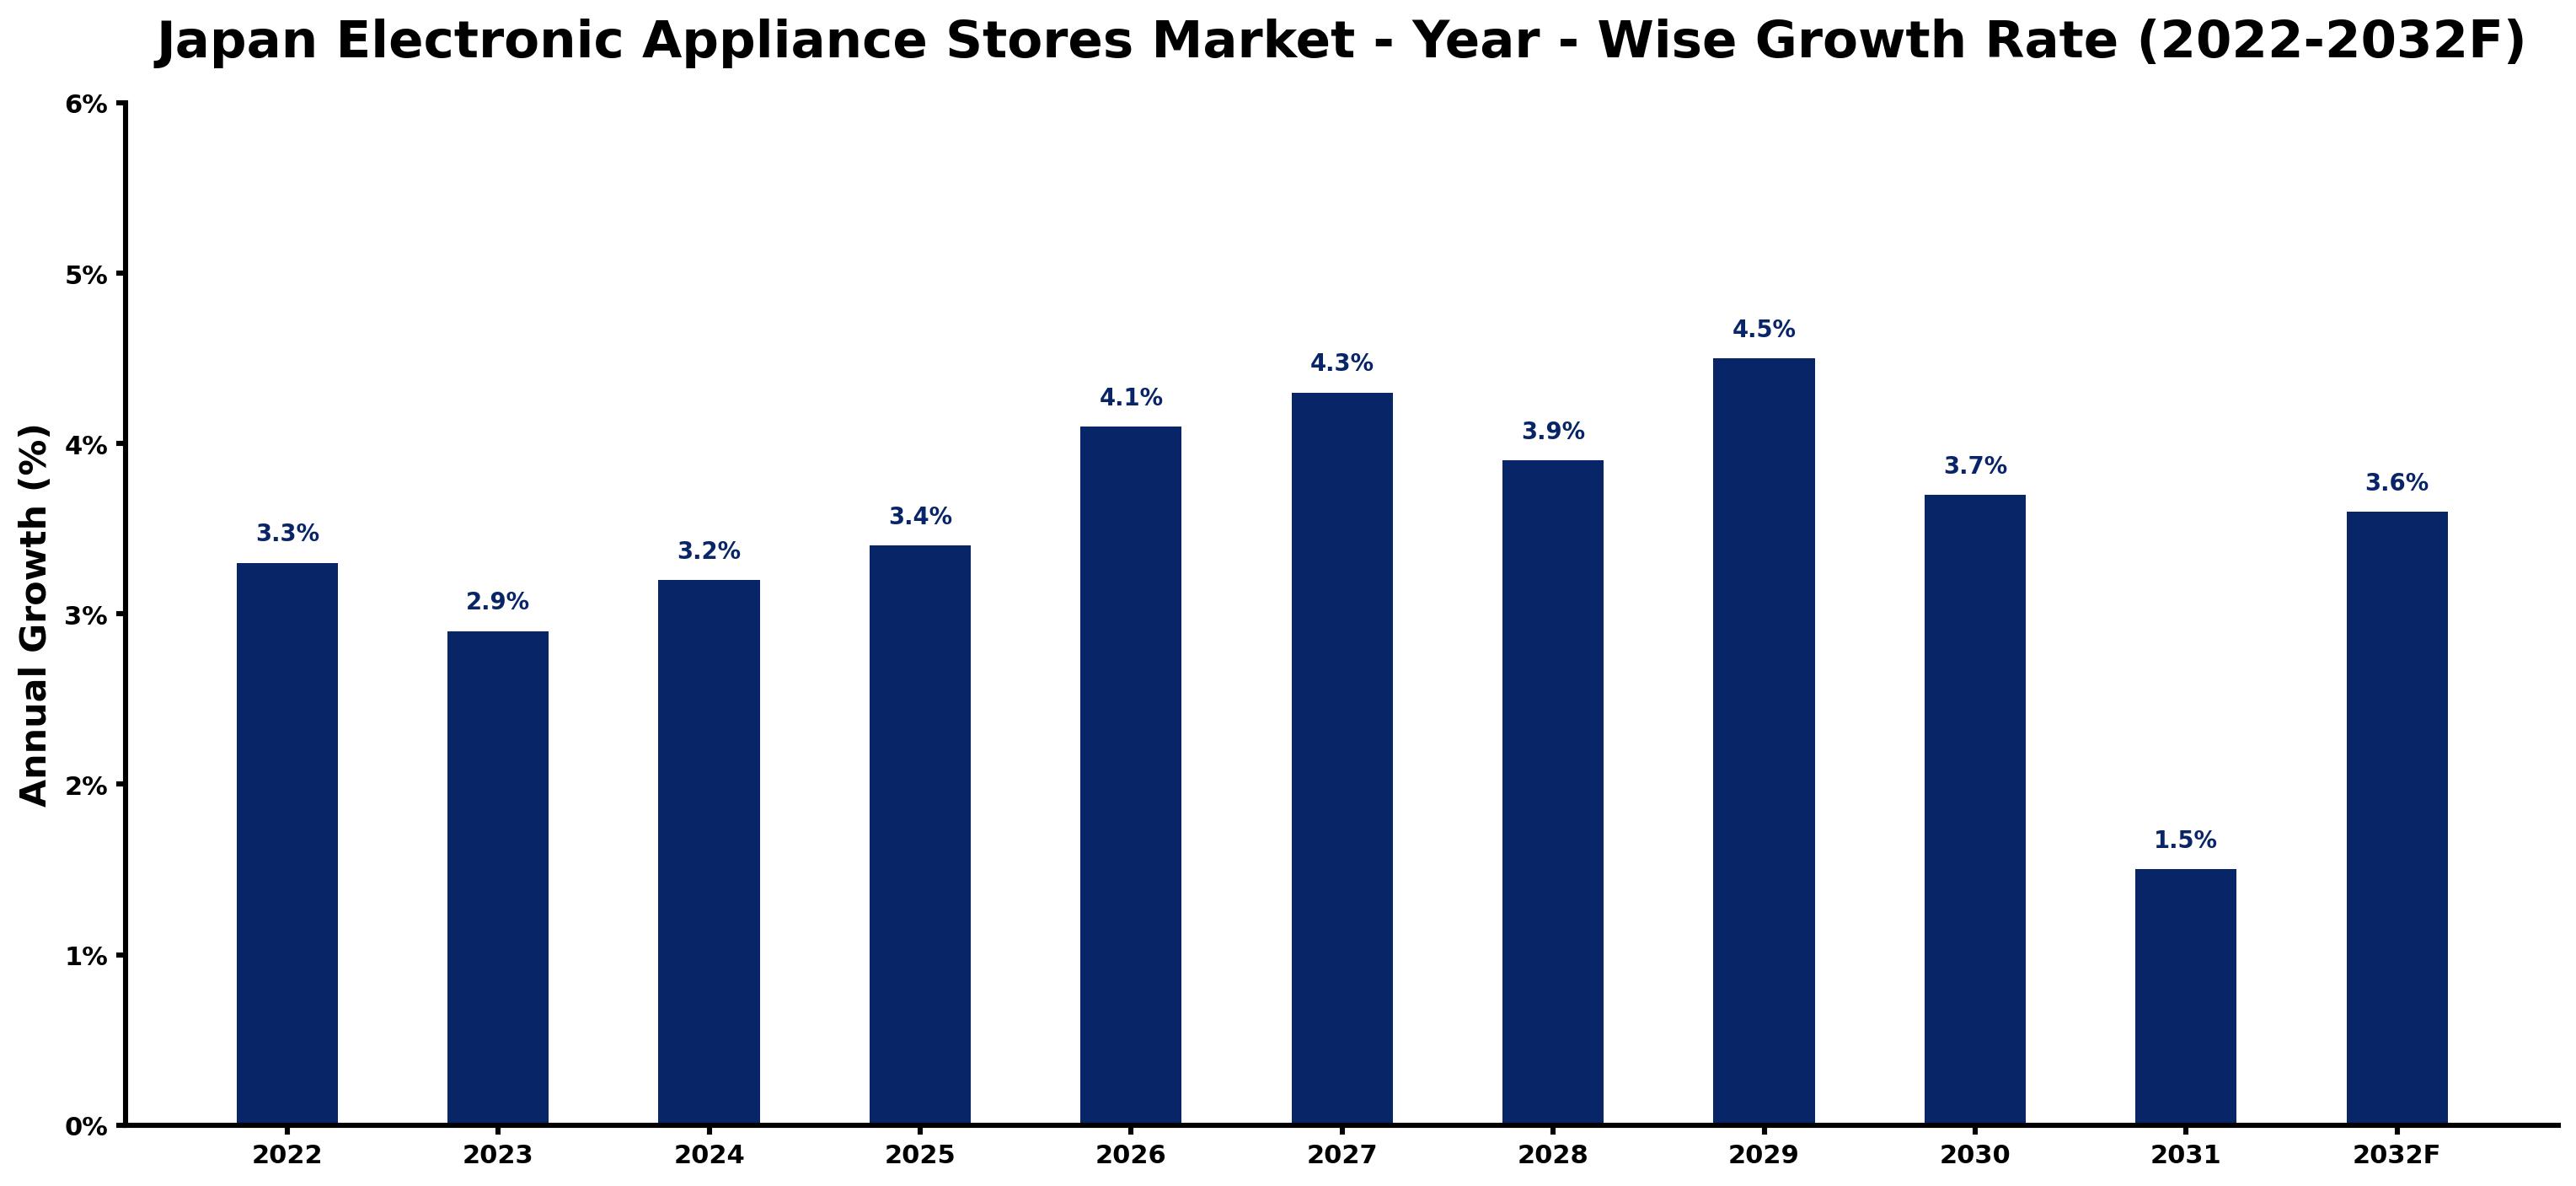
Each row of the following table gives one year's estimated growth and the event or demand shift that explains it.
| Year | Estimated Annual Growth (%) | Market Rationale |
| 2022 | 3.3 | Consumer electronics demand remained steady, reflecting ongoing interest in technology. |
| 2023 | 2.9 | Market growth slowed slightly due to economic uncertainties affecting consumer spending. |
| 2024 | 3.2 | Increased household spending on electronics led to faster growth compared to the previous year. |
| 2025 | 3.4 | Consumer interest in smart devices continued to drive growth in the market. |
| 2026 | 4.1 | Rising investments in energy-efficient appliances will spur demand across various segments. |
| 2027 | 4.3 | Technological advancements in home appliances will contribute to further market expansion. |
| 2028 | 3.9 | Growth will moderate as consumers become more selective in their purchases. |
| 2029 | 4.5 | The introduction of new smart home products will accelerate market growth. |
| 2030 | 3.7 | Demand growth will slow as market saturation begins to affect new purchases. |
| 2031 | 1.5 | Consumer electronics purchases will decrease as economic conditions tighten. |
| 2032 | 3.6 | A renewed interest in smart appliances will boost market activity in this year. |
Note: Market size estimations and growth projections presented in this report are based on 6Wresearch's proprietary forecasting methodology, utilizing the latest available industry data, government publications, and primary research inputs.
Japan Electronic Appliance Stores Market Synopsis
Electronic appliance stores in Japan are dedicated retail outlets that offer a variety of consumer electronics and home appliances. Tokyo hosts numerous specialty stores catering to diverse consumer needs. The Japan Electronic Appliance Stores Market is expanding due to rising household ownership of smart devices, with the average household owning 3.5 devices. The increasing popularity of online shopping accounted for 35% of electronic appliance sales in 2023, while government initiatives promoting energy-efficient appliances further stimulate demand.
Market Dynamics Impact Analysis (2026–2032)
| Factor | Type | Impact | Primary Segment Affected |
| Increased household ownership of smart devices | Driver | High | Smartphones |
| Rising online shopping trends | Driver | High | Online Electronics Marketplaces |
| Growing demand for warranty services | Opportunity | High | Warranty Services |
| Expansion of e-commerce platforms | Opportunity | High | E-commerce |
| Economic uncertainties affecting consumer spending | Restraint | Medium | Multi-Brand Retailers |
| Market saturation in certain electronics categories | Restraint | Medium | Discount Electronics Stores |
| High competition among retailers | Challenge | High | Specialty Electronics Stores |
| Rising operational costs for physical stores | Challenge | Medium | Brick & Mortar |
Evaluation of Drivers in Japan Electronic Appliance Stores Market (2026–2032)
Key forces behind demand, with the segment each one moves most, are listed below.
| Drivers | Primary Segment Affected | Why It Matters (Evidence) |
| Increased household ownership of smart devices | Smartphones | The average household owns 3.5 smart devices, driving frequent purchases of related electronics. |
| Rising online shopping trends | Online Electronics Marketplaces | In 2023, e-commerce transactions in electronics reached 1.2 billion, boosting sales. |
| Growing demand for warranty services | Warranty Services | Warranty services are mandated by law, ensuring consumer protection and increasing store visits. |
| Expansion of e-commerce platforms | E-commerce | Online marketplaces accounted for 35% of electronic appliance sales in 2023, increasing accessibility. |
| Technological advancements in appliances | Home Appliances | The Japanese government promotes energy-efficient appliances, leading to increased consumer interest. |
Purchasing is picking up as households increasingly invest in smart devices, with the average household owning 3.5 devices. E-commerce transactions in electronics reached 1.2 billion in 2023, boosting online sales platforms. The legal requirement for warranty services ensures that buyers feel secure in their purchases, influencing their buying decisions. Support for energy-efficient appliances drives consumer interest in modern technology, while online marketplaces accounted for 35% of sales, facilitating easier access to electronics for consumers.
Evaluation of Restraints in Japan Electronic Appliance Stores Market
The key brakes on demand, and where they bite hardest, are shown below.
| Market Restraint | Primary Segment Affected | Why It Matters (Evidence) |
| Economic uncertainties affecting consumer spending | Multi-Brand Retailers | Economic fluctuations have led to cautious spending habits among consumers, impacting sales. |
| Market saturation in certain electronics categories | Discount Electronics Stores | Saturation in the smartphone market has limited growth opportunities for discount retailers. |
| High competition among retailers | Specialty Electronics Stores | Intense competition drives prices down, affecting profit margins for specialty stores. |
| Rising operational costs for physical stores | Brick & Mortar | Increased rent and utility costs are straining the profitability of physical retail locations. |
| Consumer preferences shifting towards online shopping | E-commerce | As more consumers prefer online shopping, traditional retailers face declining foot traffic. |
Japan Electronic Appliance Stores Market Challenges
Intense competition among electronic appliance stores drives aggressive pricing strategies, which can erode profit margins for retailers. This situation exists due to the presence of over 15,000 stores in Japan, all vying for the same consumer base. Buyers face challenges with fluctuating prices, as discounts can obscure product value, leading to hesitation in their purchasing decisions. The average consumer spends about 50,000 yen annually on electronics but often delays purchases due to uncertainty. Rising operational costs for energy-efficient appliances compel retailers to cut back on staff training, resulting in skills shortages that diminish service quality and extend repair times for consumers dependent on warranty services.
Trends in the Japan Electronic Appliance Stores Market
These developments are changing demand patterns in the Japan Electronic Appliance Stores Market.
- Shift towards Smart Home Appliances: In 2023, the Japanese government launched a 'Smart Home' initiative to promote smart appliances. This trend is visible as households increasingly invest in connected devices, improving convenience and energy efficiency.
- Growth of E-commerce in Electronics: The rise of online electronics marketplaces has transformed consumer purchasing patterns. In 2023, these platforms accounted for 35% of all electronic appliance sales, reflecting a shift in buyer behaviour.
- Increased Focus on Warranty Services: Consumers are prioritising warranty services when purchasing electronics. The legal requirement for warranty services ensures that buyers feel secure in their purchases, influencing their buying decisions.
- Expansion of In-Store Demos: In-store demonstrations have become increasingly popular among consumers. These experiences allow customers to test products before purchase, improving the shopping experience and driving sales.
Investment Opportunities in the Japan Electronic Appliance Stores Market
The opportunities below stand out in the Japan Electronic Appliance Stores Market for new entrants and existing suppliers.
- Partnerships with E-commerce Platforms: Now is the time to collaborate with e-commerce platforms, given that online sales accounted for 35% of the market in 2023. Partnering with online marketplaces can increase visibility and sales.
- Investment in Smart Home Technology: With the government's 'Smart Home' initiative promoting smart appliances, there is a growing market for new products. Investing in smart home technology can attract tech-savvy consumers.
- Expansion of Warranty Service Offerings: The legal mandate for warranty services presents an opportunity to improve customer loyalty. Retailers can invest in comprehensive warranty offerings to attract more consumers.
- Focus on Energy-Efficient Appliances: The target to reduce energy consumption by 20% by 2030 creates a demand for energy-efficient products. Suppliers can focus on developing and marketing these appliances to meet consumer needs.
Government Initiatives in the Japan Electronic Appliance Stores Market
The Electrical Appliance and Material Safety Act regulates the safety of electrical appliances sold in Japan, ensuring that producers meet safety standards. This law mandates compliance with quality assurance measures, building consumer trust in the market by ensuring that products are safe and reliable. The Industrial Standardization Act further supports these efforts by establishing JIS standards for product safety and quality, which are critical for consumer electronics.
The Semiconductor and Digital Industry Strategy, overseen by the Ministry of Economy, Trade and Industry, funds initiatives to secure domestic semiconductor manufacturing. This strategy supports the electronics sector by ensuring a stable supply of essential components, which benefits electronic appliance stores and their buyers.
Future Insight of the Japan Electronic Appliance Stores Market
By 2032, smart home technology will reshape the demand for electronic appliances, driven by the government's 'Smart Home' initiative. Energy-efficient appliances will see a boost, aligning with the target to reduce energy consumption by 20% by 2030. E-commerce will flourish, with online transactions in electronics expected to surpass 1.5 billion. The push for compliance with the JIS standard will enhance product quality and safety, reassuring buyers and encouraging higher spending on electronics.
Market Segmentation Analysis
Japan Electronic Appliance Stores Market report covers a detailed analysis of the following market segments:
By Store Type – Specialty Electronics Stores Lead, Online Electronics Marketplaces Expected to Grow Fastest
According to Shubham Deep, Research Manager at 6Wresearch, with 37% of store type revenue in 2025, Specialty Electronics Stores was the largest category. Specialty electronics stores hold the largest market share due to their ability to offer tailored products and services that resonate with consumer preferences. For instance, the abundance of these stores in Tokyo allows them to effectively cater to the diverse needs of local buyers. Online Electronics Marketplaces are set to record the highest CAGR in this split, 5.3% over 2026–2032. The online electronics marketplaces are experiencing rapid growth as younger consumers increasingly favour the convenience of online shopping, with e-commerce transactions in electronics reaching 1.2 billion in 2023. This trend indicates that specialty stores will continue to adapt and expand their online presence to maintain their market position. Suppliers must enhance their online strategies to capture the growing demand from younger consumers.
By Features – Warranty Services Lead, In-Store Demos Expected to Grow Fastest
Warranty Services held 45% of the Japan Electronic Appliance Stores Market by features in 2025. Warranty services are vital in the market as they provide essential consumer protection, ensuring peace of mind for buyers. This feature significantly influences purchasing decisions, as consumers seek assurance when investing in electronics. In-Store Demos are projected to grow fastest, at a CAGR of 4.7% during 2026–2032. In-store demos are becoming increasingly popular as they allow consumers to experience products firsthand before making a purchase, thereby enhancing the overall shopping experience. This trend suggests that while warranty services remain crucial, engaging in-store experiences will attract more customers. Retailers should focus on providing interactive in-store experiences to complement warranty offerings.
By Product Category – Smartphones Lead, Wearables Expected to Grow Fastest
Smartphones took 47% of product category revenue in 2025, more than any other category. Smartphones lead the product category as they are a primary driver of foot traffic and online sales, with the average household owning 3.5 smart devices. Their widespread popularity reflects the high consumer demand for the latest technology. The quickest growth will come from Wearables, forecast to expand at a CAGR of 5.7% between 2026 and 2032. Wearables are experiencing rapid growth as they gain traction among consumers, driven by increasing interest in health and fitness tracking. Although a smaller category compared to smartphones, this trend indicates potential for further expansion. Suppliers should consider diversifying their wearable product lines to capitalise on this growing interest.
By End User – Consumers Lead, Gamers Expected to Grow Fastest
In 2025, Consumers led the end user split with a 33% share. Consumers represent the largest end-user group, as they are the primary purchasers of electronic appliances in Japan. Their consistent annual spending of approximately 50,000 yen on electronics drives overall market growth. Over 2026–2032, Gamers are expected to post the fastest growth, at a CAGR of 4.8%. Gamers are emerging as a rapidly growing niche market, significantly influencing demand for electronics tailored to their specific needs. This segment's expansion indicates a shift in focus for suppliers towards gaming-related products. Retailers should tailor their offerings to better meet the unique demands of the gaming community.
By Sales Channel – Online & Offline Leads, E-commerce Expected to Grow Fastest
The largest sales channel category in 2025 was Online & Offline, at 43% of revenue. The online and offline sales channels are essential for effectively reaching customers, with a substantial portion of sales occurring through both avenues. This balance ensures comprehensive market coverage and accessibility for consumers. E-commerce is set to record the highest CAGR in this split, 4.9% over 2026–2032. E-commerce is rapidly expanding as a preferred sales channel, reflecting changing consumer preferences towards online shopping for electronics. This growth suggests that traditional retailers must enhance their online strategies to remain competitive. Suppliers should invest in e-commerce capabilities to align with shifting consumer purchasing behaviours.
Key Attractiveness of the Report
- 10 Years of Market Numbers
- Historical Data Starting from 2022 to 2025
- Base Year 2025
- Forecast Data until 2032
- Key Performance Indicators Impacting the Market
- Major Upcoming Developments and Projects
Key Highlights of the Report:
- Japan Electronic Appliance Stores Market Outlook
- Market Size of Japan Electronic Appliance Stores Market,2025
- Forecast of Japan Electronic Appliance Stores Market, 2032
- Historical Data and Forecast of Japan Electronic Appliance Stores Revenues & Volume for the Period 2022-2032
- Japan Electronic Appliance Stores Market Trend Evolution
- Japan Electronic Appliance Stores Market Drivers and Challenges
- Japan Electronic Appliance Stores Price Trends
- Japan Electronic Appliance Stores Porter's Five Forces
- Japan Electronic Appliance Stores Industry Life Cycle
- Historical Data and Forecast of Japan Electronic Appliance Stores Market Revenues & Volume By Store Type for the Period 2022-2032
- Historical Data and Forecast of Japan Electronic Appliance Stores Market Revenues & Volume By Specialty Electronics Stores for the Period 2022-2032
- Historical Data and Forecast of Japan Electronic Appliance Stores Market Revenues & Volume By Multi-Brand Retailers for the Period 2022-2032
- Historical Data and Forecast of Japan Electronic Appliance Stores Market Revenues & Volume By Discount Electronics Stores for the Period 2022-2032
- Historical Data and Forecast of Japan Electronic Appliance Stores Market Revenues & Volume By Online Electronics Marketplaces for the Period 2022-2032
- Historical Data and Forecast of Japan Electronic Appliance Stores Market Revenues & Volume By Features for the Period 2022-2032
- Historical Data and Forecast of Japan Electronic Appliance Stores Market Revenues & Volume By In-Store Demos for the Period 2022-2032
- Historical Data and Forecast of Japan Electronic Appliance Stores Market Revenues & Volume By Warranty Services for the Period 2022-2032
- Historical Data and Forecast of Japan Electronic Appliance Stores Market Revenues & Volume By Refurbished Products for the Period 2022-2032
- Historical Data and Forecast of Japan Electronic Appliance Stores Market Revenues & Volume By Free Shipping for the Period 2022-2032
- Historical Data and Forecast of Japan Electronic Appliance Stores Market Revenues & Volume By Product Category for the Period 2022-2032
- Historical Data and Forecast of Japan Electronic Appliance Stores Market Revenues & Volume By Smartphones for the Period 2022-2032
- Historical Data and Forecast of Japan Electronic Appliance Stores Market Revenues & Volume By Home Appliances for the Period 2022-2032
- Historical Data and Forecast of Japan Electronic Appliance Stores Market Revenues & Volume By Laptops & PCs for the Period 2022-2032
- Historical Data and Forecast of Japan Electronic Appliance Stores Market Revenues & Volume By Wearables for the Period 2022-2032
- Historical Data and Forecast of Japan Electronic Appliance Stores Market Revenues & Volume By End User for the Period 2022-2032
- Historical Data and Forecast of Japan Electronic Appliance Stores Market Revenues & Volume By Consumers for the Period 2022-2032
- Historical Data and Forecast of Japan Electronic Appliance Stores Market Revenues & Volume By Homeowners for the Period 2022-2032
- Historical Data and Forecast of Japan Electronic Appliance Stores Market Revenues & Volume By Small Businesses for the Period 2022-2032
- Historical Data and Forecast of Japan Electronic Appliance Stores Market Revenues & Volume By Gamers for the Period 2022-2032
- Historical Data and Forecast of Japan Electronic Appliance Stores Market Revenues & Volume By Sales Channel for the Period 2022-2032
- Historical Data and Forecast of Japan Electronic Appliance Stores Market Revenues & Volume By Online & Offline for the Period 2022-2032
- Historical Data and Forecast of Japan Electronic Appliance Stores Market Revenues & Volume By Brick & Mortar for the Period 2022-2032
- Historical Data and Forecast of Japan Electronic Appliance Stores Market Revenues & Volume By E-commerce for the Period 2022-2032
- Historical Data and Forecast of Japan Electronic Appliance Stores Market Revenues & Volume By Direct-To-Consumer for the Period 2022-2032
- Japan Electronic Appliance Stores Import Export Trade Statistics
- Market Opportunity Assessment By Store Type
- Market Opportunity Assessment By Features
- Market Opportunity Assessment By Product Category
- Market Opportunity Assessment By End User
- Market Opportunity Assessment By Sales Channel
- Japan Electronic Appliance Stores Top Companies Market Share
- Japan Electronic Appliance Stores Competitive Benchmarking By Technical and Operational Parameters
- Japan Electronic Appliance Stores Company Profiles
- Japan Electronic Appliance Stores Key Strategic Recommendations
Market Covered
The report covers the following segments.
By Store Type
- Specialty Electronics Stores
- Multi-Brand Retailers
- Discount Electronics Stores
- Online Electronics Marketplaces
By Features
- In-Store Demos
- Warranty Services
- Refurbished Products
- Free Shipping
By Product Category
- Smartphones
- Home Appliances
- Laptops & PCs
- Wearables
By End User
- Consumers
- Homeowners
- Small Businesses
- Gamers
By Sales Channel
- Online & Offline
- Brick & Mortar
- E-commerce
- Direct-To-Consumer