Japan Entertainment Display Market Size & Growth Rate
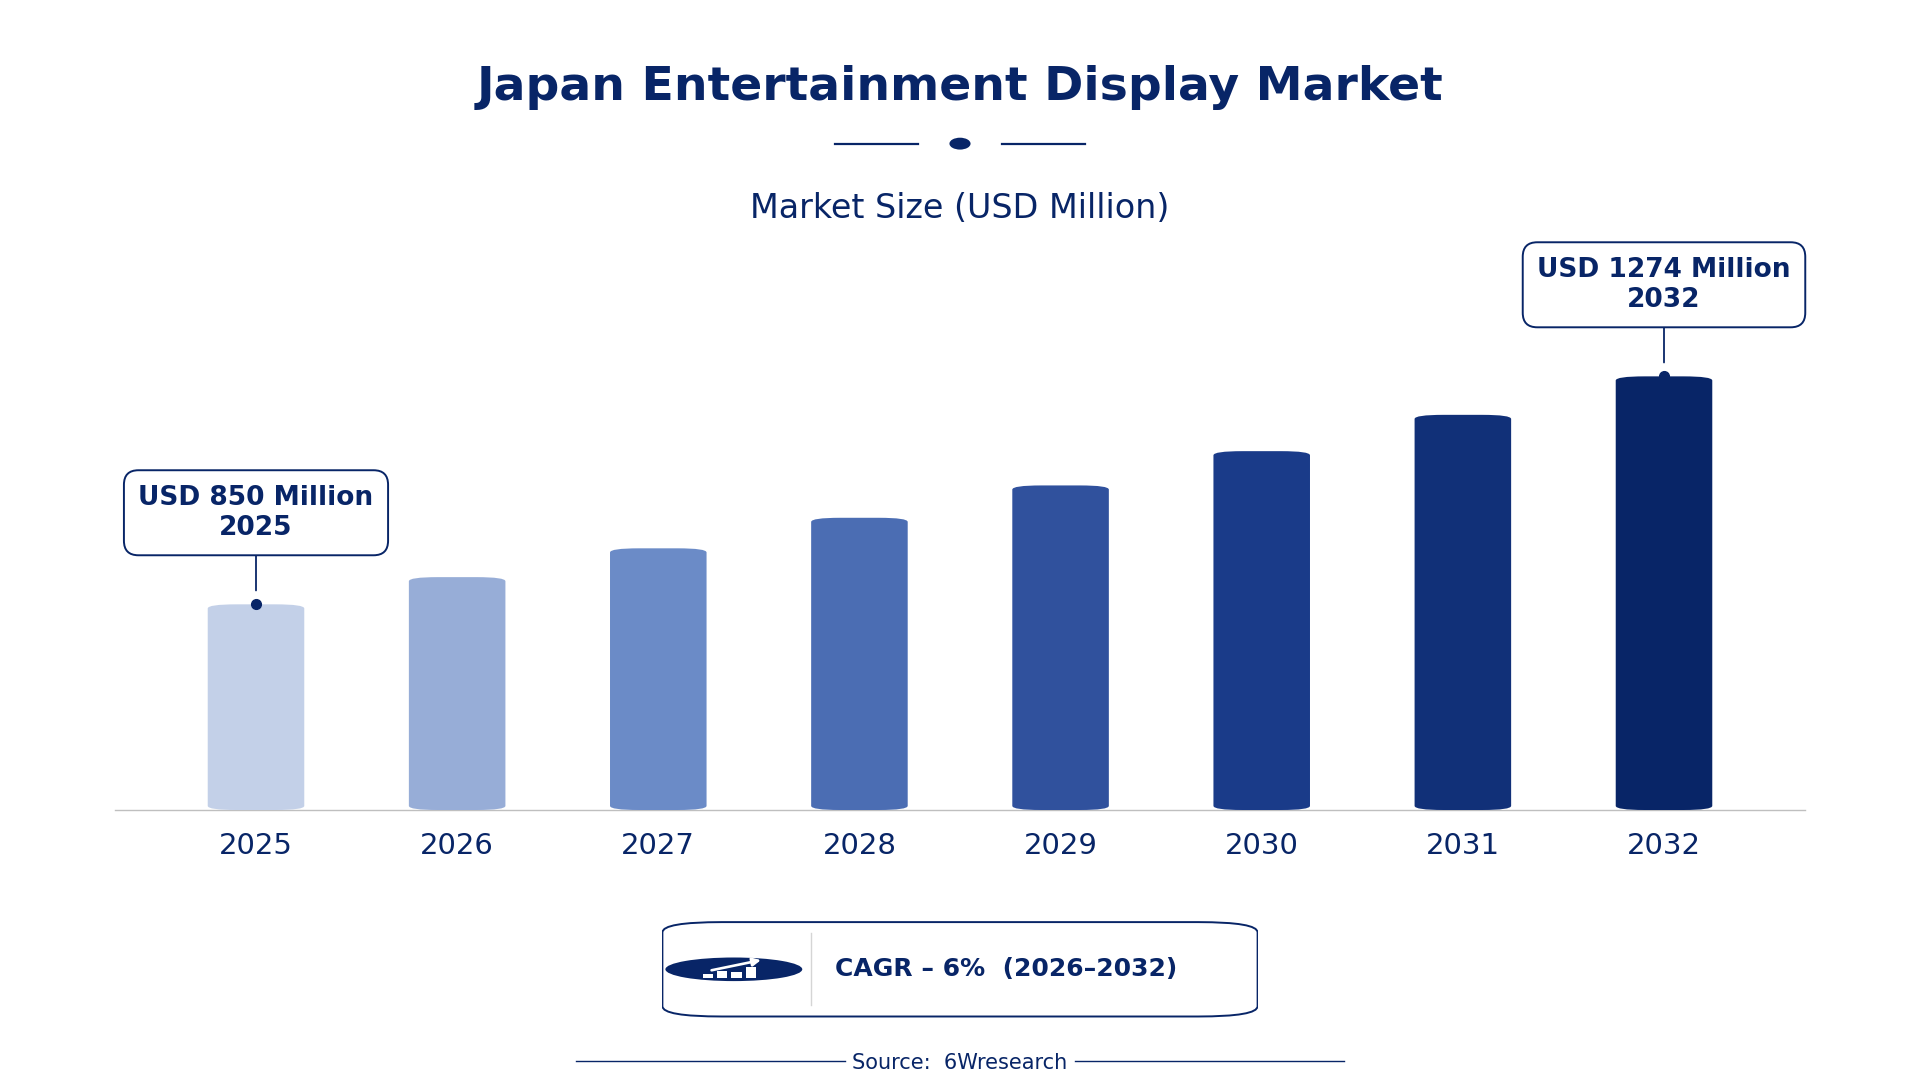
According to 6Wresearch internal database and industry insights, the Japan Entertainment Display Market was valued at USD 850 Million in 2025 and is projected to reach USD 1,274 Million by 2032, growing at a CAGR of approximately 6% during 2026–2032.
Japan Entertainment Display Market Highlights
| Report Metric | Details |
| Report Name | Japan Entertainment Display Market (2026-2032) |
| Market Size 2025 | USD 850 Million |
| Market Size 2032 | USD 1,274 Million |
| Absolute Growth 2025–2032 | USD 424 Million |
| CAGR 2026–2032 | 6% |
| Peak Annual Growth | 7.0% in 2029 |
| Forecast Period | 2026–2032 |
| Historical Data | 2022–2025 |
| Base Year | 2025 |
| Leading Display Type, 2025 | LED Displays (41% share) |
| Leading Technology, 2025 | LCD/LED (50% share) |
| Leading Distribution Channel, 2025 | Retail Stores (42% share) |
| Leading End User, 2025 | Cinemas (40% share) |
| Fastest-Growing Display Type | Interactive Displays (8.2% CAGR) |
| Fastest-Growing Technology | OLED/AMOLED (8.6% CAGR) |
| Fastest-Growing Distribution Channel | Online Platforms (7.6% CAGR) |
| Fastest-Growing End User | VR Gaming Centers (7.5% CAGR) |
| Growing Sector | Retail Entertainment |
| Key End Users | Cinemas, Theme Parks, VR Gaming Centers, Retail Venues |
Japan Entertainment Display Market Year-wise Growth Rate and Key Drivers (2022–2032)
This graph illustrates the annual growth rates of the market from 2022 to 2032, highlighting a steady upward trajectory and projected market expansion over the forecast period.
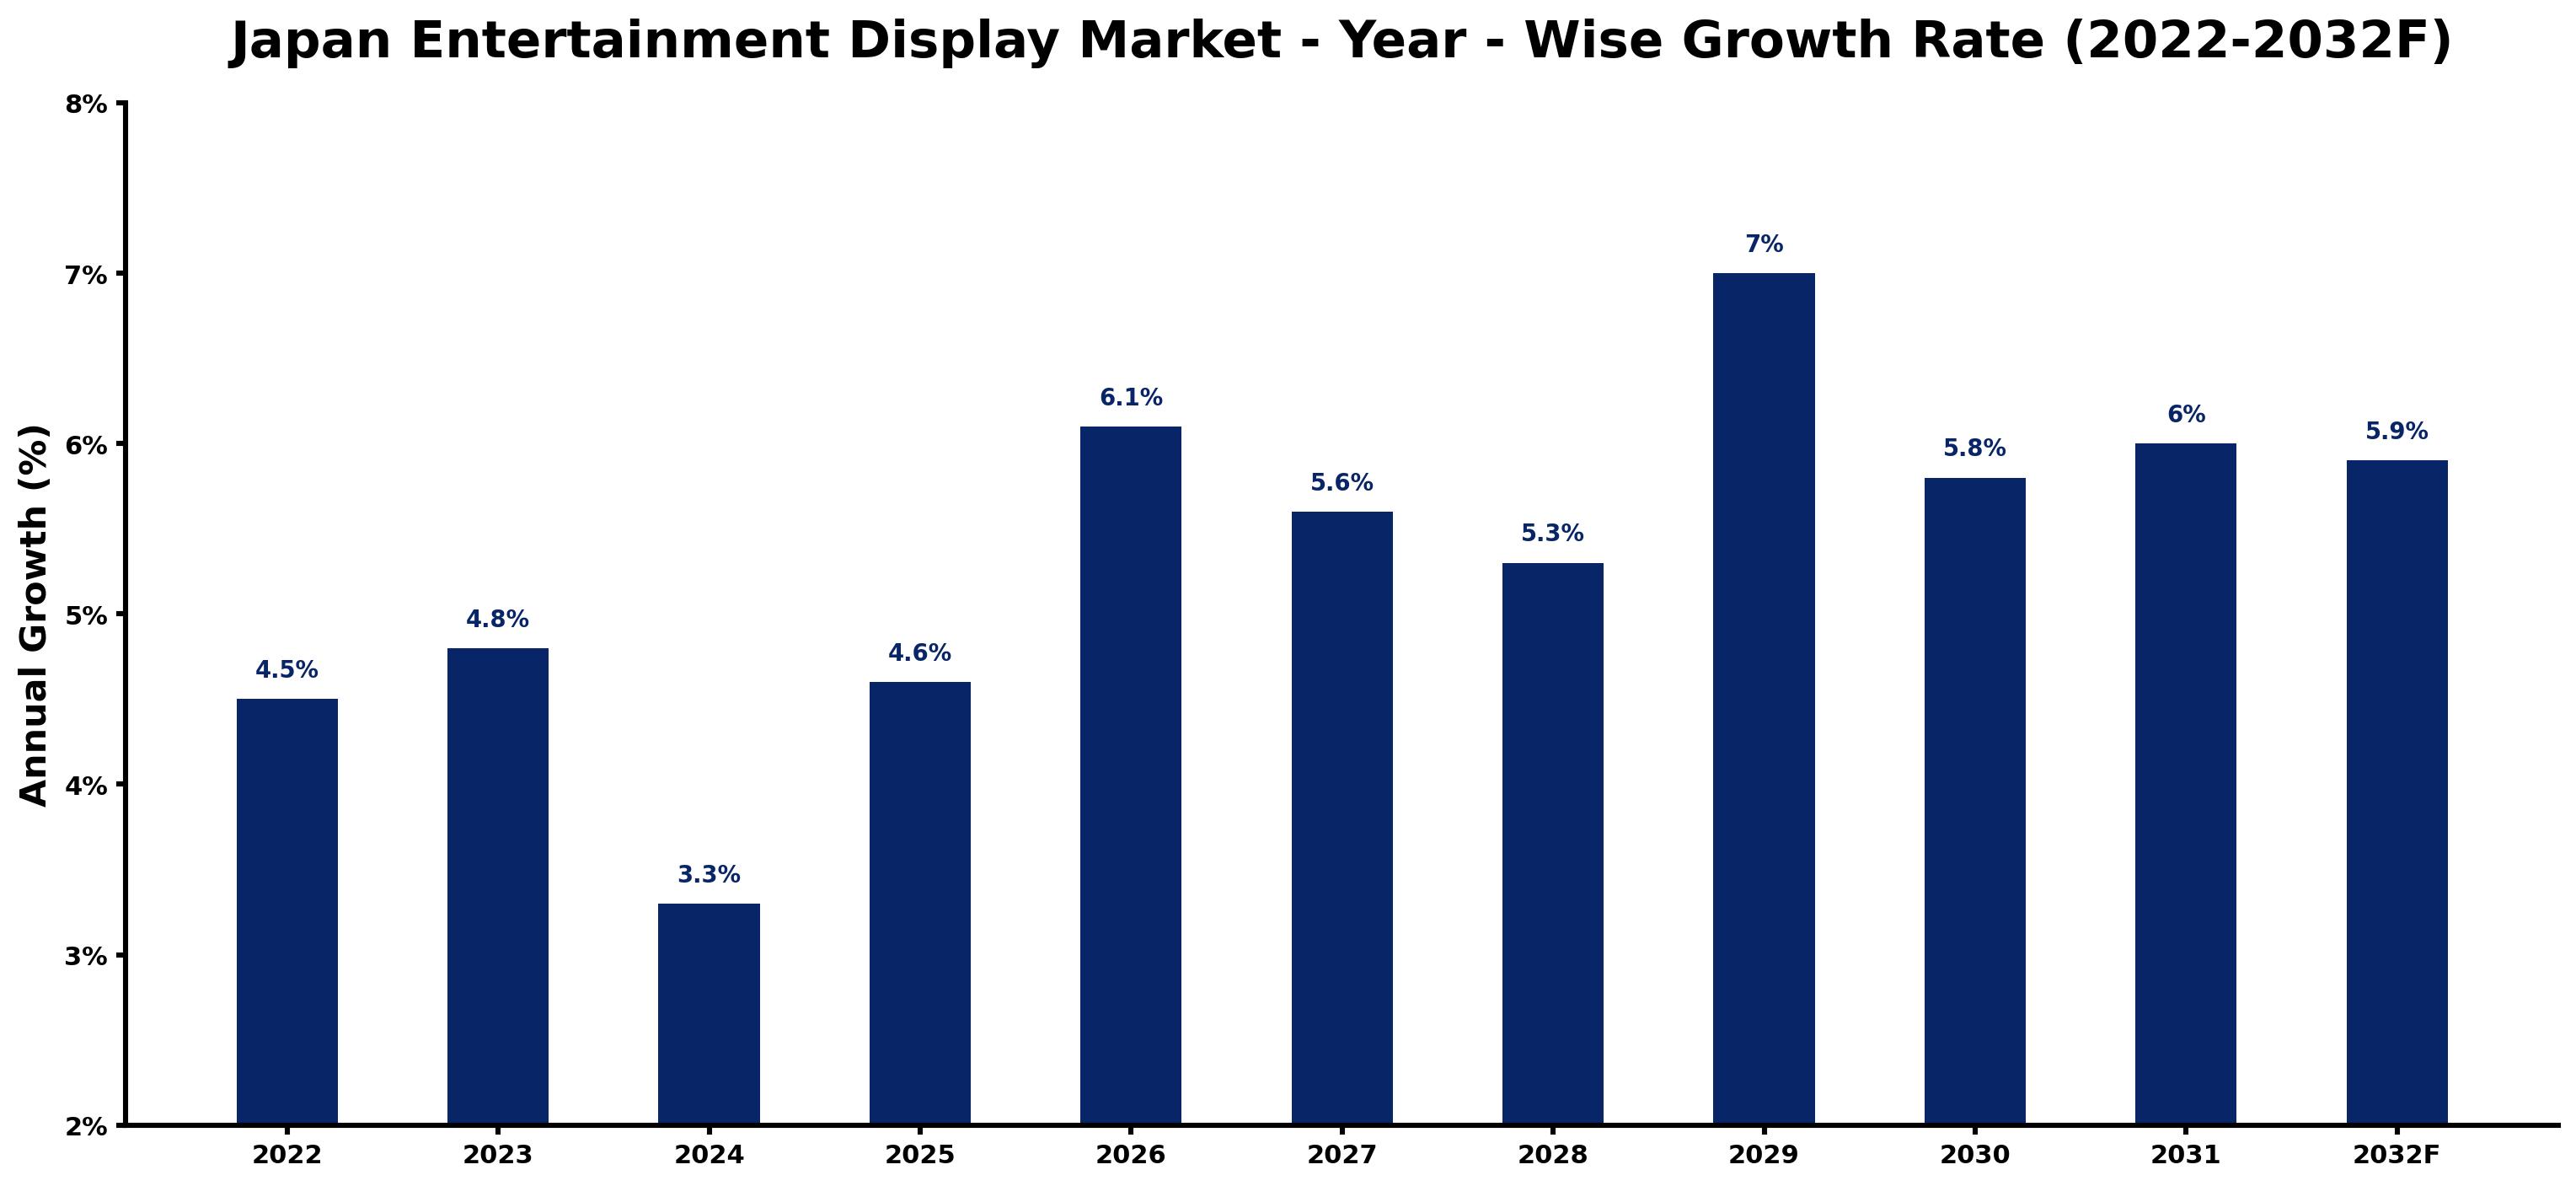
Year by year, the estimates below pair each growth rate with the development that shaped it.
| Year | Estimated Annual Growth (%) | Market Rationale |
| 2022 | 4.5 | The market showed solid growth, supported by increased investments in entertainment infrastructure. |
| 2023 | 4.8 | Demand accelerated as the number of cinemas reached 3,800, boosting sales of projection screens. |
| 2024 | 3.3 | Growth slowed as the market adjusted to previous high levels of expansion. |
| 2025 | 4.6 | The market rebounded with stronger demand from retail entertainment venues and theme parks. |
| 2026 | 6.1 | Growth is expected to surge as OLED display adoption in cinemas increases, enhancing visual experiences. |
| 2027 | 5.6 | A slight slowdown is projected as the market stabilises after rapid growth in the previous year. |
| 2028 | 5.3 | The market will continue to grow, albeit at a slower pace as demand normalises. |
| 2029 | 7.0 | Demand is expected to peak as display technologies gain traction in various venues. |
| 2030 | 5.8 | Growth is projected to decelerate slightly as the market faces saturation in key segments. |
| 2031 | 6.0 | The market will rebound with renewed interest in advanced display technologies. |
| 2032 | 5.9 | Growth is expected to moderate as the market stabilises after a decade of rapid expansion. |
Note: Market size estimations and growth projections presented in this report are based on 6Wresearch's proprietary forecasting methodology, utilizing the latest available industry data, government publications, and primary research inputs.
Japan Entertainment Display Market Synopsis
Entertainment displays encompass various technologies such as LED screens and projection systems, primarily utilised in cinemas, theme parks, and retail environments. The Japan Entertainment Display Market is experiencing growth driven by increasing demand from domestic users, investments in entertainment infrastructure, and the rising adoption of advanced display technologies. The Tokyo region accounts for over 40% of national demand, underscoring consumer interest and investment concentration in this sector.
Market Dynamics Impact Analysis (2026–2032)
| Factor | Type | Impact | Primary Segment Affected |
| Rising adoption of OLED displays in cinemas | Driver | High | OLED/AMOLED |
| Increasing installations of interactive displays in theme parks | Driver | High | Interactive Displays |
| Expansion of retail entertainment venues | Opportunity | High | Retail Entertainment |
| Growing interest in VR gaming centers | Opportunity | Medium | VR Gaming Centers |
| High competition among display technology providers | Restraint | Medium | LCD/LED |
| Challenges in sourcing advanced components for production | Restraint | High | Projection Screens |
| Technological advancements requiring constant updates | Challenge | High | Interactive Displays |
| High costs associated with advanced display installations | Challenge | Medium | OLED/AMOLED |
Evaluation of Drivers in Japan Entertainment Display Market (2026–2032)
Below are the drivers that matter most for revenue growth, with supporting evidence.
| Drivers | Primary Segment Affected | Why It Matters (Evidence) |
| Increased demand for high-quality visuals | OLED/AMOLED | The adoption rate of OLED displays in cinemas is around 25%, prompting cinemas to upgrade their technology. |
| Growing installations of interactive displays | Interactive Displays | Over 200 theme parks across Japan are increasingly using interactive displays to engage visitors. |
| Expansion of retail entertainment venues | Retail Entertainment | Retail entertainment venues have seen a 30% increase in display installations since 2020, showcasing products effectively. |
| Rising demand for immersive experiences in gaming | VR Gaming Centers | The Tokyo Game Show 2023 featured over 100 interactive display setups for VR gaming, driving demand. |
| Increased focus on digital transformation in entertainment | Projection Screens | Support for advanced display technologies is leading to higher investments in projection systems. |
The strongest pull on demand comes from the growing installations of interactive displays, with numerous theme parks adopting these technologies to engage visitors. The adoption of OLED displays in cinemas is around 25%, prompting venues to upgrade for better visual quality. Retail entertainment venues have seen a notable increase in display installations since 2020, allowing them to showcase products more effectively. The Tokyo Game Show 2023 featured over 100 interactive setups for VR gaming, boosting demand in this sector.
Evaluation of Restraints in Japan Entertainment Display Market
Several factors work against faster growth; the main ones are summarised below.
| Market Restraint | Primary Segment Affected | Why It Matters (Evidence) |
| High competition among display technology providers | LCD/LED | Intense competition leads to price wars, impacting profit margins for manufacturers in the LCD/LED segment. |
| Challenges in sourcing advanced components for production | Projection Screens | Supply chain disruptions have made it difficult for manufacturers to obtain necessary components, delaying production. |
| Technological advancements requiring constant updates | Interactive Displays | Rapid technological changes necessitate frequent upgrades, increasing costs for producers and buyers alike. |
| High costs associated with advanced display installations | OLED/AMOLED | The premium pricing of OLED technology limits its adoption among smaller venues and operators. |
| Regulatory compliance burdens for new technologies | Projection Screens | Compliance with the JIS X 0120 standard adds complexity and cost to the introduction of new display products. |
Japan Entertainment Display Market Challenges
A major challenge is the shortage of skilled technicians in advanced display technologies, which results from insufficient training programmes and can delay project timelines for producers by up to six months. Buyers are facing rising costs as demand outstrips supply, particularly in the Tokyo region, which accounts for over 40% of national demand. Technology adoption is slow, with only 25% of cinemas utilising OLED displays, limiting options for buyers and stifling innovation. Increasing raw material costs are further straining budgets, forcing clinics to delay upgrades and adversely impacting service delivery.
Trends in the Japan Entertainment Display Market
Four trends stand out in the Japan Entertainment Display Market.
- Shift from Traditional to Interactive Displays: Since 2021, theme parks have increasingly adopted interactive displays to engage visitors, with over 200 parks implementing these technologies. This shift improves customer experiences and drives demand for new display solutions.
- Transition to OLED Technology in Cinemas: The adoption of OLED displays in cinemas began to rise significantly in 2023, with around 25% of cinemas upgrading their systems. This trend reflects a growing preference for high-quality visuals among audiences.
- Emergence of VR Gaming Centers: The rise of VR gaming centers has transformed entertainment venues since 2023, with over 100 interactive setups showcased at the Tokyo Game Show. This trend indicates a shift towards immersive gaming experiences.
- Prioritisation of Retail Entertainment: Retail entertainment venues have prioritised display installations since 2020, resulting in a 30% increase in installations. This trend highlights the importance of engaging customers through visual displays.
Investment Opportunities in the Japan Entertainment Display Market
Below are the investment opportunities with the strongest case in the Japan Entertainment Display Market.
- Investment in Advanced Display Technologies: With the Japanese government allocating 5 billion yen to promote advanced display technologies, suppliers have an opportunity to invest in new products and solutions.
- Expansion of Retail Entertainment Venues: Retail entertainment venues are increasingly adopting advanced displays, presenting suppliers with the chance to provide new technologies that enhance customer experiences.
- Growth in VR Gaming Centers: The rise of VR gaming centers generates demand for immersive display technologies, allowing suppliers to effectively target this expanding market segment.
- Collaboration with Theme Parks: Now presents an ideal opportunity to partner with theme parks for supplying interactive displays, as many parks are investing in engaging technologies to attract visitors.
Government Initiatives in the Japan Entertainment Display Market
The Industrial Standardization Act, established in 1949 and amended in 2019, governs product and test standards for display technologies in Japan. This law ensures that manufacturers adhere to quality standards, promoting consumer safety and trust in entertainment displays. The Digital Agency, established in 2021, supports digital transformation initiatives that further improve the quality and accessibility of display technologies in the entertainment sector.
In 2023, the Ministry of Economy, Trade and Industry allocated 5 billion yen to promote advanced display technologies. The Digital Agency oversees these initiatives, funding projects that aim to improve the quality of entertainment displays. This funding supports innovation and encourages manufacturers to adopt new technologies, ultimately benefiting consumers.
Future Insight of the Japan Entertainment Display Market
Buyers in retail entertainment venues can expect a substantial increase in advanced display installations by 2032, driven by government support for digital transformation. The adoption of the JIS X 0120 standard will raise display quality, providing buyers with more reliable options. With 5 billion yen designated for advancing display technologies, suppliers can anticipate improved production capabilities. The prevalence of interactive displays in theme parks will expand, with over 200 parks already integrating these technologies, creating new engagement opportunities.
Market Segmentation Analysis
Japan Entertainment Display Market report covers a detailed analysis of the following market segments:
By Display Type – LED Displays Lead, Interactive Displays Expected to Grow Fastest
According to Saurav Kr Singh, Senior Research Analyst at 6Wresearch, LED Displays took 41% of display type revenue in 2025, more than any other category. LED displays dominate the market due to their extensive application in entertainment venues, such as cinemas and retail spaces. Their capacity to provide vibrant visuals meets the needs of the substantial demand concentrated in the Tokyo region. Over 2026–2032, Interactive Displays are expected to post the fastest growth, at a CAGR of 8.2%. The rapid adoption of interactive displays in over 200 theme parks is propelling their growth. This trend showcases a shift towards immersive experiences that significantly enhance visitor engagement. Suppliers should focus on developing interactive display technologies to meet the increasing demand in the entertainment sector.
By Technology – LCD/LED Leads, OLED/AMOLED Expected to Grow Fastest
LCD/LED accounted for 50% of the market by technology in 2025. LCD/LED technology commands the largest market share as it serves as the foundational technology for many display applications. Its extensive use in cinemas and retail ensures a solid installed base and consistent demand. OLED/AMOLED is projected to grow fastest, at a CAGR of 8.6% during 2026–2032. OLED/AMOLED technology is experiencing rapid growth due to its preference for high-quality visuals in premium display setups. The current adoption rate of 25% in cinemas indicates a shift towards superior display technologies. Buyers should evaluate the potential benefits of upgrading to OLED/AMOLED displays to maintain a competitive edge in the premium market.
By Distribution Channel – Retail Stores Lead, Online Platforms Expected to Grow Fastest
In 2025, Retail Stores led the distribution channel split with a 42% share. Retail stores serve as the primary distribution channel, offering vital platforms for displaying products directly to consumers. Their physical presence enables customers to interact with displays, influencing purchase decisions effectively. Online Platforms are set to record the highest CAGR in this split, 7.6% over 2026–2032. Online platforms are experiencing notable growth, reflecting the rising consumer inclination towards convenient shopping options. This shift indicates a change in purchasing habits, especially among younger demographics. Suppliers must enhance their online sales strategies to effectively engage the growing number of consumers who prefer digital purchasing.
By End User – Cinemas Lead, VR Gaming Centers Expected to Grow Fastest
Cinemas held 40% of the Japan Entertainment Display Market by end user in 2025. Cinemas are the largest end user segment for entertainment displays, constituting a significant portion of the market. With around 3,800 cinemas in Japan, they generate considerable demand for large-scale display technologies. The quickest growth will come from VR Gaming Centers, forecast to expand at a CAGR of 7.5% between 2026 and 2032. VR gaming centers are witnessing the fastest growth, relying heavily on advanced display technologies to provide immersive gaming experiences. Events like the Tokyo Game Show, featuring over 100 interactive setups, underscore this trend. Investments in advanced display technologies for VR gaming will be crucial for suppliers aiming to penetrate this rapidly expanding market.
Key Attractiveness of the Report
- 10 Years of Market Numbers
- Historical Data Starting from 2022 to 2025
- Base Year 2025
- Forecast Data until 2032
- Key Performance Indicators Impacting the Market
- Major Upcoming Developments and Projects
Key Highlights of the Report:
- Japan Entertainment Display Market Outlook
- Market Size of Japan Entertainment Display Market, 2025
- Forecast of Japan Entertainment Display Market, 2032
- Historical Data and Forecast of Japan Entertainment Display Revenues & Volume for the Period 2022-2032F
- Japan Entertainment Display Market Trend Evolution
- Japan Entertainment Display Market Drivers and Challenges
- Japan Entertainment Display Price Trends
- Japan Entertainment Display Porter's Five Forces
- Japan Entertainment Display Industry Life Cycle
- Historical Data and Forecast of Japan Entertainment Display Market Revenues & Volume By Display Type for the Period 2022-2032F
- Historical Data and Forecast of Japan Entertainment Display Market Revenues & Volume By LED Displays for the Period 2022-2032F
- Historical Data and Forecast of Japan Entertainment Display Market Revenues & Volume By Projection Screens for the Period 2022-2032F
- Historical Data and Forecast of Japan Entertainment Display Market Revenues & Volume By Interactive Displays for the Period 2022-2032F
- Historical Data and Forecast of Japan Entertainment Display Market Revenues & Volume By Transparent Displays for the Period 2022-2032F
- Historical Data and Forecast of Japan Entertainment Display Market Revenues & Volume By Technology for the Period 2022-2032F
- Historical Data and Forecast of Japan Entertainment Display Market Revenues & Volume By OLED/AMOLED for the Period 2022-2032F
- Historical Data and Forecast of Japan Entertainment Display Market Revenues & Volume By Laser/HD for the Period 2022-2032F
- Historical Data and Forecast of Japan Entertainment Display Market Revenues & Volume By Touchscreen for the Period 2022-2032F
- Historical Data and Forecast of Japan Entertainment Display Market Revenues & Volume By LCD/LED for the Period 2022-2032F
- Historical Data and Forecast of Japan Entertainment Display Market Revenues & Volume By Distribution Channel for the Period 2022-2032F
- Historical Data and Forecast of Japan Entertainment Display Market Revenues & Volume By Retail Stores for the Period 2022-2032F
- Historical Data and Forecast of Japan Entertainment Display Market Revenues & Volume By Online Platforms for the Period 2022-2032F
- Historical Data and Forecast of Japan Entertainment Display Market Revenues & Volume By Direct Sales for the Period 2022-2032F
- Historical Data and Forecast of Japan Entertainment Display Market Revenues & Volume By Distributors for the Period 2022-2032F
- Historical Data and Forecast of Japan Entertainment Display Market Revenues & Volume By End User for the Period 2022-2032F
- Historical Data and Forecast of Japan Entertainment Display Market Revenues & Volume By Theme Parks for the Period 2022-2032F
- Historical Data and Forecast of Japan Entertainment Display Market Revenues & Volume By Cinemas for the Period 2022-2032F
- Historical Data and Forecast of Japan Entertainment Display Market Revenues & Volume By VR Gaming Centers for the Period 2022-2032F
- Historical Data and Forecast of Japan Entertainment Display Market Revenues & Volume By Retail Entertainment for the Period 2022-2032F
- Japan Entertainment Display Import Export Trade Statistics
- Market Opportunity Assessment By Display Type
- Market Opportunity Assessment By Technology
- Market Opportunity Assessment By Distribution Channel
- Market Opportunity Assessment By End User
- Japan Entertainment Display Top Companies Market Share
- Japan Entertainment Display Competitive Benchmarking By Technical and Operational Parameters
- Japan Entertainment Display Company Profiles
- Japan Entertainment Display Key Strategic Recommendations
Market Covered
Coverage by segment is as follows.
By Display Type
- LED Displays
- Projection Screens
- Interactive Displays
- Transparent Displays
By Technology
- OLED/AMOLED
- Laser/HD
- Touchscreen
- LCD/LED
By Distribution Channel
- Retail Stores
- Online Platforms
- Direct Sales
- Distributors
By End User
- Theme Parks
- Cinemas
- VR Gaming Centers
- Retail Entertainment