Japan Fish Processing Market (2026-2032) | Forecast, Size, Revenue, Value, Companies, Outlook, Analysis, Trends, Industry, Share & Growth
Market Forecast By Source (Marine, Inland, Freshwater), By Application (Food, Feed, Biomedical, Others), By Processing (Frozen, Preserved, Others), By Equipment (Gutting, Scaling, Filleting, Deboning, Skinning, Curing & Smoking, Others) And Competitive Landscape
| Product Code: ETC042602 | Publication Date: Jan 2021 | Updated Date: Jun 2026 | Product Type: Report | |
| Publisher: 6Wresearch | Author: Ravi Bhandari | No. of Pages: 70 | No. of Figures: 35 | No. of Tables: 5 |
Japan Fish Processing Market Summary
The japan fish processing market was estimated at USD 172 Million in 2025 and is projected to reach USD 184 Million by 2032, growing at a CAGR of 1.8% from 2026 to 2032.
Japan Fish Processing Market Growth Rate Analysis (2021-2032)
The fish processing market in Japan experienced notable fluctuations in its growth rates over the past few years, reflecting a complex interplay of consumer demands and technological advancements. After a decline of 2.3% in 2021, the market rebounded with a robust increase of 4.2% in 2022, driven by rising health consciousness among consumers and a shift towards processed seafood. This growth trend continued, albeit at a moderated pace, with growth rates stabilizing at 2.0% in 2023 and 1.4% in 2024. Factors such as investments in digital technologies and improved supply chain infrastructure have contributed to enhancing operational efficiency, which is essential for managing costs amidst evolving market dynamics. By 2029, the market is projected to witness slight rebounds, suggesting gradual stabilization as consumer preferences continue to adapt.
Japan Fish Processing Market Year-wise Growth Rate and Key Drivers
This graph highlights how the Japan Fish Processing Market has steadily grown over the past five years, supported by major growth factors.
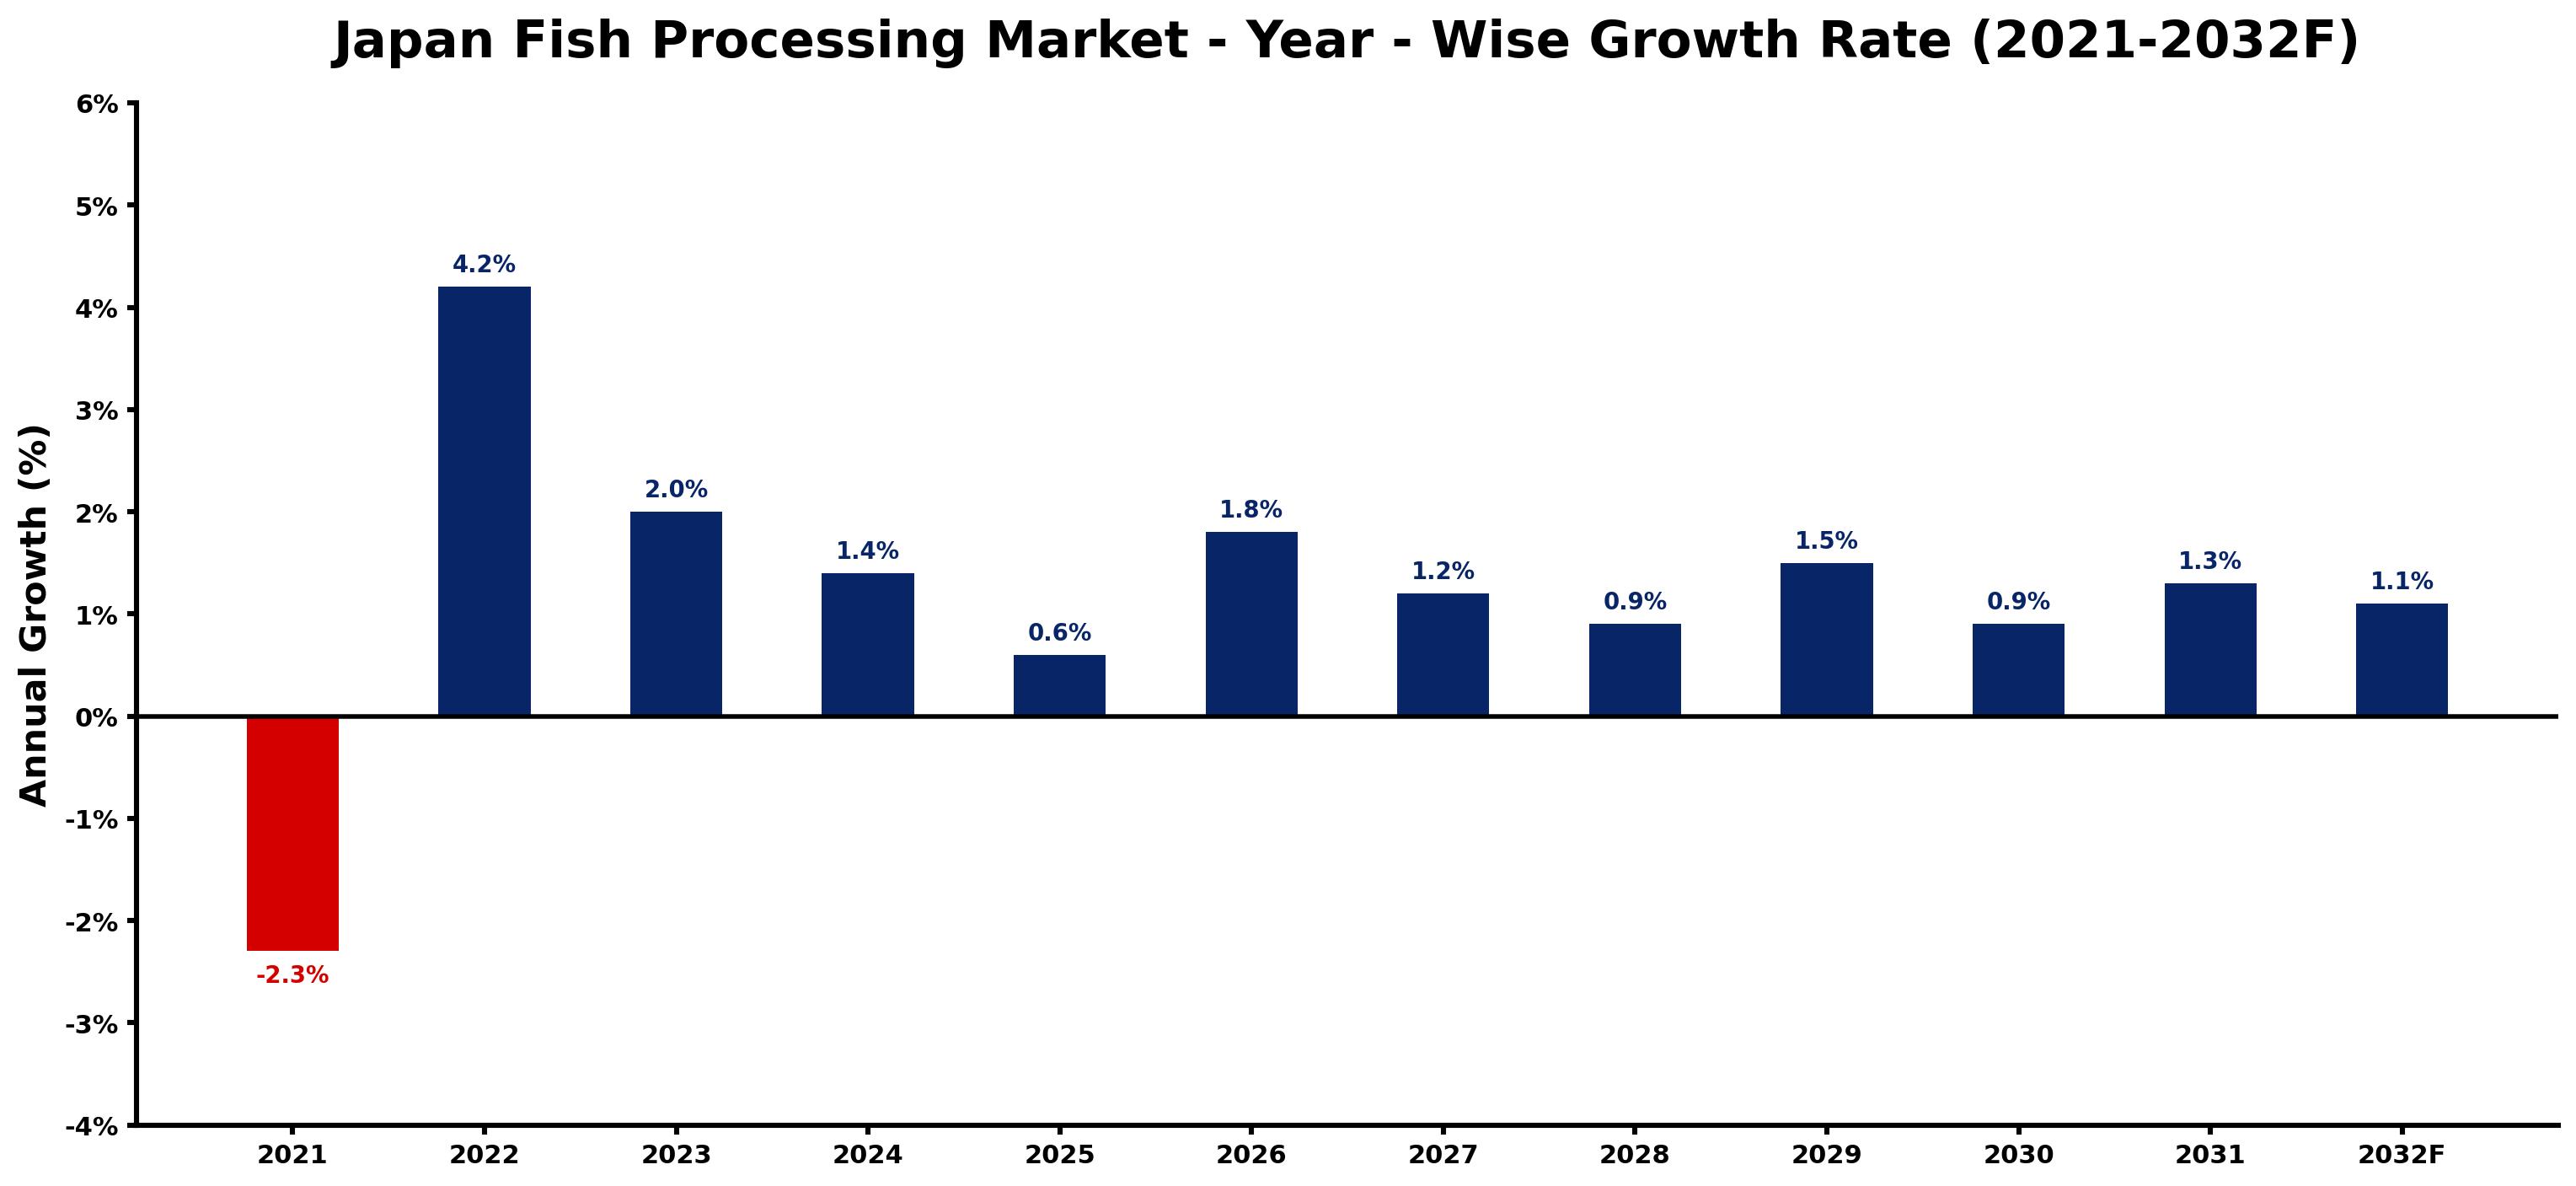
The table below presents the year wise growth rates along with the key drivers influencing the market
| Year | Growth Rate | Major Drivers |
| 2021 | -2.3% | Decreased export demand and stricter regulations hindered production capacity in the fish processing sector. |
| 2022 | 4.2% | Sustainability concerns prompted fish processors to adopt eco-friendly packaging solutions. |
| 2023 | 2.0% | Consumer interest in healthy diets drove demand for nutritious fish-based products. |
| 2024 | 1.4% | Technological innovations enhanced processing efficiency and reduced waste in fish production. |
| 2025 | 0.6% | Increased global seafood trade influenced competitive pricing strategies among local processors. |
| 2026 | 1.8% | E-commerce platforms expanded market reach, allowing small processors to thrive online. |
| 2027 | 1.2% | Cultural shifts towards premium seafood options spurred local artisan fish processing growth. |
| 2028 | 0.9% | Investment in cold chain logistics improved product quality and extended shelf life. |
| 2029 | 1.5% | Collaborations between retailers and processors focused on sustainable sourcing initiatives. |
| 2030 | 0.9% | Emerging trends in plant-based seafood alternatives reshaped consumer preferences significantly. |
| 2031 | 1.3% | Rural development programs supported small-scale fisheries, enhancing local processing capabilities. |
| 2032 | 1.1% | Strategic partnerships with international brands strengthened Japan's global market position. |
Note - Market size estimations and growth projections presented in this report are based on 6Wresearch's advanced forecasting approach, validated with industry datasets as of June 2026.
Japan Fish Processing Market Synopsis
The Japan Fish Processing Market is projected to reach 1.8% and witness significant growth during the forecast period (2026-2032). This sector is characterized by a mature framework, with a strong emphasis on premium fish products that are deeply embedded in the country's culinary tradition. The high seafood consumption rate in Japan is complemented by a rising consumer preference for convenience and sustainability, driving innovation and development within the market.
Japan Fish Processing Market Growth Drivers
Several factors are contributing to the growth of the Japan Fish Processing Market. An increasing appetite for seafood among Japanese consumers is a primary catalyst, as more individuals seek out fresh and processed fish products. Additionally, the trend towards convenience food is prompting a higher demand for value-added seafood products, such as ready-to-eat meals and pre-packaged options. Furthermore, sustainability has emerged as a significant driver, with consumers increasingly favoring products that align with eco-friendly practices.
- Enhanced focus on food safety and quality, which boosts consumer trust and market growth.
- Technological advancements in processing methods that improve product quality and reduce waste.
- A growing preference for local sourcing of seafood, supporting domestic fish processing industries.
- Increased health consciousness among consumers, driving demand for omega-3-rich processed fish products.
- Government initiatives promoting responsible fishing practices, positively influencing consumer perceptions.
Japan Fish Processing Market Trends and Opportunities
The Japan Fish Processing Market is witnessing notable trends that present opportunities for growth. An observable shift towards value-added fish products aligns with changing consumer lifestyles, as busy individuals lean towards convenient meal solutions. The rising awareness of sustainability is also fostering an increase in certifications for responsible fishing methods, pushing companies to adapt their strategies accordingly. Additionally, technological innovations are facilitating automation in processing, enhancing efficiency and product quality.
- Emergence of plant-based substitutes and seafood alternatives, catering to a diverse consumer base.
- Integration of smart technology in processing facilities for improved operational efficiency.
- Growing emphasis on traceability and transparency in sourcing practices, appealing to conscientious consumers.
- Development of localized flavors and formats that resonate with both traditional and contemporary culinary preferences.
- Increased collaborative efforts among companies to innovate and share best practices within the industry.
Japan Fish Processing Market Challenges and Restraints
Despite its many advantages, the Japan Fish Processing Market faces several challenges. Sustainability concerns, particularly regarding overfishing and environmental degradation, are at the forefront. There's an inherent need for the industry to adapt to responsible fishing practices. Furthermore, the competitive landscape demands continuous innovation to satisfy evolving consumer preferences, especially those seeking healthier and more convenient options.
- Regulatory complexities regarding seafood safety and environmental standards that require constant compliance efforts.
- Fluctuating raw material costs that pose risks to pricing strategies and profitability.
- Intensifying competition from global seafood markets, particularly from producers in neighboring regions.
- Risk of supply chain disruptions due to environmental factors, affecting raw fish availability.
- The necessity for strategic investments in research and development to foster innovation and maintain market relevance.
Japan Fish Processing Market Investment Opportunities
Investing in the Japan Fish Processing Market offers substantial opportunities, driven by the country's strong seafood consumption culture. Areas ripe for investment include the modernization of processing facilities to enhance operational efficiency and sustainability practices. With growing consumer preferences leaning towards eco-friendly products, companies can benefit from integrating innovative technologies that align with these demands. Moreover, exploring international markets by producing high-quality processed fish products holds considerable potential for expansion.
- Investment in research to develop new processing techniques that can enhance product quality and shelf life.
- Strategic partnerships to amplify market reach and share resources for technological advancements.
- Exploration of niche markets, including premium and organic seafood products that cater to health-conscious consumers.
- Modernization of supply chains to improve efficiency and reduce costs through technological integration.
- Engagement in marketing initiatives to promote Japanese seafood products in global markets, enhancing export opportunities.
Japan Fish Processing Market Government Investment and Initiatives
The Japanese government has adopted various initiatives aimed at supporting the fish processing market. Regulatory frameworks focused on food safety, quality standards, and sustainability practices serve to protect consumers and uphold Japan's seafood reputation internationally. Furthermore, government support encompasses subsidies and programs designed to foster innovation and technology adoption within the industry. Efforts are underway to promote market diversification, including initiatives that encourage exports of high-quality Japanese fish products. Overall, these policies strive to balance economic growth with environmental sustainability, ensuring the long-term viability of the fish processing sector.
Japan Fish Processing Market Latest Developments (May 2025 - June 2026)
In recent months, the Japan Fish Processing Market has seen a notable shift towards innovative processing technologies that enhance efficiency and quality. Many companies are increasingly prioritizing sustainable practices, adopting environmentally friendly processing methods. Additionally, consumer preferences are driving the development of new product lines that cater to convenience and health consciousness. There has also been a rise in initiatives to boost exports, aiming to showcase the premium quality of Japanese seafood products in global markets. These trends reflect the industry's ongoing adaptation to a dynamic consumer landscape.
Japan Fish Processing Market - Key Attractiveness of the Report
- 10 Years of Market Numbers
- Historical Data Starting from 2022 to 2025
- Base Year: 2025
- Forecast Data until 2032
- Key Performance Indicators Impacting the Market
- Major Upcoming Developments and Projects
Key Highlights of the Report:
- Japan Fish Processing Market Outlook
- Market Size of Japan Fish Processing Market, 2025
- Forecast of Japan Fish Processing Market, 2032F
- Historical Data and Forecast of Japan Fish Processing Revenues & Volume for the Period 2022-2032F
- Japan Fish Processing Market Trend Evolution
- Japan Fish Processing Market Drivers and Challenges
- Japan Fish Processing Price Trends
- Japan Fish Processing Porter's Five Forces
- Japan Fish Processing Industry Life Cycle
- Historical Data and Forecast of Japan Fish Processing Market Revenues & Volume By Source for the Period 2022-2032F
- Historical Data and Forecast of Japan Fish Processing Market Revenues & Volume By Marine for the Period 2022-2032F
- Historical Data and Forecast of Japan Fish Processing Market Revenues & Volume By Inland for the Period 2022-2032F
- Historical Data and Forecast of Japan Fish Processing Market Revenues & Volume By Freshwater for the Period 2022-2032F
- Historical Data and Forecast of Japan Fish Processing Market Revenues & Volume By Application for the Period 2022-2032F
- Historical Data and Forecast of Japan Fish Processing Market Revenues & Volume By Food for the Period 2022-2032F
- Historical Data and Forecast of Japan Fish Processing Market Revenues & Volume By Feed for the Period 2022-2032F
- Historical Data and Forecast of Japan Fish Processing Market Revenues & Volume By Biomedical for the Period 2022-2032F
- Historical Data and Forecast of Japan Fish Processing Market Revenues & Volume By Others for the Period 2022-2032F
- Historical Data and Forecast of Japan Fish Processing Market Revenues & Volume By Processing for the Period 2022-2032F
- Historical Data and Forecast of Japan Fish Processing Market Revenues & Volume By Frozen for the Period 2022-2032F
- Historical Data and Forecast of Japan Fish Processing Market Revenues & Volume By Preserved for the Period 2022-2032F
- Historical Data and Forecast of Japan Fish Processing Market Revenues & Volume By Others for the Period 2022-2032F
- Historical Data and Forecast of Japan Fish Processing Market Revenues & Volume By Equipment for the Period 2022-2032F
- Historical Data and Forecast of Japan Fish Processing Market Revenues & Volume By Gutting for the Period 2022-2032F
- Historical Data and Forecast of Japan Fish Processing Market Revenues & Volume By Scaling for the Period 2022-2032F
- Historical Data and Forecast of Japan Fish Processing Market Revenues & Volume By Filleting for the Period 2022-2032F
- Historical Data and Forecast of Japan Fish Processing Market Revenues & Volume By Deboning for the Period 2022-2032F
- Historical Data and Forecast of Japan Fish Processing Market Revenues & Volume By Skinning for the Period 2022-2032F
- Historical Data and Forecast of Japan Fish Processing Market Revenues & Volume By Curing & Smoking for the Period 2022-2032F
- Historical Data and Forecast of Japan Fish Processing Market Revenues & Volume By Others for the Period 2022-2032F
- Japan Fish Processing Import Export Trade Statistics
- Market Opportunity Assessment By Source
- Market Opportunity Assessment By Application
- Market Opportunity Assessment By Processing
- Market Opportunity Assessment By Equipment
- Japan Fish Processing Top Companies Market Share
- Japan Fish Processing Competitive Benchmarking By Technical and Operational Parameters
- Japan Fish Processing Company Profiles
- Japan Fish Processing Key Strategic Recommendations
Frequently Asked Questions About the Market Study (FAQs):
The growth is driven by increased demand for seafood, innovation in processing technology, and a rising emphasis on sustainability among consumers.
Key trends include the shift towards value-added seafood products, sustainability certifications, and advancements in processing techniques to improve efficiency.
The market faces challenges such as sustainability concerns, fluctuating raw material costs, and intense competition from both local and international producers.
Investment opportunities exist in modernizing processing facilities, enhancing sustainability practices, and expanding into international markets with premium seafood products.
6Wresearch actively monitors the Japan Fish Processing Market and publishes its comprehensive annual report, highlighting emerging trends, growth drivers, revenue analysis, and forecast outlook. Our insights help businesses to make data-backed strategic decisions with ongoing market dynamics. Our analysts track relevent industries related to the Japan Fish Processing Market, allowing our clients with actionable intelligence and reliable forecasts tailored to emerging regional needs.
Yes, we provide customisation as per your requirements. To learn more, feel free to contact us on sales@6wresearch.com
1 Executive Summary |
2 Introduction |
2.1 Key Highlights of the Report |
2.2 Report Description |
2.3 Market Scope & Segmentation |
2.4 Research Methodology |
2.5 Assumptions |
3 Japan Fish Processing Market Overview |
3.1 Japan Country Macro Economic Indicators |
3.2 Japan Fish Processing Market Revenues & Volume, 2022 & 2032F |
3.3 Japan Fish Processing Market - Industry Life Cycle |
3.4 Japan Fish Processing Market - Porter's Five Forces |
3.5 Japan Fish Processing Market Revenues & Volume Share, By Source, 2022 & 2032F |
3.6 Japan Fish Processing Market Revenues & Volume Share, By Application, 2022 & 2032F |
3.7 Japan Fish Processing Market Revenues & Volume Share, By Processing, 2022 & 2032F |
3.8 Japan Fish Processing Market Revenues & Volume Share, By Equipment, 2022 & 2032F |
4 Japan Fish Processing Market Dynamics |
4.1 Impact Analysis |
4.2 Market Drivers |
4.2.1 Increasing demand for processed fish products in Japan due to changing consumer preferences towards healthy and convenient food options |
4.2.2 Technological advancements in fish processing techniques leading to improved efficiency and quality of processed fish products |
4.2.3 Growth in the tourism industry in Japan boosting the demand for processed fish products among tourists |
4.3 Market Restraints |
4.3.1 Fluctuating raw material prices affecting the cost of production in the fish processing industry |
4.3.2 Stringent regulations and standards related to food safety and quality impacting the operations of fish processing companies |
4.3.3 Competition from substitute products and alternative protein sources in the Japanese market |
5 Japan Fish Processing Market Trends |
6 Japan Fish Processing Market, By Types |
6.1 Japan Fish Processing Market, By Source |
6.1.1 Overview and Analysis |
6.1.2 Japan Fish Processing Market Revenues & Volume, By Source, 2022-2032F |
6.1.3 Japan Fish Processing Market Revenues & Volume, By Marine, 2022-2032F |
6.1.4 Japan Fish Processing Market Revenues & Volume, By Inland, 2022-2032F |
6.1.5 Japan Fish Processing Market Revenues & Volume, By Freshwater, 2022-2032F |
6.2 Japan Fish Processing Market, By Application |
6.2.1 Overview and Analysis |
6.2.2 Japan Fish Processing Market Revenues & Volume, By Food, 2022-2032F |
6.2.3 Japan Fish Processing Market Revenues & Volume, By Feed, 2022-2032F |
6.2.4 Japan Fish Processing Market Revenues & Volume, By Biomedical, 2022-2032F |
6.2.5 Japan Fish Processing Market Revenues & Volume, By Others, 2022-2032F |
6.3 Japan Fish Processing Market, By Processing |
6.3.1 Overview and Analysis |
6.3.2 Japan Fish Processing Market Revenues & Volume, By Frozen, 2022-2032F |
6.3.3 Japan Fish Processing Market Revenues & Volume, By Preserved, 2022-2032F |
6.3.4 Japan Fish Processing Market Revenues & Volume, By Others, 2022-2032F |
6.4 Japan Fish Processing Market, By Equipment |
6.4.1 Overview and Analysis |
6.4.2 Japan Fish Processing Market Revenues & Volume, By Gutting, 2022-2032F |
6.4.3 Japan Fish Processing Market Revenues & Volume, By Scaling, 2022-2032F |
6.4.4 Japan Fish Processing Market Revenues & Volume, By Filleting, 2022-2032F |
6.4.5 Japan Fish Processing Market Revenues & Volume, By Deboning, 2022-2032F |
6.4.6 Japan Fish Processing Market Revenues & Volume, By Skinning, 2022-2032F |
6.4.7 Japan Fish Processing Market Revenues & Volume, By Curing & Smoking, 2022-2032F |
7 Japan Fish Processing Market Import-Export Trade Statistics |
7.1 Japan Fish Processing Market Export to Major Countries |
7.2 Japan Fish Processing Market Imports from Major Countries |
8 Japan Fish Processing Market Key Performance Indicators |
8.1 Sustainability metrics such as percentage of sustainably sourced fish used in processing operations |
8.2 Product innovation rate measured by the number of new processed fish products introduced to the market annually |
8.3 Customer satisfaction levels through surveys and feedback on the quality and variety of processed fish products offered |
9 Japan Fish Processing Market - Opportunity Assessment |
9.1 Japan Fish Processing Market Opportunity Assessment, By Source, 2022 & 2032F |
9.2 Japan Fish Processing Market Opportunity Assessment, By Application, 2022 & 2032F |
9.3 Japan Fish Processing Market Opportunity Assessment, By Processing, 2022 & 2032F |
9.4 Japan Fish Processing Market Opportunity Assessment, By Equipment, 2022 & 2032F |
10 Japan Fish Processing Market - Competitive Landscape |
10.1 Japan Fish Processing Market Revenue Share, By Companies, 2025 |
10.2 Japan Fish Processing Market Competitive Benchmarking, By Operating and Technical Parameters |
11 Company Profiles |
12 Recommendations |
13 Disclaimer |
Global Go To Market Strategy - 2030
Export potential enables firms to identify high-growth global markets with greater confidence by combining advanced trade intelligence with a structured quantitative methodology. The framework analyzes emerging demand trends and country-level import patterns while integrating macroeconomic and trade datasets such as GDP and population forecasts, bilateral import–export flows, tariff structures, elasticity differentials between developed and developing economies, geographic distance, and import demand projections. Using weighted trade values from 2020–2024 as the base period to project country-to-country export potential for 2030, these inputs are operationalized through calculated drivers such as gravity model parameters, tariff impact factors, and projected GDP per-capita growth. Through an analysis of hidden potentials, demand hotspots, and market conditions that are most favorable to success, this method enables firms to focus on target countries, maximize returns, and global expansion with data, backed by accuracy.
By factoring in the projected importer demand gap that is currently unmet and could be potential opportunity, it identifies the potential for the Exporter (Country) among 190 countries, against the general trade analysis, which identifies the biggest importer or exporter.
To discover high-growth global markets and optimize your business strategy:
Click Here
Pricing
- Single User License$ 1,995
- Department License$ 2,400
- Site License$ 3,120
- Global License$ 3,795

Leadership Perspectives from Industry Events
Search
Thought Leadership and Analyst Meet


Our Clients
6WResearch In News
- India Air Conditioner Market Set for Strong Rebound in 2026 After Weather-Led Correction and GST-Driven Recovery: 6Wresearch
- ADAS in India: How Automatic Emergency Braking, Blind Spot Detection & Driver Monitoring are Transforming Road Safety
- Doha a strategic location for EV manufacturing hub: IPA Qatar
- Demand for luxury TVs surging in the GCC, says Samsung
- Empowering Growth: The Thriving Journey of Bangladesh’s Cable Industry
- Demand for luxury TVs surging in the GCC, says Samsung
Latest Reports
- Poland Fire Protection Systems Market (2026-2032)
- Cape Verde Portable Hand-Thrown Extinguisher Market (2026-2032)
- Canada Portable Hand-Thrown Extinguisher Market (2026-2032)
- Cameroon Portable Hand-Thrown Extinguisher Market (2026-2032)
- Burundi Portable Hand-Thrown Extinguisher Market (2026-2032)
- Burkina Faso Portable Hand-Thrown Extinguisher Market (2026-2032)
- Bulgaria Portable Hand-Thrown Extinguisher Market (2026-2032)
- Brunei Portable Hand-Thrown Extinguisher Market (2026-2032)
- Botswana Portable Hand-Thrown Extinguisher Market (2026-2032)
- Bosnia and Herzegovina Portable Hand-Thrown Extinguisher Market (2026-2032)
Industry Events and Analyst Meet

HIMTEX 2026

India Refining Summit 2026

India EV Show 2026

EV tech India Expo 2026

Auto Tech Asia 2026
Whitepaper
- Middle East & Africa Commercial Security Market Click here to view more.
- Middle East & Africa Fire Safety Systems & Equipment Market Click here to view more.
- GCC Drone Market Click here to view more.
- Middle East Lighting Fixture Market Click here to view more.
- GCC Physical & Perimeter Security Market Click here to view more.