Japan In-App Payment Market Size & Growth Rate
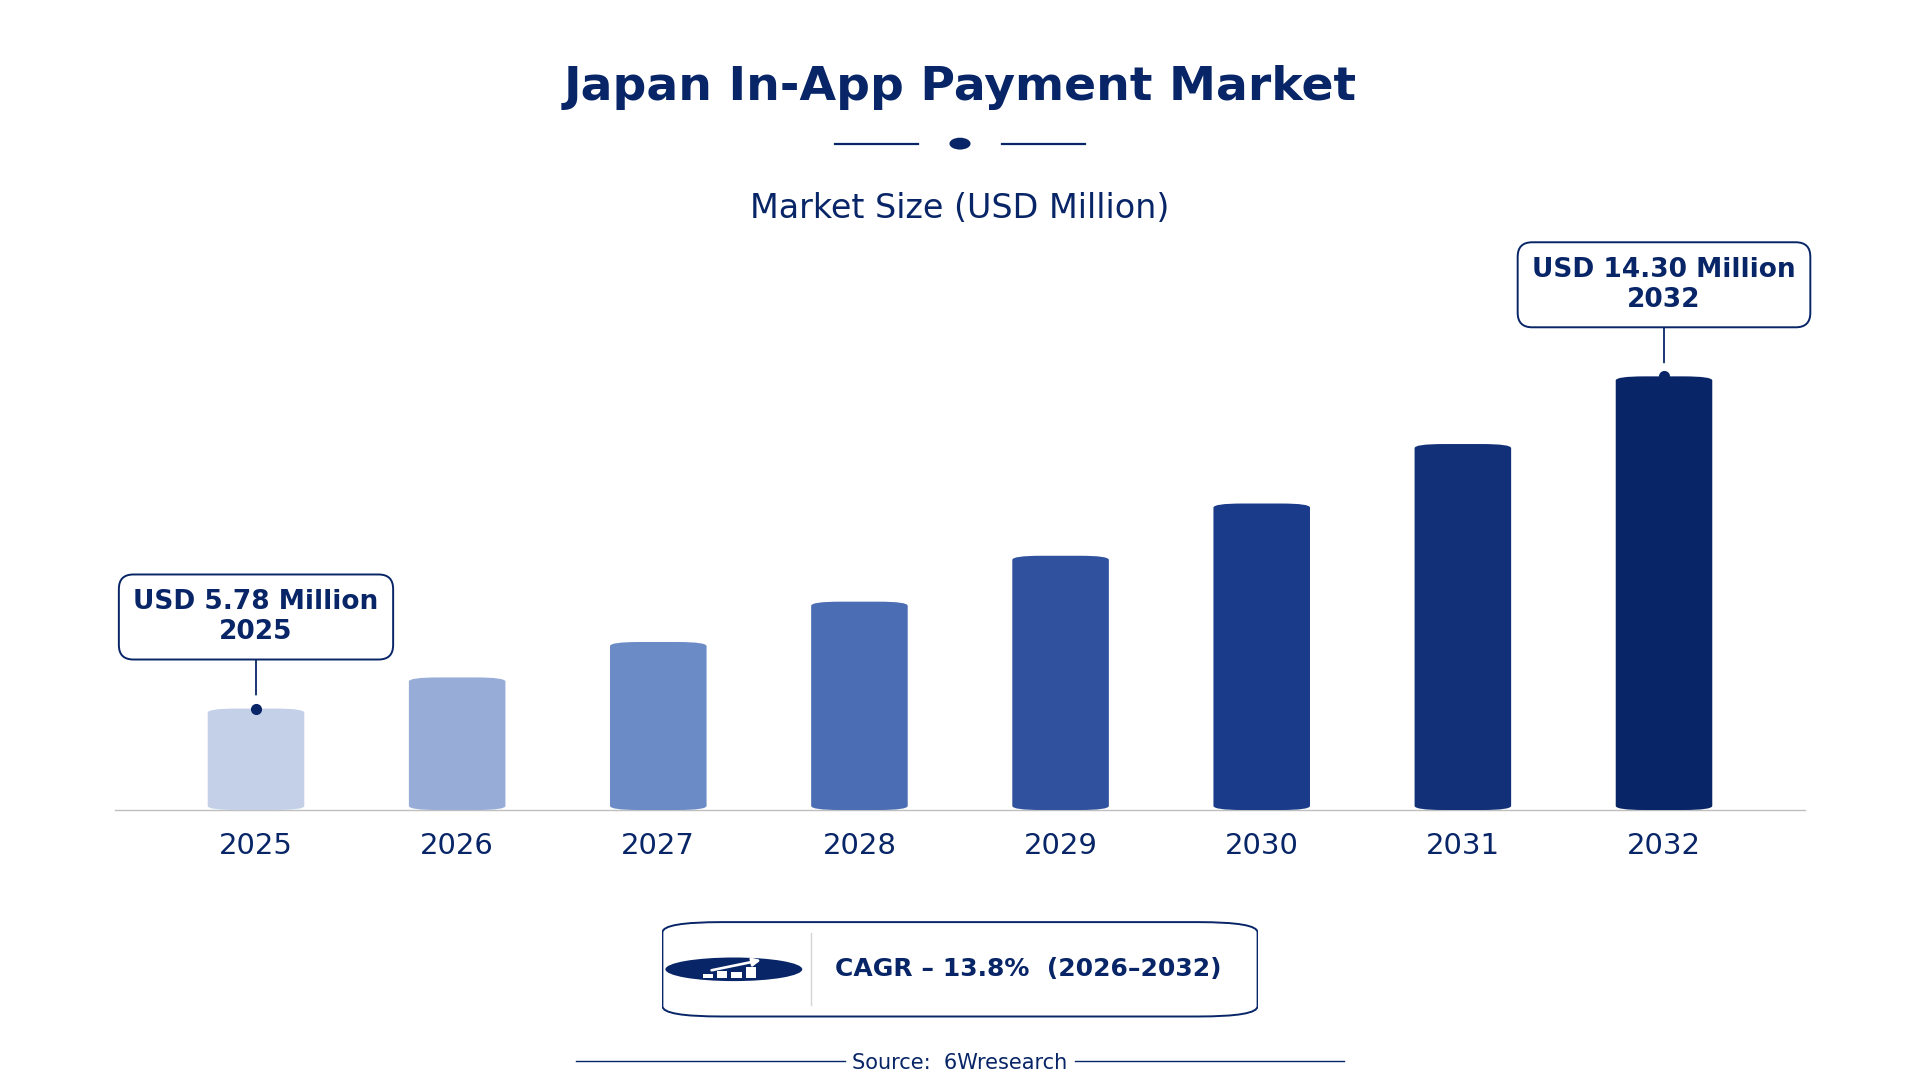
According to 6Wresearch internal database and industry insights, the Japan In-App Payment Market was valued at USD 5.78 Million in 2025 and is projected to reach USD 14.30 Million by 2032, growing at a CAGR of approximately 13.8% during 2026–2032.
Japan In-App Payment Market Highlights
| Report Metric | Details |
| Report Name | Japan In-App Payment Market (2026-2032) |
| Market Size 2025 | USD 5.78 Million |
| Market Size 2032 | USD 14.30 Million |
| Absolute Growth 2025–2032 | USD 8.52 Million |
| CAGR 2026–2032 | 13.8% |
| Peak Annual Growth | 14.7% in 2026 |
| Forecast Period | 2026–2032 |
| Historical Data | 2022–2025 |
| Base Year | 2025 |
| Leading Payment Method, 2025 | Wallet-Based Payments (47% share) |
| Leading Security Layer, 2025 | Tokenization (41% share) |
| Leading Platform Type, 2025 | iOS/Android (47% share) |
| Leading End User, 2025 | Digital App Owners (34% share) |
| Fastest-Growing Payment Method | Card-On-File Payments (19.1% CAGR) |
| Fastest-Growing Platform Type | Gaming/Entertainment (19.8% CAGR) |
| Fastest-Growing End User | Fintech Developers (17.6% CAGR) |
| Growing Sector | Mobile Gaming |
| Key End Users | Digital App Owners, Payment Gateway Providers, Fintech Developers |
Japan In-App Payment Market Year-wise Growth Rate and Key Drivers (2022–2032)
This graph illustrates the annual growth rates of the market from 2022 to 2032, highlighting a steady upward trajectory and projected market expansion over the forecast period.
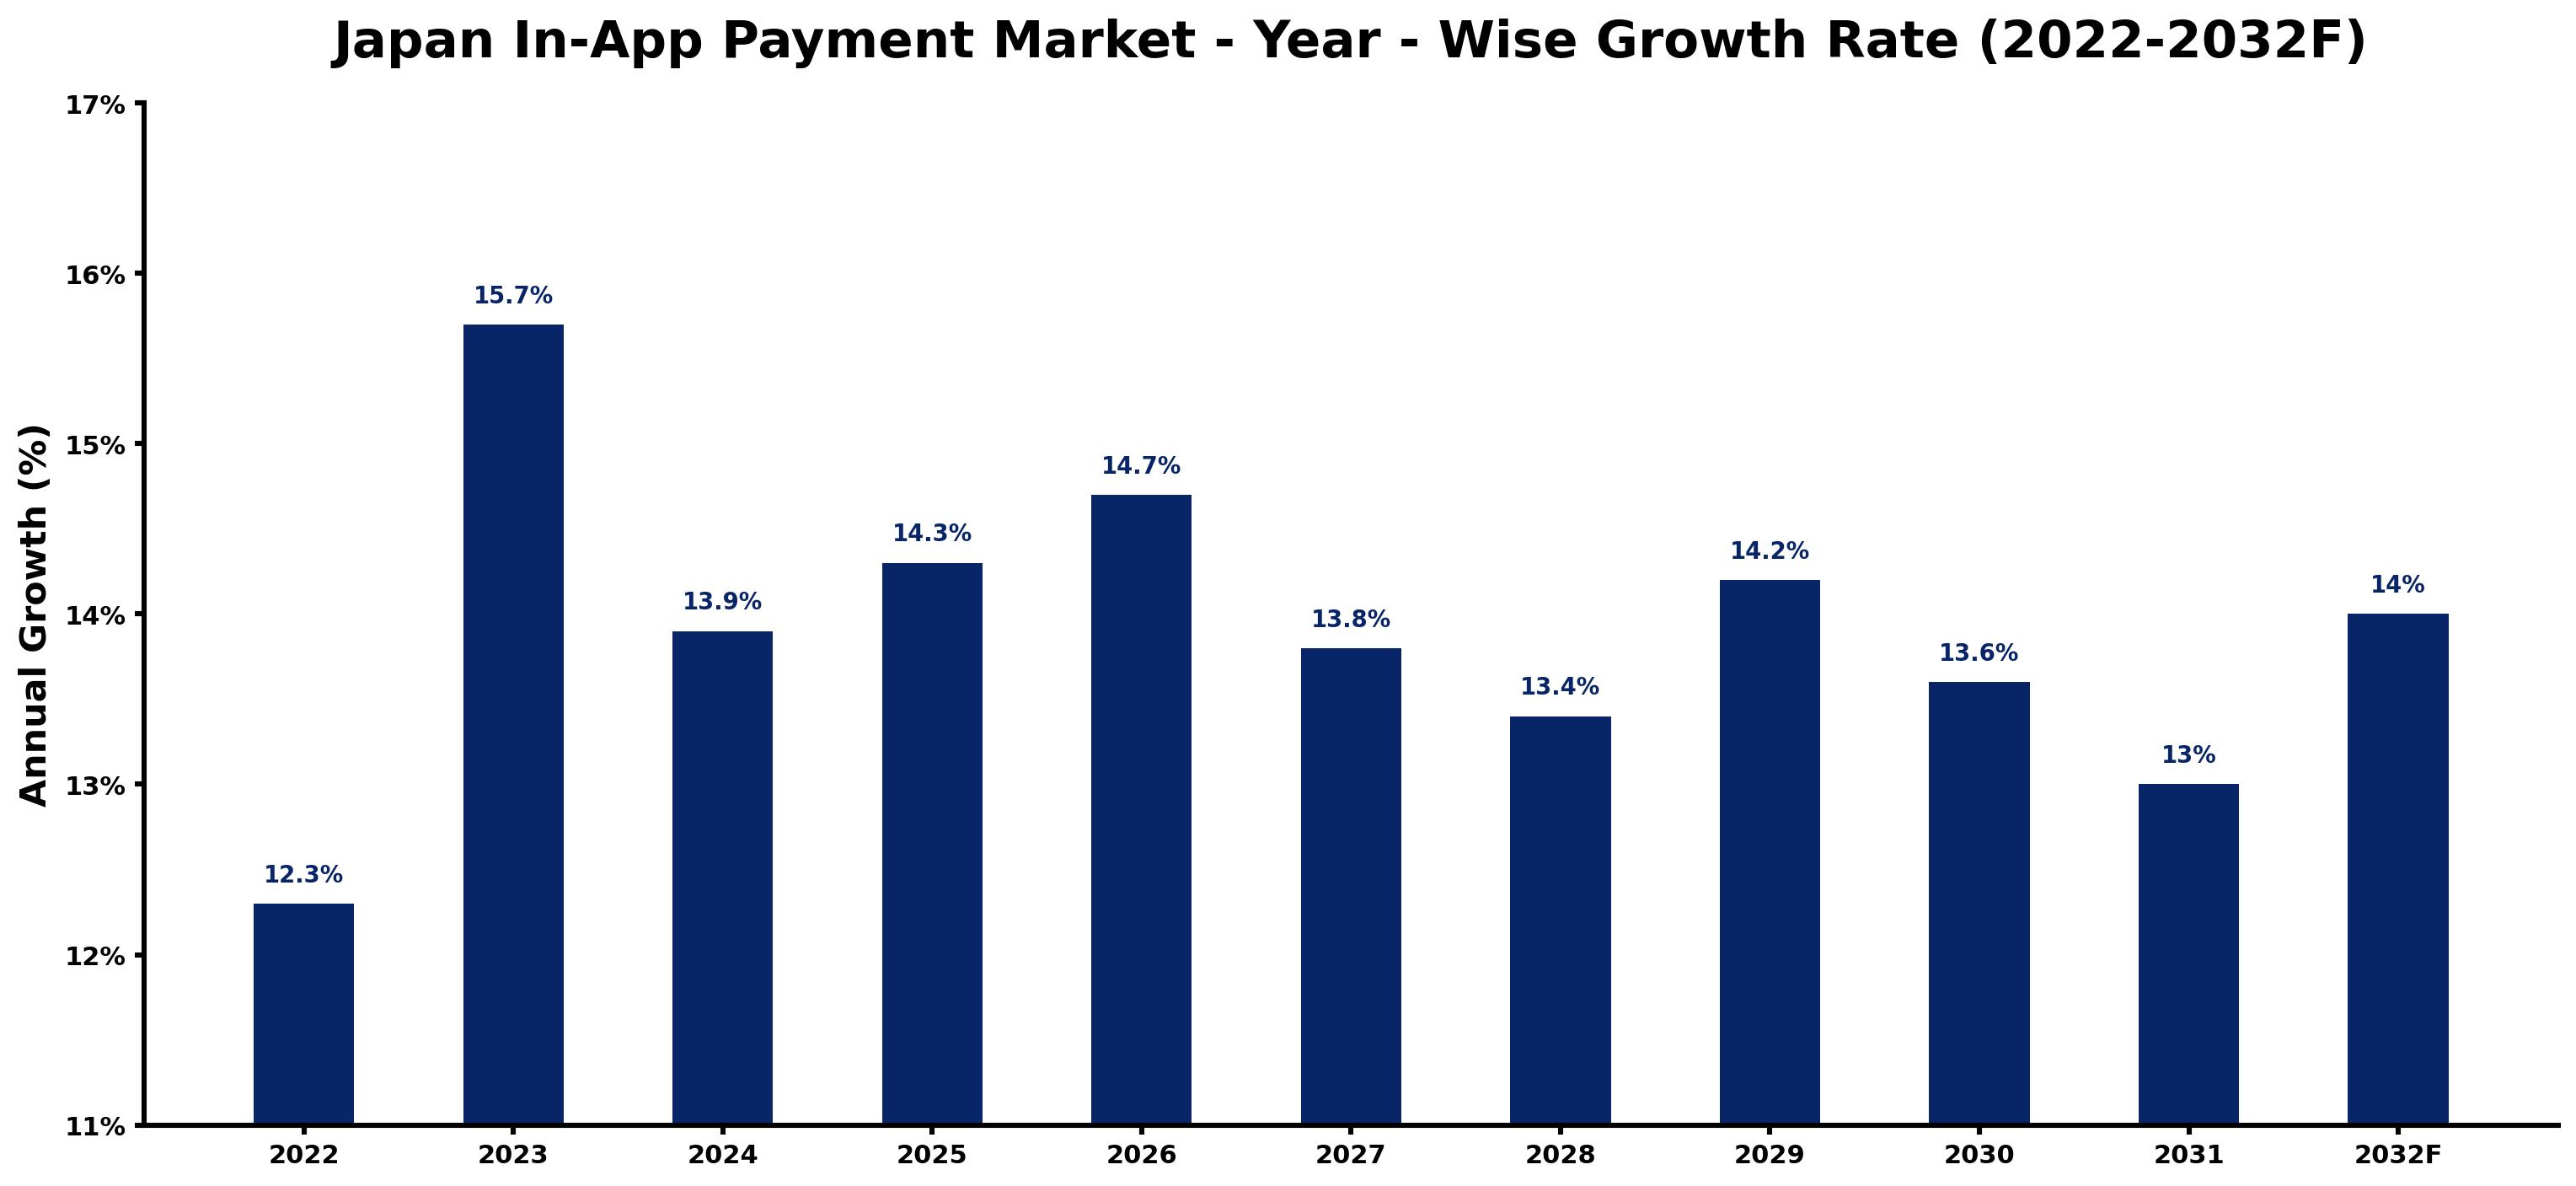
The following figures match every annual growth estimate with the main market development of that year, giving the reasoning behind each rise or slowdown.
| Year | Estimated Annual Growth (%) | Market Rationale |
| 2022 | 12.3 | The market experienced steady growth due to increasing smartphone penetration. |
| 2023 | 15.7 | Demand surged as mobile gaming revenue reached ¥1 trillion, boosting in-app purchases. |
| 2024 | 13.9 | Growth slowed slightly as market saturation began to impact new user acquisition. |
| 2025 | 14.3 | Increased adoption of subscription apps drove renewed interest in in-app payments. |
| 2026 | 14.7 | The peak growth rate is expected to be achieved as digital payment solutions gain traction. |
| 2027 | 13.8 | A slowdown is projected as competition intensifies among fintech developers. |
| 2028 | 13.4 | Growth is expected to continue to decelerate as market maturity sets in. |
| 2029 | 14.2 | A resurgence in mobile gaming is anticipated to revitalise demand for in-app payments. |
| 2030 | 13.6 | Growth is projected to slow again as user acquisition strategies become more challenging. |
| 2031 | 13.0 | The market is expected to maintain growth as biometric authentication becomes widely preferred. |
| 2032 | 14.0 | Increased investment in fintech solutions is projected to drive further growth. |
Note: Market size estimations and growth projections presented in this report are based on 6Wresearch's proprietary forecasting methodology, utilizing the latest available industry data, government publications, and primary research inputs.
Japan In-App Payment Market Synopsis
In-App Payment technology enables users to make purchases within mobile applications through secure payment gateways. The Japan In-App Payment Market is expanding due to smartphone penetration reaching 80% in 2023 and mobile gaming generating ¥1 trillion in revenue. The average monthly spend on in-app purchases is approximately ¥3,000, reflecting strong consumer engagement. The Digital Agency of Japan promotes secure digital payment solutions, and the rise of fintech startups is driving innovation in this sector. With over 70% of mobile gamers making in-app purchases, demand for seamless payment solutions continues to grow.
Market Dynamics Impact Analysis (2026–2032)
| Factor | Type | Impact | Primary Segment Affected |
| Increasing smartphone penetration | Driver | High | Wallet-Based Payments |
| Rising mobile gaming revenue | Driver | High | Gaming/Entertainment |
| Growing demand for secure payment solutions | Opportunity | High | Biometric Authentication |
| Expansion of subscription-based apps | Opportunity | High | Subscription Apps |
| Market saturation affecting new user acquisition | Restraint | Medium | Card-On-File Payments |
| Competition among fintech developers | Restraint | Medium | Payment Gateway Providers |
| Challenges in user retention | Challenge | High | Digital App Owners |
| Regulatory compliance costs | Challenge | Medium | Fintech Developers |
Evaluation of Drivers in Japan In-App Payment Market (2026–2032)
The following drivers explain most of the expected growth.
| Drivers | Primary Segment Affected | Why It Matters (Evidence) |
| High smartphone penetration | Wallet-Based Payments | In 2023, Japan's smartphone penetration reached 80%, driving demand for convenient payment methods. |
| Mobile gaming revenue growth | Gaming/Entertainment | Mobile gaming revenue in Japan was ¥1 trillion in 2023, leading to increased in-app purchases. |
| Preference for secure transactions | Biometric Authentication | 60% of users preferred biometric authentication for payments in 2023, enhancing transaction security. |
| Rise of subscription apps | Subscription Apps | The average monthly spend on in-app purchases is approximately ¥3,000, indicating strong consumer engagement. |
| Support from fintech startups | Payment Gateway Providers | The number of fintech startups in Japan reached 500 in 2023, fostering innovation in payment solutions. |
A wider customer base explains much of the growth, as smartphone penetration in Japan reached 80% in 2023, boosting wallet-based payments. Mobile gaming revenue soared to ¥1 trillion, driving up in-app purchases. The preference for secure transactions is reflected in 60% of users who chose biometric authentication for payments, improving transaction security. With 500 fintech startups in Japan, innovation in payment solutions thrives, further increasing demand. The average monthly spend on in-app purchases is approximately ¥3,000, indicating strong consumer engagement.
Evaluation of Restraints in Japan In-App Payment Market
The following restraints limit how fast demand can grow.
| Market Restraint | Primary Segment Affected | Why It Matters (Evidence) |
| Market saturation limiting growth | Card-On-File Payments | As the market matures, acquiring new users becomes increasingly challenging, impacting growth. |
| Intense competition among fintech developers | Payment Gateway Providers | The growing number of fintech startups has intensified competition, affecting profit margins. |
| High costs of regulatory compliance | Fintech Developers | Compliance with the Semiconductor and Digital Industry Strategy increases operational costs for fintech developers. |
| User retention challenges | Digital App Owners | Attracting and retaining users in a saturated market has become a notable hurdle. |
| Limited awareness of payment options | Wallet-Based Payments | Many users remain unaware of the full range of available payment methods, hindering adoption. |
Japan In-App Payment Market Challenges
Technology gaps in Japan's in-app payment market arise from reliance on legacy systems, causing transaction delays that can cost users approximately ¥1,500 per transaction during peak hours. Competition among app developers drives down profit margins for producers, with many facing a 20% revenue decline from in-app purchases. Regulatory complexities from the Ministry of Internal Affairs and Communications lead to increased compliance costs for suppliers, averaging ¥300,000 annually. Skills shortages in digital payment expertise hinder innovation, delaying product launches for firms by up to six months.
Trends in the Japan In-App Payment Market
Several trends are reshaping the Japan In-App Payment Market; the most important are set out below.
- Increase in Subscription-Based Apps: The rise of subscription-based apps is reshaping the market, with users spending an average of ¥3,000 monthly on in-app purchases. This trend is particularly strong among gaming and entertainment sectors.
- Expansion of Mobile Wallets: Mobile wallet usage in Japan is projected to reach 50% by 2025, driven by convenience and security. The Tokyo region is leading this trend with a high concentration of fintech companies.
- Growth of QR Code Payments: QR code payments accounted for 30% of all mobile transactions in 2023, highlighting a shift towards contactless payment methods. This trend is particularly popular among younger consumers.
- Shift towards Biometric Authentication: In 2023, 60% of users preferred biometric authentication for payments, reflecting a growing focus on security. Digital app owners are adopting these technologies to build user trust.
Investment Opportunities in the Japan In-App Payment Market
Several openings in the Japan In-App Payment Market merit attention from investors.
- Entry through Partnerships: With mobile wallet usage expected to reach 50% by 2025, fintech developers should consider partnerships with app platforms to enhance payment solutions. The Tokyo region, home to numerous fintech startups, presents a fertile ground for collaboration, allowing for tailored offerings that meet local demands.
- Digital App Owners' Need: Digital app owners are increasingly seeking secure payment solutions, as evidenced by the average monthly spend on in-app purchases of approximately ¥3,000. Investing in advanced payment gateways can attract more app developers looking to enhance user experience and security.
- Fintech Innovation Hubs: The Tokyo region has the highest concentration of fintech companies, making it an ideal location for investment in payment technology. With 500 fintech startups in Japan, there is a significant opportunity to supply innovative solutions that cater to the evolving market needs.
- Addressing Compliance Gaps: The average compliance cost for suppliers is approximately ¥300,000 annually, indicating a need for cost-effective solutions. Suppliers that offer streamlined compliance tools can tap into the growing demand from app developers looking to navigate regulatory complexities.
Government Initiatives in the Japan In-App Payment Market
The Payment Services Act regulates in-app payment transactions in Japan, ensuring secure and efficient processes for users. Compliance with this law is essential for app developers, as it mandates adherence to strict security standards and consumer protection measures. The Digital Agency of Japan promotes secure digital payment solutions, facilitating innovation in the sector and funding projects that enhance payment security and accessibility. The agency's efforts aim to streamline payment processes and promote user trust in transactions.
The Digital Agency oversees the implementation of digital payment initiatives, funding projects that improve payment security and accessibility. It supports various fintech solutions and encourages collaboration among industry players to strengthen the overall payment ecosystem. The agency's efforts aim to streamline payment processes and promote user trust in digital transactions.
Future Insight of the Japan In-App Payment Market
By 2032, Japan's in-app payment sector will experience shifts due to policy-driven changes and technological advancements. The government's digital payment promotion program will boost consumer trust and engagement in mobile transactions. Mobile wallet usage is expected to reach 50% by 2025, creating demand for streamlined payment systems. The implementation of JIS X 8341-3 will improve accessibility, prompting app developers to offer more inclusive solutions.
Market Segmentation Analysis
Japan In-App Payment Market report covers a detailed analysis of the following market segments:
By Payment Method – Wallet-Based Payments Lead, Card-On-File Payments Expected to Grow Fastest
According to Saurav Kr Singh, Senior Research Analyst at 6Wresearch, Wallet-Based Payments took 47% of payment method revenue in 2025, more than any other category. Wallet-Based Payments dominate the market due to their convenience and user-friendliness, particularly among digital goods consumers. This method is particularly popular among mobile gamers, with over 70% engaging in in-app purchases, solidifying its position. Card-On-File Payments are projected to grow fastest, at a CAGR of 19.1% during 2026–2032. Card-On-File Payments are experiencing rapid growth as they cater to the increasing demand for hassle-free subscription services. The mobile gaming sector, generating ¥1 trillion in revenue in 2023, is a key driver for this growth. Suppliers should enhance wallet functionalities to align with consumer preferences and increase market share.
By Security Layer – Tokenization Leads and Records the Fastest Growth
Tokenization accounted for 41% of the market by security layer in 2025. Tokenization leads the market as it effectively protects sensitive data during transactions, fostering user trust and compliance with regulations. Its critical role in securing digital payments makes it essential in the current landscape. The same category is also set to grow fastest, at a CAGR of 17.9% during 2026–2032. Tokenization is also the fastest-growing security layer because it is vital for safeguarding user data against escalating cyber threats. As online transactions increase, the demand for robust security measures will continue to rise. Providers must invest in advanced tokenization technologies to maintain competitiveness in the market.
By Platform Type – iOS/Android Leads, Gaming/Entertainment Expected to Grow Fastest
With 47% of platform type revenue in 2025, iOS/Android was the largest category. iOS/Android platforms hold the largest share as they are the primary environments for mobile applications, facilitating the widespread use of in-app payments. With over 2 million mobile apps available, these platforms are integral to the market's infrastructure. The quickest growth will come from Gaming/Entertainment, forecast to expand at a CAGR of 19.8% between 2026 and 2032. Gaming/Entertainment is the fastest-growing sector as it increasingly utilises in-app payments for monetisation. The substantial mobile gaming revenue of ¥1 trillion in 2023 highlights the sector's potential for further expansion. Developers should focus on optimising payment solutions specifically for gaming applications to capture this growth.
By End User – Digital App Owners Lead, Fintech Developers Expected to Grow Fastest
The largest end user category in 2025 was Digital App Owners, at 34% of revenue. Digital App Owners represent the largest user group of in-app payment technology, relying on these systems to effectively monetise their applications. Their significant presence in the market drives the demand for seamless payment solutions. Over 2026–2032, Fintech Developers are expected to post the fastest growth, at a CAGR of 17.6%. Fintech Developers are the fastest-growing group as they are essential in creating advanced payment solutions that cater to evolving consumer needs. The rise of 500 fintech startups in Japan illustrates a dynamic environment for payment innovations. Collaboration with fintech developers can significantly enhance the capabilities of in-app payment systems.
Key Attractiveness of the Report
- 10 Years of Market Numbers
- Historical Data Starting from 2022 to 2025
- Base Year 2025
- Forecast Data until 2032
- Key Performance Indicators Impacting the Market
- Major Upcoming Developments and Projects
Key Highlights of the Report:
- Japan In-App Payment Market Outlook
- Market Size of Japan In-App Payment Market, 2025
- Forecast of Japan In-App Payment Market, 2032
- Historical Data and Forecast of Japan In-App Payment Revenues & Volume for the Period 2022-2032F
- Japan In-App Payment Market Trend Evolution
- Japan In-App Payment Market Drivers and Challenges
- Japan In-App Payment Price Trends
- Japan In-App Payment Porter's Five Forces
- Japan In-App Payment Industry Life Cycle
- Historical Data and Forecast of Japan In-App Payment Market Revenues & Volume By Payment Method for the Period 2022-2032F
- Historical Data and Forecast of Japan In-App Payment Market Revenues & Volume By Wallet-Based Payments for the Period 2022-2032F
- Historical Data and Forecast of Japan In-App Payment Market Revenues & Volume By Card-On-File Payments for the Period 2022-2032F
- Historical Data and Forecast of Japan In-App Payment Market Revenues & Volume By Carrier Billing for the Period 2022-2032F
- Historical Data and Forecast of Japan In-App Payment Market Revenues & Volume By UPI/Bank Transfers for the Period 2022-2032F
- Historical Data and Forecast of Japan In-App Payment Market Revenues & Volume By Security Layer for the Period 2022-2032F
- Historical Data and Forecast of Japan In-App Payment Market Revenues & Volume By Biometric Authentication for the Period 2022-2032F
- Historical Data and Forecast of Japan In-App Payment Market Revenues & Volume By Tokenization for the Period 2022-2032F
- Historical Data and Forecast of Japan In-App Payment Market Revenues & Volume By Telco Integration for the Period 2022-2032F
- Historical Data and Forecast of Japan In-App Payment Market Revenues & Volume By QR/NFC Enabled for the Period 2022-2032F
- Historical Data and Forecast of Japan In-App Payment Market Revenues & Volume By Platform Type for the Period 2022-2032F
- Historical Data and Forecast of Japan In-App Payment Market Revenues & Volume By iOS/Android for the Period 2022-2032F
- Historical Data and Forecast of Japan In-App Payment Market Revenues & Volume By Subscription Apps for the Period 2022-2032F
- Historical Data and Forecast of Japan In-App Payment Market Revenues & Volume By Gaming/Entertainment for the Period 2022-2032F
- Historical Data and Forecast of Japan In-App Payment Market Revenues & Volume By Indian Payment Apps for the Period 2022-2032F
- Historical Data and Forecast of Japan In-App Payment Market Revenues & Volume By End User for the Period 2022-2032F
- Historical Data and Forecast of Japan In-App Payment Market Revenues & Volume By Digital App Owners for the Period 2022-2032F
- Historical Data and Forecast of Japan In-App Payment Market Revenues & Volume By Payment Gateway Providers for the Period 2022-2032F
- Historical Data and Forecast of Japan In-App Payment Market Revenues & Volume By Telecom Providers for the Period 2022-2032F
- Historical Data and Forecast of Japan In-App Payment Market Revenues & Volume By Fintech Developers for the Period 2022-2032F
- Japan In-App Payment Import Export Trade Statistics
- Market Opportunity Assessment By Payment Method
- Market Opportunity Assessment By Security Layer
- Market Opportunity Assessment By Platform Type
- Market Opportunity Assessment By End User
- Japan In-App Payment Top Companies Market Share
- Japan In-App Payment Competitive Benchmarking By Technical and Operational Parameters
- Japan In-App Payment Company Profiles
- Japan In-App Payment Key Strategic Recommendations
Market Covered
The following segment groups are covered in the report.
By Payment Method
- Wallet-Based Payments
- Card-On-File Payments
- Carrier Billing
- UPI/Bank Transfers
By Security Layer
- Biometric Authentication
- Tokenization
- Telco Integration
- QR/NFC Enabled
By Platform Type
- iOS/Android
- Subscription Apps
- Gaming/Entertainment
- Indian Payment Apps
By End User
- Digital App Owners
- Payment Gateway Providers
- Telecom Providers
- Fintech Developers































