Japan Indoor Entertainment Market Size & Growth Rate
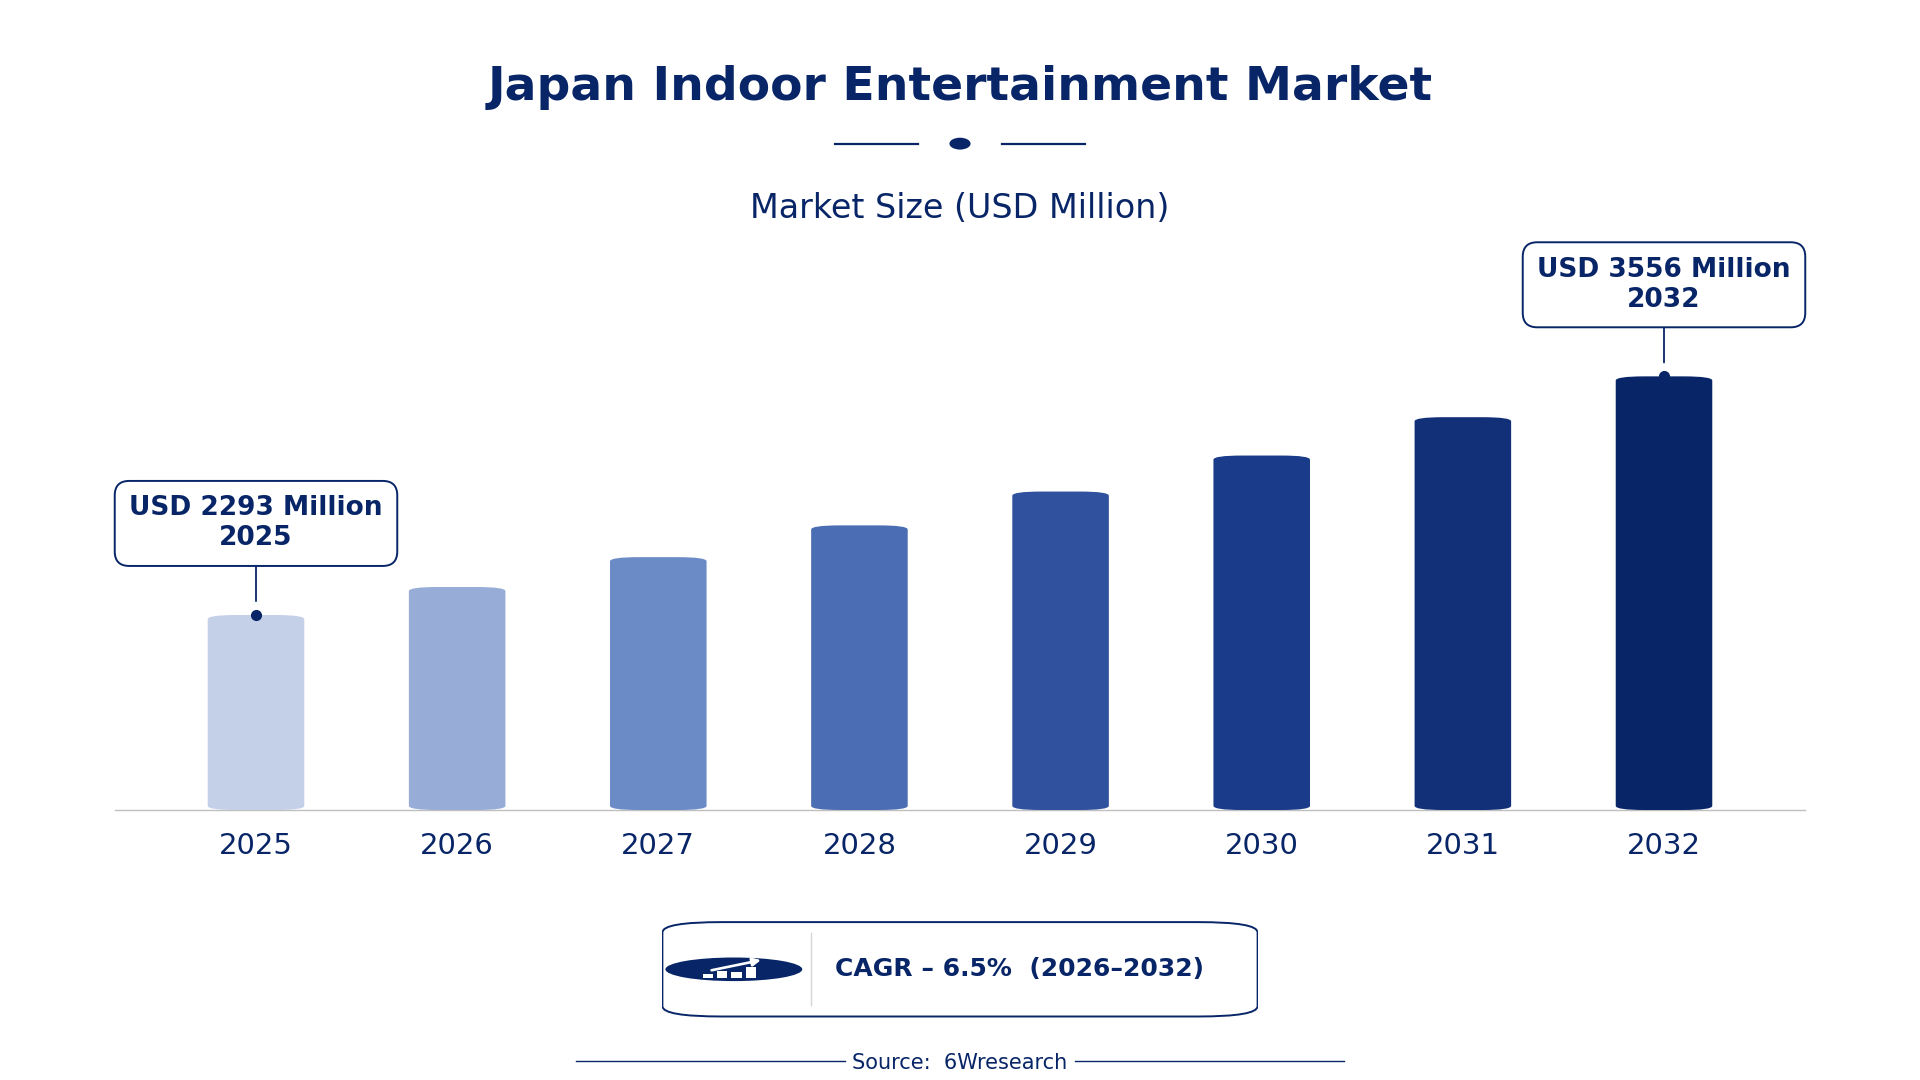
According to 6Wresearch internal database and industry insights, the Japan Indoor Entertainment Market was valued at USD 2,293 Million in 2025 and is projected to reach USD 3,556 Million by 2032, growing at a CAGR of approximately 6.5% during 2026–2032.
Japan Indoor Entertainment Market Highlights
| Report Metric | Details |
| Report Name | Japan Indoor Entertainment Market (2026-2032) |
| Market Size 2025 | USD 2,293 Million |
| Market Size 2032 | USD 3,556 Million |
| Absolute Growth 2025–2032 | USD 1,263 Million |
| CAGR 2026–2032 | 6.5% |
| Peak Annual Growth | 7.1% in 2031 |
| Forecast Period | 2026–2032 |
| Historical Data | 2022–2025 |
| Base Year | 2025 |
| Leading Entertainment Type, 2025 | Virtual Reality Zones (43% share) |
| Leading Venue Type, 2025 | Game Centers (39% share) |
| Leading Content Type, 2025 | VR Games (46% share) |
| Leading End User, 2025 | Gaming Arcades (43% share) |
| Fastest-Growing Entertainment Type | Bowling Alleys (9.1% CAGR) |
| Fastest-Growing Venue Type | Urban Malls (9.6% CAGR) |
| Fastest-Growing Content Type | Physical Games (9.3% CAGR) |
| Fastest-Growing End User | Commercial Real Estate (8.4% CAGR) |
| Growing Sector | Commercial Real Estate |
| Key End Users | Gaming Arcades, Commercial Real Estate, City Planners, Hospitality Industry |
Japan Indoor Entertainment Market Year-wise Growth Rate and Key Drivers (2022–2032)
This graph illustrates the annual growth rates of the market from 2022 to 2032, highlighting a steady upward trajectory and projected market expansion over the forecast period.
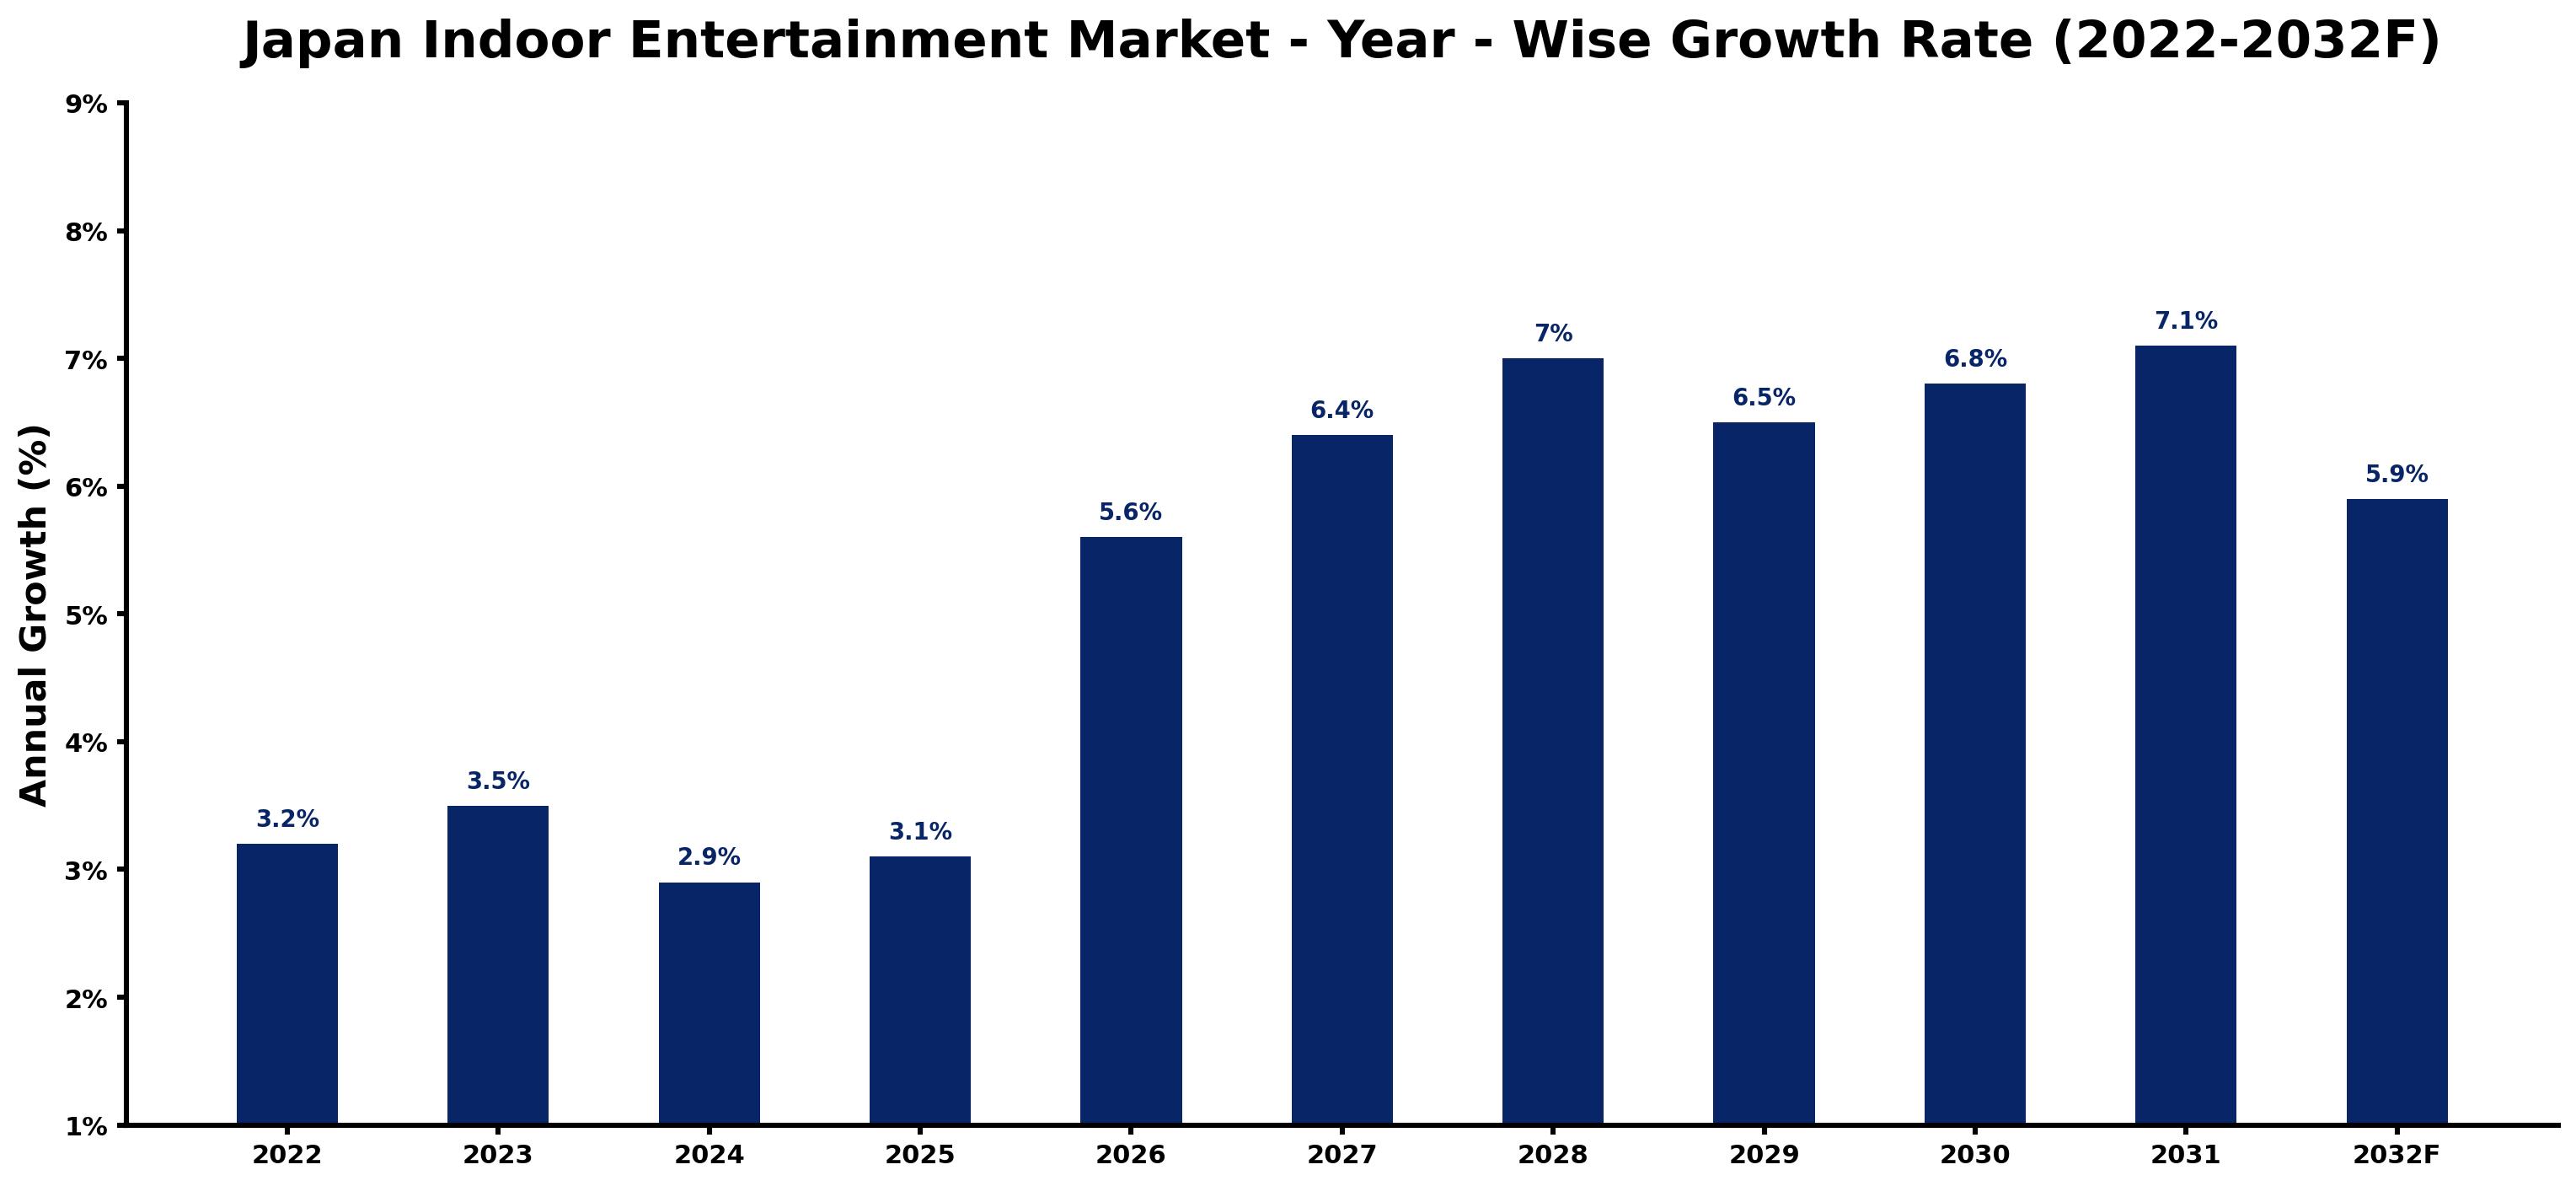
The table below sets out the estimated growth rate for each year and the main factor behind it.
| Year | Estimated Annual Growth (%) | Market Rationale |
| 2022 | 3.2 | The market showed steady activity with numerous indoor entertainment facilities operating across the country. |
| 2023 | 3.5 | Growth was spurred by increased domestic tourism and a rise in family-oriented entertainment options. |
| 2024 | 2.9 | A slowdown occurred due to market saturation and fewer new facility openings compared to previous years. |
| 2025 | 3.1 | Demand picked up as urban malls began incorporating more entertainment zones to attract shoppers. |
| 2026 | 5.6 | An influx of investment into virtual reality experiences will drive market growth this year. |
| 2027 | 6.4 | Continued investment in immersive technologies will contribute to a strong demand for indoor entertainment. |
| 2028 | 7.0 | The market will experience a surge as consumer interest in family-oriented attractions grows. |
| 2029 | 6.5 | A slowdown in growth will be noted as competition increases among existing entertainment venues. |
| 2030 | 6.8 | Growth will accelerate again with new interactive experiences being introduced to attract younger audiences. |
| 2031 | 7.1 | Peak growth will be achieved as diverse entertainment options capture the attention of various demographics. |
| 2032 | 5.9 | Growth will slow slightly as the market stabilises after reaching new heights in consumer engagement. |
Note: Market size estimations and growth projections presented in this report are based on 6Wresearch's proprietary forecasting methodology, utilizing the latest available industry data, government publications, and primary research inputs.
Japan Indoor Entertainment Market Synopsis
Indoor entertainment in Japan includes activities like virtual reality experiences, bowling alleys, and theme parks, designed for leisure and social interaction. The Japan Indoor Entertainment Market is expanding, with Tokyo accounting for approximately 30% of all indoor entertainment venues. This growth is driven by increased domestic tourism, urban development, and a rising interest in immersive experiences. The Virtual Reality market alone is expected to reach 1.5 billion USD by 2025, reflecting strong demand from families and tourists alike.
Market Dynamics Impact Analysis (2026–2032)
| Factor | Type | Impact | Primary Segment Affected |
| Increased investment in immersive technologies | Driver | High | Virtual Reality Zones |
| Growing popularity of family-oriented attractions | Driver | High | Indoor Theme Parks |
| Expansion of urban malls incorporating entertainment zones | Opportunity | High | Urban Malls |
| Rising interest in educational experiences at interactive museums | Opportunity | Medium | Interactive Museums |
| Market saturation in urban areas limiting new facility openings | Restraint | High | Game Centers |
| High operational costs for maintaining advanced entertainment technologies | Restraint | Medium | Bowling Alleys |
| Intense competition among existing entertainment venues | Challenge | High | Indoor Theme Parks |
| Fluctuating consumer preferences affecting visitor numbers | Challenge | Medium | Gaming Arcades |
Evaluation of Drivers in Japan Indoor Entertainment Market (2026–2032)
Demand rests on the following drivers, each shown with the segment it touches most.
| Drivers | Primary Segment Affected | Why It Matters (Evidence) |
| Investment in advanced virtual reality technologies | Virtual Reality Zones | The Virtual Reality market in Japan is expected to reach 1.5 billion USD by 2025, driving demand for immersive experiences. |
| Increased family-oriented entertainment options | Indoor Theme Parks | Indoor theme parks focus on attractions for families, boosting visitor engagement and driving ticket sales. |
| Urban development promoting entertainment venues | Urban Malls | Urban malls are incorporating entertainment zones to attract shoppers, leading to higher foot traffic. |
| Growing popularity of interactive educational experiences | Interactive Museums | Interactive museums attract over 5 million visitors annually, boosting demand for educational entertainment. |
| Resurgence of bowling as a family activity | Bowling Alleys | Bowling alleys in Japan saw a resurgence with over 1,000 operational locations, appealing to families. |
A wider customer base explains much of the growth, as increased investment in advanced virtual reality technologies is anticipated to push the market to 1.5 billion USD by 2025. Urban development encourages malls to incorporate entertainment zones, attracting more shoppers and boosting foot traffic. The popularity of family-oriented attractions in indoor theme parks raises visitor engagement, resulting in higher ticket sales. Interactive museums, which attract over 5 million visitors annually, are increasingly popular for educational experiences. The resurgence of bowling as a family activity, with over 1,000 operational alleys, further supports demand.
Evaluation of Restraints in Japan Indoor Entertainment Market
Below are the constraints most often cited by buyers and suppliers, with the segment each affects.
| Market Restraint | Primary Segment Affected | Why It Matters (Evidence) |
| Market saturation limiting new facility openings | Game Centers | The high number of existing game centers in urban areas restricts opportunities for new entrants. |
| Operational costs of advanced entertainment technologies | Bowling Alleys | Maintaining state-of-the-art bowling facilities incurs high operational costs, affecting profitability. |
| Limited consumer spending on leisure activities | Indoor Theme Parks | Economic fluctuations can lead to reduced discretionary spending on entertainment options. |
| Intense competition among existing entertainment venues | Gaming Arcades | The growing number of gaming arcades intensifies competition, impacting visitor numbers. |
| Changing consumer preferences affecting attendance | Interactive Museums | Fluctuating interests in educational entertainment can lead to inconsistent visitor numbers. |
Japan Indoor Entertainment Market Challenges
In 2023, rising labour costs burden producers, as skilled workers demand higher wages, increasing operational expenses for indoor entertainment facilities. Many venues struggle with slow technology adoption, which hampers their ability to improve user experiences and limits competitiveness. Supply chain disruptions hinder the availability of essential equipment, causing delays in launching new attractions, resulting in lost revenue during peak seasons for producers. Competition escalates as urban malls incorporate entertainment zones, compelling existing venues to reduce prices, which erodes profit margins for operators.
Trends in the Japan Indoor Entertainment Market
Below are the shifts with the largest effect on the Japan Indoor Entertainment Market.
- Shift towards immersive entertainment experiences: The trend towards immersive entertainment experiences is clear in the rise of virtual reality zones, which are becoming increasingly popular. In 2023, the Virtual Reality market in Japan is expected to reach 1.5 billion USD, indicating strong consumer interest.
- Transition from traditional bowling to high-tech experiences: Since 2022, bowling alleys have been integrating technology to modernise the experience, attracting families. Over 1,000 operational bowling alleys are now offering advanced features to engage visitors.
- Emergence of edutainment as a key attraction: Edutainment is gaining traction, particularly in interactive museums, which attract over 5 million visitors annually. This trend reflects a growing preference for educational experiences combined with entertainment.
- Growing integration of entertainment in urban malls: Urban malls have increasingly incorporated entertainment zones since 2023, with Tokyo leading the way. Approximately 30% of indoor entertainment venues are now found in urban malls, boosting foot traffic.
Investment Opportunities in the Japan Indoor Entertainment Market
The following opportunities in the Japan Indoor Entertainment Market pair current demand with a clear way in.
- Ideal timing for investment in VR: Now is an ideal time to invest in virtual reality zones, with the market expected to reach 1.5 billion USD by 2025. Collaborating with urban malls can help tap into the growing demand for immersive experiences.
- Entry through partnerships: Establishing joint ventures with local entertainment providers can facilitate entry into the indoor entertainment market. This approach allows for shared resources and expertise, particularly in urban areas like Tokyo.
- Gap in family-oriented attractions: With family-oriented entertainment options on the rise, there is a gap in offerings for this demographic. Investing in indoor theme parks can cater to families seeking engaging experiences.
- Focus on educational experiences: The increasing popularity of edutainment presents an opportunity to develop interactive museums. These venues can attract visitors by combining education with entertainment, tapping into the 5 million annual visitors.
Government Initiatives in the Japan Indoor Entertainment Market
The Medical Care Act of 1948 establishes standards for hospitals and clinics, impacting indoor entertainment facilities that require health and safety compliance. The Industrial Standardization Act of 1949 governs product and test standards, ensuring quality in entertainment equipment used in venues.
In 2023, the government launched a subsidy program for urban entertainment development, administered by the Ministry of Land, Infrastructure, Transport and Tourism. This initiative aims to support new facility openings and improve the overall market appeal.
Future Insight of the Japan Indoor Entertainment Market
By 2032, technology will drive demand for immersive experiences, with virtual reality attractions becoming standard in indoor entertainment venues. The government’s subsidy programme for urban entertainment development will encourage investment in new facilities, boosting market appeal. Attendance at interactive museums is expected to rise significantly, supported by educational initiatives and community engagement. Standards like ISO 20121 will promote sustainability practices, appealing to environmentally conscious consumers and influencing their choices.
Market Segmentation Analysis
Japan Indoor Entertainment Market report covers a detailed analysis of the following market segments:
By Entertainment Type – Virtual Reality Zones Lead, Bowling Alleys Expected to Grow Fastest
According to Saurav Kr Singh, Senior Research Analyst at 6Wresearch, Virtual Reality Zones held 43% of the Japan Indoor Entertainment Market by entertainment type in 2025. Virtual Reality Zones hold the largest share because they provide immersive experiences that appeal to a wide audience, particularly in urban centres. The anticipated growth of the Virtual Reality market to 1.5 billion USD by 2025 highlights the increasing demand for these engaging environments. The quickest growth will come from Bowling Alleys, forecast to expand at a CAGR of 9.1% between 2026 and 2032. Bowling Alleys are witnessing rapid growth as they cater to families seeking recreational activities, with over 1,000 operational locations reflecting their popularity. This surge is driven by a renewed interest in social and interactive entertainment options among diverse age groups. Suppliers should enhance their offerings in bowling alleys to capitalise on this upward trend.
By Venue Type – Game Centers Lead, Urban Malls Expected to Grow Fastest
Game Centers took 39% of venue type revenue in 2025, more than any other category. Game Centers lead the market as they are central to urban entertainment culture, attracting a diverse range of visitors. With over 400 indoor entertainment facilities in Japan, these venues play a crucial role in providing leisure activities and social interaction. Urban Malls are set to record the highest CAGR in this split, 9.6% over 2026–2032. Urban Malls are growing quickly by integrating entertainment zones, which draw in shoppers and enrich the overall shopping experience. This trend signifies a shift towards multifunctional spaces that combine retail and leisure, appealing to a broader audience. Buyers should consider partnerships with urban malls to expand their customer engagement.
By Content Type – VR Games Lead, Physical Games Expected to Grow Fastest
The largest content type category in 2025 was VR Games, at 46% of revenue. VR Games lead the market as they represent a core offering in virtual reality zones, appealing particularly to tech-savvy consumers. The integration of VR experiences across various entertainment venues solidifies their prominent position. Physical Games are projected to grow fastest, at a CAGR of 9.3% during 2026–2032. Physical Games are growing quickly due to their traditional appeal within game centers, offering familiar entertainment options for a broad audience. This growth aligns with the increasing average visitor spend in game centers, which is approximately 2,500 JPY per visit. Suppliers should diversify their product lines to include more physical games to align with consumer preferences.
By End User – Gaming Arcades Lead, Commercial Real Estate Expected to Grow Fastest
With 43% of end user revenue in 2025, Gaming Arcades was the largest category. Gaming Arcades are historically significant in Japanese entertainment, consistently attracting a loyal customer base. Their established presence in urban areas ensures a steady flow of visitors seeking gaming experiences, reinforcing their dominant position in the market. Over 2026–2032, Commercial Real Estate is expected to post the fastest growth, at a CAGR of 8.4%. Commercial Real Estate is expanding rapidly as it creates spaces tailored for entertainment venues, reflecting the increasing demand for integrated leisure environments. This growth is further supported by government initiatives promoting urban entertainment development. Investors should explore opportunities in commercial real estate to support the growth of entertainment venues.
Key Attractiveness of the Report
- 10 Years of Market Numbers
- Historical Data Starting from 2022 to 2025
- Base Year 2025
- Forecast Data until 2032
- Key Performance Indicators Impacting the Market
- Major Upcoming Developments and Projects
Key Highlights of the Report:
- Japan Indoor Entertainment Market Outlook
- Market Size of Japan Indoor Entertainment Market, 2025
- Forecast of Japan Indoor Entertainment Market, 2032
- Historical Data and Forecast of Japan Indoor Entertainment Revenues & Volume for the Period 2022-2032F
- Japan Indoor Entertainment Market Trend Evolution
- Japan Indoor Entertainment Market Drivers and Challenges
- Japan Indoor Entertainment Price Trends
- Japan Indoor Entertainment Porter's Five Forces
- Japan Indoor Entertainment Industry Life Cycle
- Historical Data and Forecast of Japan Indoor Entertainment Market Revenues & Volume By Entertainment Type for the Period 2022-2032F
- Historical Data and Forecast of Japan Indoor Entertainment Market Revenues & Volume By Virtual Reality Zones for the Period 2022-2032F
- Historical Data and Forecast of Japan Indoor Entertainment Market Revenues & Volume By Bowling Alleys for the Period 2022-2032F
- Historical Data and Forecast of Japan Indoor Entertainment Market Revenues & Volume By Interactive Museums for the Period 2022-2032F
- Historical Data and Forecast of Japan Indoor Entertainment Market Revenues & Volume By Indoor Theme Parks for the Period 2022-2032F
- Historical Data and Forecast of Japan Indoor Entertainment Market Revenues & Volume By Venue Type for the Period 2022-2032F
- Historical Data and Forecast of Japan Indoor Entertainment Market Revenues & Volume By Game Centers for the Period 2022-2032F
- Historical Data and Forecast of Japan Indoor Entertainment Market Revenues & Volume By Urban Malls for the Period 2022-2032F
- Historical Data and Forecast of Japan Indoor Entertainment Market Revenues & Volume By Public Institutions for the Period 2022-2032F
- Historical Data and Forecast of Japan Indoor Entertainment Market Revenues & Volume By Resorts for the Period 2022-2032F
- Historical Data and Forecast of Japan Indoor Entertainment Market Revenues & Volume By Content Type for the Period 2022-2032F
- Historical Data and Forecast of Japan Indoor Entertainment Market Revenues & Volume By VR Games for the Period 2022-2032F
- Historical Data and Forecast of Japan Indoor Entertainment Market Revenues & Volume By Physical Games for the Period 2022-2032F
- Historical Data and Forecast of Japan Indoor Entertainment Market Revenues & Volume By Edutainment for the Period 2022-2032F
- Historical Data and Forecast of Japan Indoor Entertainment Market Revenues & Volume By Rides & Augmented Media for the Period 2022-2032F
- Historical Data and Forecast of Japan Indoor Entertainment Market Revenues & Volume By End User for the Period 2022-2032F
- Historical Data and Forecast of Japan Indoor Entertainment Market Revenues & Volume By Gaming Arcades for the Period 2022-2032F
- Historical Data and Forecast of Japan Indoor Entertainment Market Revenues & Volume By Commercial Real Estate for the Period 2022-2032F
- Historical Data and Forecast of Japan Indoor Entertainment Market Revenues & Volume By City Planners for the Period 2022-2032F
- Historical Data and Forecast of Japan Indoor Entertainment Market Revenues & Volume By Hospitality Industry for the Period 2022-2032F
- Japan Indoor Entertainment Import Export Trade Statistics
- Market Opportunity Assessment By Entertainment Type
- Market Opportunity Assessment By Venue Type
- Market Opportunity Assessment By Content Type
- Market Opportunity Assessment By End User
- Japan Indoor Entertainment Top Companies Market Share
- Japan Indoor Entertainment Competitive Benchmarking By Technical and Operational Parameters
- Japan Indoor Entertainment Company Profiles
- Japan Indoor Entertainment Key Strategic Recommendations
Market Covered
Segments analysed in this report are listed below.
By Entertainment Type
- Virtual Reality Zones
- Bowling Alleys
- Interactive Museums
- Indoor Theme Parks
By Venue Type
- Game Centers
- Urban Malls
- Public Institutions
- Resorts
By Content Type
- VR Games
- Physical Games
- Edutainment
- Rides & Augmented Media
By End User
- Gaming Arcades
- Commercial Real Estate
- City Planners
- Hospitality Industry































