Japan Industrial Visualization Market Size & Growth Rate
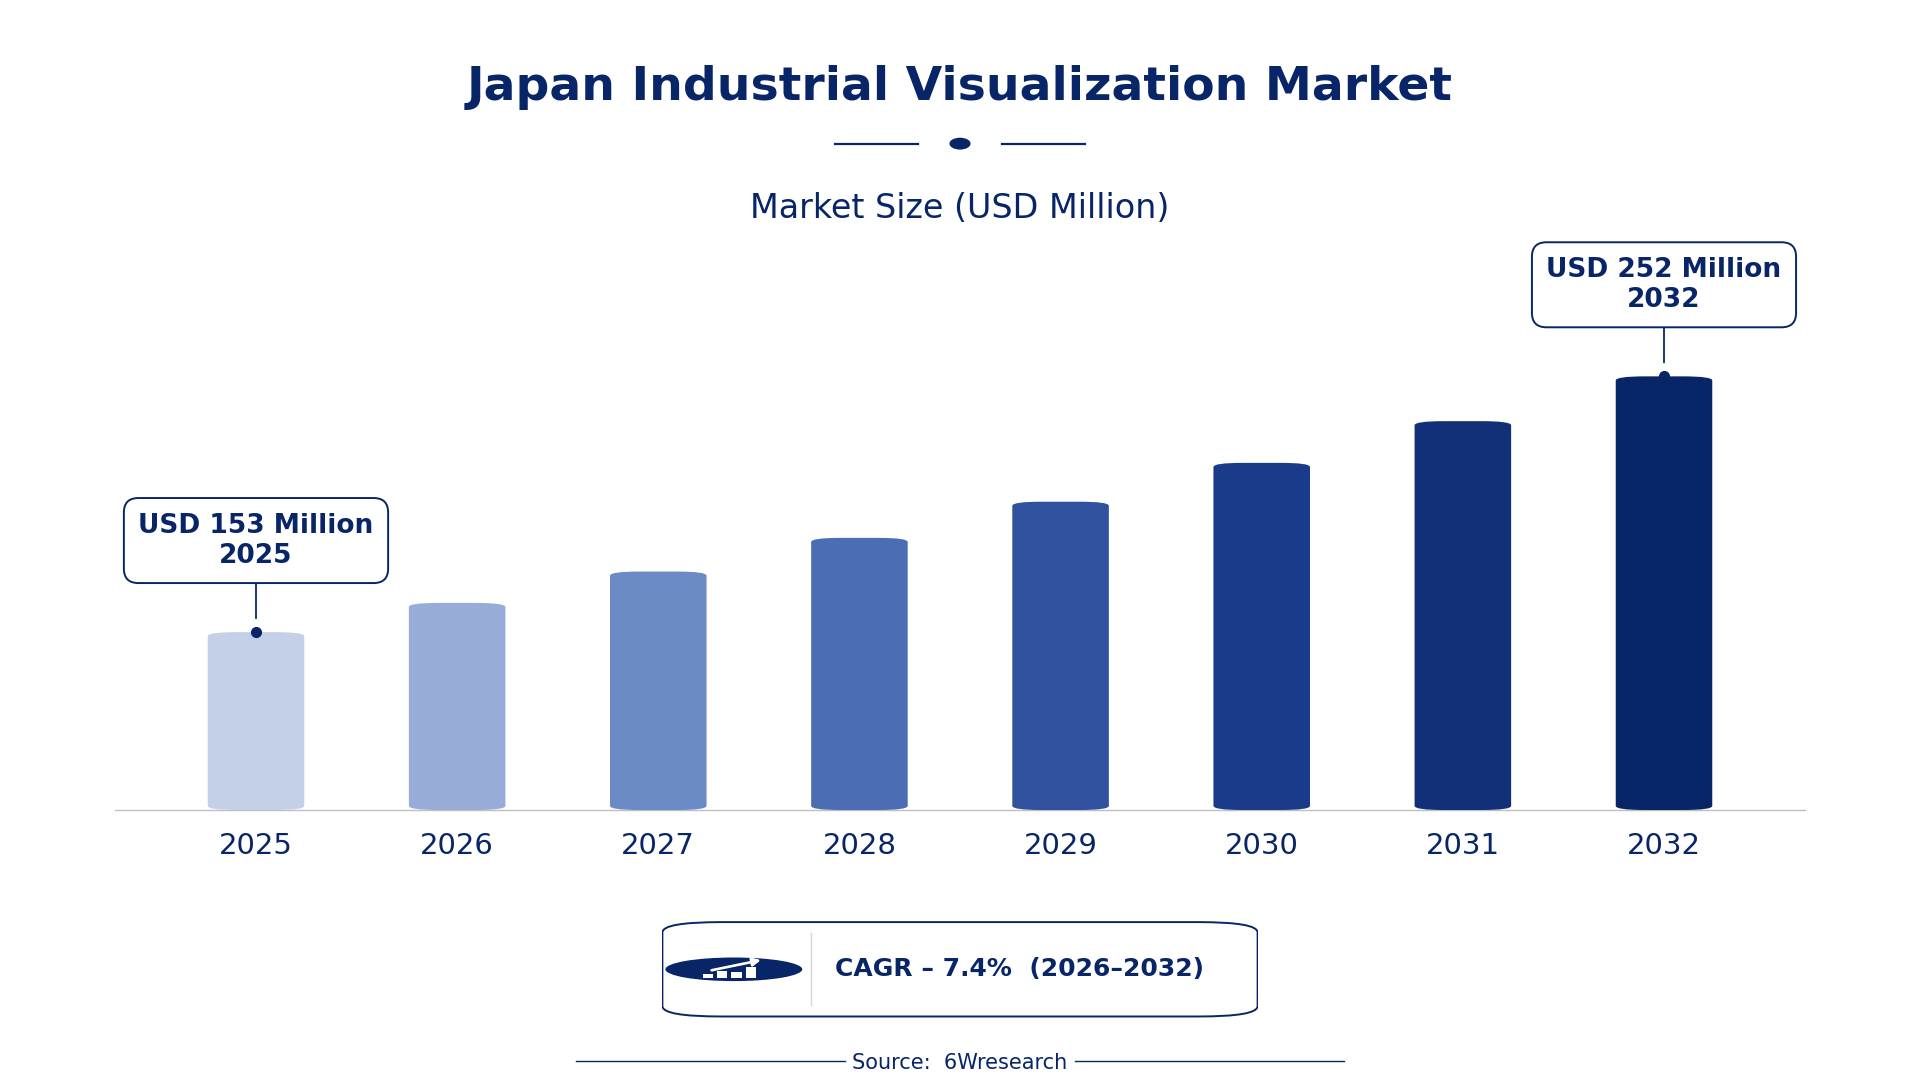
According to 6Wresearch internal database and industry insights, the Japan Industrial Visualization Market was valued at USD 153 Million in 2025 and is projected to reach USD 252 Million by 2032, growing at a CAGR of approximately 7.4% during 2026–2032.
Japan Industrial Visualization Market Highlights
| Report Metric | Details |
| Report Name | Japan Industrial Visualization Market (2026-2032) |
| Market Size 2025 | USD 153 Million |
| Market Size 2032 | USD 252 Million |
| Absolute Growth 2025–2032 | USD 99 Million |
| CAGR 2026–2032 | 7.4% |
| Peak Annual Growth | 8.7% in 2030 |
| Forecast Period | 2026–2032 |
| Historical Data | 2022–2025 |
| Base Year | 2025 |
| Leading Product Type, 2025 | SCADA Visualization (55% share) |
| Leading Visualization Tech, 2025 | Real-time Dashboards (42% share) |
| Leading Application, 2025 | Utilities Control (44% share) |
| Leading Distribution Channel, 2025 | Direct SaaS (56% share) |
| Fastest-Growing Product Type | 3D Plant Models (10.9% CAGR) |
| Fastest-Growing Visualization Tech | IoT-Based (10.2% CAGR) |
| Fastest-Growing Application | Factory Layout Planning (9.8% CAGR) |
| Growing Sector | utilities |
| Key End Users | manufacturers, utilities, automotive sector, energy providers |
Japan Industrial Visualization Market Year-wise Growth Rate and Key Drivers (2022–2032)
This graph illustrates the annual growth rates of the market from 2022 to 2032, highlighting a steady upward trajectory and projected market expansion over the forecast period.
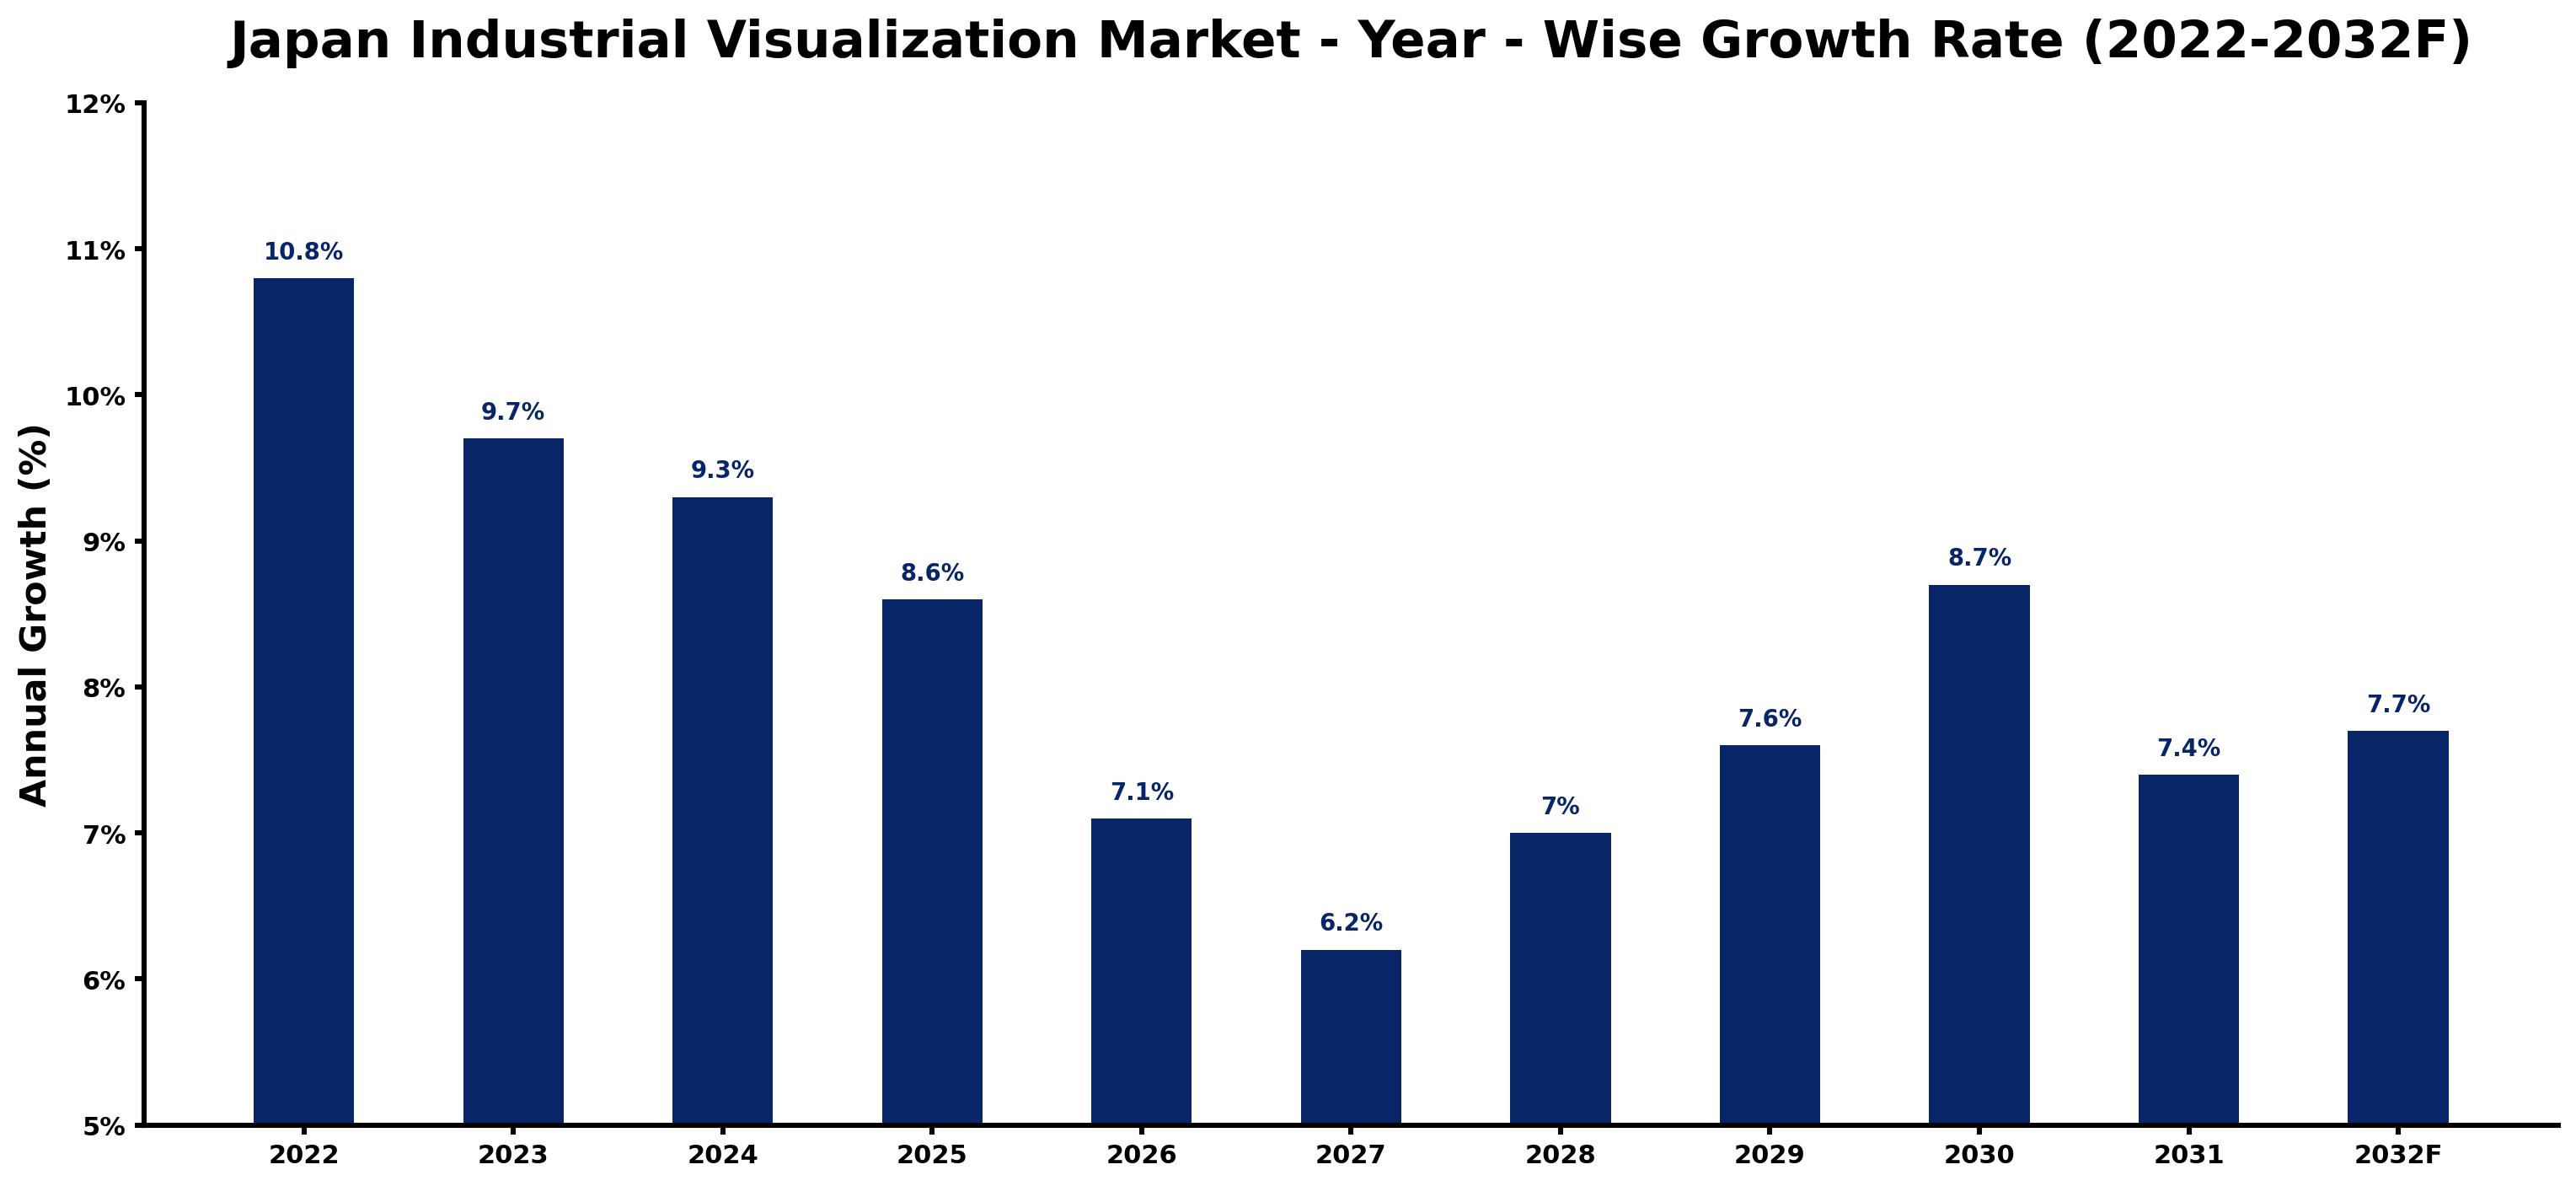
The table below sets out the estimated growth rate for each year and the main factor behind it.
| Year | Estimated Annual Growth (%) | Market Rationale |
| 2022 | 10.8 | The market experienced strong demand from manufacturing and utilities sectors. |
| 2023 | 9.7 | Growth slowed due to market saturation in certain visualization technologies. |
| 2024 | 9.3 | Continued adoption of SCADA systems contributed to steady market expansion. |
| 2025 | 8.6 | Investment in IoT integration began to moderate growth rates. |
| 2026 | 7.1 | Demand for advanced visualization tools is expected to plateau as competition increases. |
| 2027 | 6.2 | Market growth slowed as buyers focused on cost-efficiency measures. |
| 2028 | 7.0 | Increased investments in 3D plant models spurred a rebound in growth. |
| 2029 | 7.6 | Rising interest in real-time dashboards drove higher demand in industries. |
| 2030 | 8.7 | The peak growth year saw advancements in industrial visualization technologies. |
| 2031 | 7.4 | Growth moderated as companies reassessed their technology investments. |
| 2032 | 7.7 | A renewed focus on sustainability initiatives will boost market demand. |
Note: Market size estimations and growth projections presented in this report are based on 6Wresearch's proprietary forecasting methodology, utilizing the latest available industry data, government publications, and primary research inputs.
Japan Industrial Visualization Market Synopsis
Industrial Visualization in Japan encompasses technologies that improve the representation of industrial processes through digital means, primarily using software tools for real-time data analysis. The Japan Industrial Visualization Market is expanding, driven by the adoption of SCADA systems, with over 10,000 units in operation. Increased investment in IoT integration and the need for operational efficiency in manufacturing and utilities sectors are propelling growth, with annual investments estimated at several billion yen.
Market Dynamics Impact Analysis (2026–2032)
| Factor | Type | Impact | Primary Segment Affected |
| Rising demand for SCADA systems in manufacturing | Driver | High | SCADA Visualization |
| Growing adoption of IoT-based visualization tools | Driver | High | IoT-Based |
| Emerging need for 3D plant models in factory layout planning | Opportunity | Medium | 3D Plant Models |
| Increased focus on real-time dashboards for performance monitoring | Opportunity | High | Real-time Dashboards |
| Market saturation in traditional visualization technologies | Restraint | Medium | Data Dashboards |
| High initial investment costs for advanced visualization tools | Restraint | High | AR/VR Visual Tools |
| Limited adoption of AR/VR tools in training programs | Challenge | Medium | AR/VR Visual Tools |
| Competition from international visualization technology providers | Challenge | High | Data Dashboards |
Evaluation of Drivers in Japan Industrial Visualization Market (2026–2032)
The table below links each growth driver to the segment it affects and the evidence for it.
| Drivers | Primary Segment Affected | Why It Matters (Evidence) |
| Increased investment in SCADA systems | SCADA Visualization | Over 10,000 units installed in Japan drive demand for real-time process control. |
| Adoption of IoT-based visualization tools | IoT-Based | The adoption rate in major cities exceeds 50%, improving real-time data access for utilities. |
| Growing need for operational efficiency | 3D Plant Models | Investment in 3D plant models is increasing as firms aim to optimise layouts. |
| Demand for performance monitoring solutions | Data Dashboards | Critical for over 70% of manufacturing firms, driving consistent purchases. |
| Focus on maintenance training improvements | AR/VR Visual Tools | Automotive manufacturers are increasingly adopting these tools for training. |
Most of the extra volume comes from rising investment in SCADA systems, with over 10,000 units installed across Japan, driving real-time process control. The adoption of IoT-based visualization tools has surpassed 50% in major cities, allowing utilities to access data instantly. Manufacturers are increasingly focused on operational efficiency, with 3D plant models projected to grow rapidly. Performance monitoring solutions are essential for over 70% of firms, driving consistent demand for dashboards. The automotive sector is also adopting AR/VR tools for maintenance training, further boosting market growth.
Evaluation of Restraints in Japan Industrial Visualization Market
The key brakes on demand, and where they bite hardest, are shown below.
| Market Restraint | Primary Segment Affected | Why It Matters (Evidence) |
| Market saturation in traditional visualization technologies | Data Dashboards | As many firms already utilize dashboards, new sales opportunities are limited. |
| High initial investment costs for advanced visualization tools | AR/VR Visual Tools | The expense of implementing AR/VR solutions deters some manufacturers. |
| Limited adoption of AR/VR tools in training programs | AR/VR Visual Tools | Many companies prefer traditional training methods, affecting market penetration. |
| Competition from international visualization technology providers | Data Dashboards | Local firms face challenges from established global players in the market. |
| Slow integration of IoT technologies in some sectors | IoT-Based | Certain industries are hesitant to adopt new technologies, affecting growth. |
Japan Industrial Visualization Market Challenges
High implementation costs for advanced industrial visualization technologies can exceed several billion yen annually for manufacturers, straining budgets and limiting operational efficiency. Competition among suppliers for essential software tools increases prices, forcing buyers to delay investments or seek less effective alternatives. Many manufacturers lack skilled workers trained in industrial visualization, extending project timelines and raising training expenses. The rapid demand for IoT-based visualization tools in utilities has outstripped the supply of qualified technicians, causing delays that impact service delivery for utility providers.
Trends in the Japan Industrial Visualization Market
The shifts below are changing how Japan Industrial Visualization Market products are bought and supplied.
- Shift from Traditional to IoT-Based Visualization: The trend towards IoT-based visualization tools has gained traction, particularly in utilities, where adoption rates have exceeded 50%. This shift enables real-time data access and improves operational efficiency.
- Transition from 2D to 3D Plant Models: In 2023, the demand for 3D plant models surged as manufacturers sought to optimize factory layouts. This change is expected to drive growth in this segment.
- Emergence of Real-time Dashboards: Real-time dashboards have become essential for over 70% of manufacturing firms, improving performance monitoring capabilities. This trend reflects a growing need for immediate data access.
- Increased Focus on AR/VR for Training: The adoption of AR/VR tools for maintenance training is rising, particularly among automotive manufacturers. This trend is likely to improve training effectiveness and operational readiness.
Investment Opportunities in the Japan Industrial Visualization Market
Investors looking at the Japan Industrial Visualization Market should consider the following areas.
- Investment in 3D Plant Models: The demand for 3D plant models is currently rising, with manufacturers seeking to optimize layouts. This presents a promising investment opportunity in the market.
- Supply of IoT-Based Visualization Tools: With over 50% adoption in major cities, now is an ideal time to invest in IoT-based visualization tools. Utilities are the primary buyer group, and partnerships with local firms can facilitate entry.
- Development of Real-time Dashboards: The market for real-time dashboards is expanding, driven by critical needs in performance monitoring. Investing in this area can benefit manufacturing firms looking for immediate data access.
- Expansion of AR/VR Training Solutions: The rising interest in AR/VR tools for training creates opportunities for suppliers. Automotive manufacturers are increasingly looking for training solutions to enhance workforce skills.
Government Initiatives in the Japan Industrial Visualization Market
The GX Promotion Act (2023) is essential for buyers of industrial visualization technologies, as it establishes a framework for decarbonisation efforts. This act aims for about JPY 150 trillion of public and private investment over ten years, encouraging firms to adopt advanced technologies for energy efficiency and emissions reduction.
The Act on the Rational Use of Energy (1979) obliges large energy users to improve energy efficiency. This regulation impacts buyers by requiring them to report energy use and implement measures that may involve industrial visualization technologies.
Future Insight of the Japan Industrial Visualization Market
The rollout of IoT integration initiatives in industries will transform operational processes by 2032. The adoption of the JIS B 0126 standard will facilitate better compatibility among various technologies. With over 10,000 SCADA systems installed, manufacturers will rely more on real-time data for strategic decisions. Substantial investments in decarbonisation efforts will drive the adoption of advanced visualization technologies, delivering long-term advantages for both buyers and suppliers.
Market Segmentation Analysis
Japan Industrial Visualization Market report covers a detailed analysis of the following market segments:
By Product Type – SCADA Visualization Leads, 3D Plant Models Expected to Grow Fastest
According to Saurav Kr Singh, Senior Research Analyst at 6Wresearch, with 55% of product type revenue in 2025, SCADA Visualization was the largest category. SCADA visualization commands the largest share as it is crucial for real-time monitoring and control in Japan's manufacturing sector. With over 10,000 units installed, it plays a vital role in facilities located in major industrial areas like Tokyo and Osaka. 3D Plant Models are set to record the highest CAGR in this split, 10.9% over 2026–2032. The rapid growth of 3D plant models is fuelled by their increasing application in planning and optimizing factory layouts, essential for enhancing operational efficiency. As manufacturers focus on improving workflows, the demand for these models is projected to rise significantly. Suppliers should enhance SCADA solutions while investing in 3D modeling capabilities to meet evolving market demands.
By Visualization Tech – Real-time Dashboards Lead, IoT-Based Expected to Grow Fastest
Real-time Dashboards took 42% of visualization tech revenue in 2025, more than any other category. Real-time dashboards lead the market as they provide immediate access to critical data, facilitating operational oversight for over 70% of manufacturing firms in Japan. Their importance in performance monitoring makes them indispensable across various industrial applications. IoT-Based is projected to grow fastest, at a CAGR of 10.2% during 2026–2032. IoT-based visualization tools are rapidly gaining popularity, driven by their capacity to deliver real-time data visualisation in multiple industries. As the adoption of IoT technologies expands, this segment is set for substantial growth. Buyers should integrate IoT-based solutions to leverage real-time data for enhanced decision-making.
By Application – Utilities Control Leads, Factory Layout Planning Expected to Grow Fastest
The largest application category in 2025 was Utilities Control, at 44% of revenue. Utilities control is the top application due to its essential role in managing utility operations effectively, crucial for Japan's energy sector. The complexity of utility management increasingly demands advanced visualization technologies for operational efficiency. Over 2026–2032, Factory Layout Planning is expected to post the fastest growth, at a CAGR of 9.8%. Factory layout planning is experiencing swift growth as manufacturers aim to optimize space and workflow, particularly with Japan's focus on improving operational efficiency. This trend is expected to persist as industries adapt to changing demands. Suppliers must tailor their offerings to support utilities while addressing the rising need for factory layout optimization.
By Distribution Channel – Direct SaaS Lead and Record the Fastest Growth
Direct SaaS held 56% of the Japan Industrial Visualization Market by distribution channel in 2025. Direct SaaS is the leading distribution channel due to its accessibility and scalability, making it a preferred choice among users in the industrial visualization market. This model enables seamless integration and deployment of visualization technologies across various sectors. The same category are also set to grow fastest, at a CAGR of 8.7% during 2026–2032. The direct SaaS channel is also the fastest-growing, thanks to its convenience and the increasing shift towards cloud-based solutions in industrial applications. As more companies adopt SaaS models, this segment will continue to expand rapidly. Suppliers should prioritise SaaS offerings to align with market trends and meet customer expectations.
Key Attractiveness of the Report
- 10 Years of Market Numbers
- Historical Data Starting from 2022 to 2025
- Base Year 2025
- Forecast Data until 2032
- Key Performance Indicators Impacting the Market
- Major Upcoming Developments and Projects
Key Highlights of the Report:
- Japan Industrial Visualization Market Outlook
- Market Size of Japan Industrial Visualization Market, 2025
- Forecast of Japan Industrial Visualization Market, 2032
- Historical Data and Forecast of Japan Industrial Visualization Revenues & Volume for the Period 2022-2032F
- Japan Industrial Visualization Market Trend Evolution
- Japan Industrial Visualization Market Drivers and Challenges
- Japan Industrial Visualization Price Trends
- Japan Industrial Visualization Porter's Five Forces
- Japan Industrial Visualization Industry Life Cycle
- Historical Data and Forecast of Japan Industrial Visualization Market Revenues & Volume By Product Type for the Period 2022-2032F
- Historical Data and Forecast of Japan Industrial Visualization Market Revenues & Volume By SCADA Visualization for the Period 2022-2032F
- Historical Data and Forecast of Japan Industrial Visualization Market Revenues & Volume By 3D Plant Models for the Period 2022-2032F
- Historical Data and Forecast of Japan Industrial Visualization Market Revenues & Volume By AR/VR Visual Tools for the Period 2022-2032F
- Historical Data and Forecast of Japan Industrial Visualization Market Revenues & Volume By Data Dashboards for the Period 2022-2032F
- Historical Data and Forecast of Japan Industrial Visualization Market Revenues & Volume By Visualization Tech for the Period 2022-2032F
- Historical Data and Forecast of Japan Industrial Visualization Market Revenues & Volume By Real-time Dashboards for the Period 2022-2032F
- Historical Data and Forecast of Japan Industrial Visualization Market Revenues & Volume By CAD/CAM Integration for the Period 2022-2032F
- Historical Data and Forecast of Japan Industrial Visualization Market Revenues & Volume By Immersive Interfaces for the Period 2022-2032F
- Historical Data and Forecast of Japan Industrial Visualization Market Revenues & Volume By IoT-Based for the Period 2022-2032F
- Historical Data and Forecast of Japan Industrial Visualization Market Revenues & Volume By Application for the Period 2022-2032F
- Historical Data and Forecast of Japan Industrial Visualization Market Revenues & Volume By Utilities Control for the Period 2022-2032F
- Historical Data and Forecast of Japan Industrial Visualization Market Revenues & Volume By Factory Layout Planning for the Period 2022-2032F
- Historical Data and Forecast of Japan Industrial Visualization Market Revenues & Volume By Maintenance Training for the Period 2022-2032F
- Historical Data and Forecast of Japan Industrial Visualization Market Revenues & Volume By Performance Monitoring for the Period 2022-2032F
- Historical Data and Forecast of Japan Industrial Visualization Market Revenues & Volume By Distribution Channel for the Period 2022-2032F
- Historical Data and Forecast of Japan Industrial Visualization Market Revenues & Volume By Direct SaaS for the Period 2022-2032F
- Historical Data and Forecast of Japan Industrial Visualization Market Revenues & Volume By Engineering Vendors for the Period 2022-2032F
- Historical Data and Forecast of Japan Industrial Visualization Market Revenues & Volume By Tech Integrators for the Period 2022-2032F
- Historical Data and Forecast of Japan Industrial Visualization Market Revenues & Volume By Online Licenses for the Period 2022-2032F
- Japan Industrial Visualization Import Export Trade Statistics
- Market Opportunity Assessment By Product Type
- Market Opportunity Assessment By Visualization Tech
- Market Opportunity Assessment By Application
- Market Opportunity Assessment By Distribution Channel
- Japan Industrial Visualization Top Companies Market Share
- Japan Industrial Visualization Competitive Benchmarking By Technical and Operational Parameters
- Japan Industrial Visualization Company Profiles
- Japan Industrial Visualization Key Strategic Recommendations
Market Covered
The following segment groups are covered in the report.
By Product Type
- SCADA Visualization
- 3D Plant Models
- AR/VR Visual Tools
- Data Dashboards
By Visualization Tech
- Real-time Dashboards
- CAD/CAM Integration
- Immersive Interfaces
- IoT-Based
By Application
- Utilities Control
- Factory Layout Planning
- Maintenance Training
- Performance Monitoring
By Distribution Channel
- Direct SaaS
- Engineering Vendors
- Tech Integrators
- Online Licenses































