Japan Quick Service Restaurant Ecosystem Market Size & Growth Rate
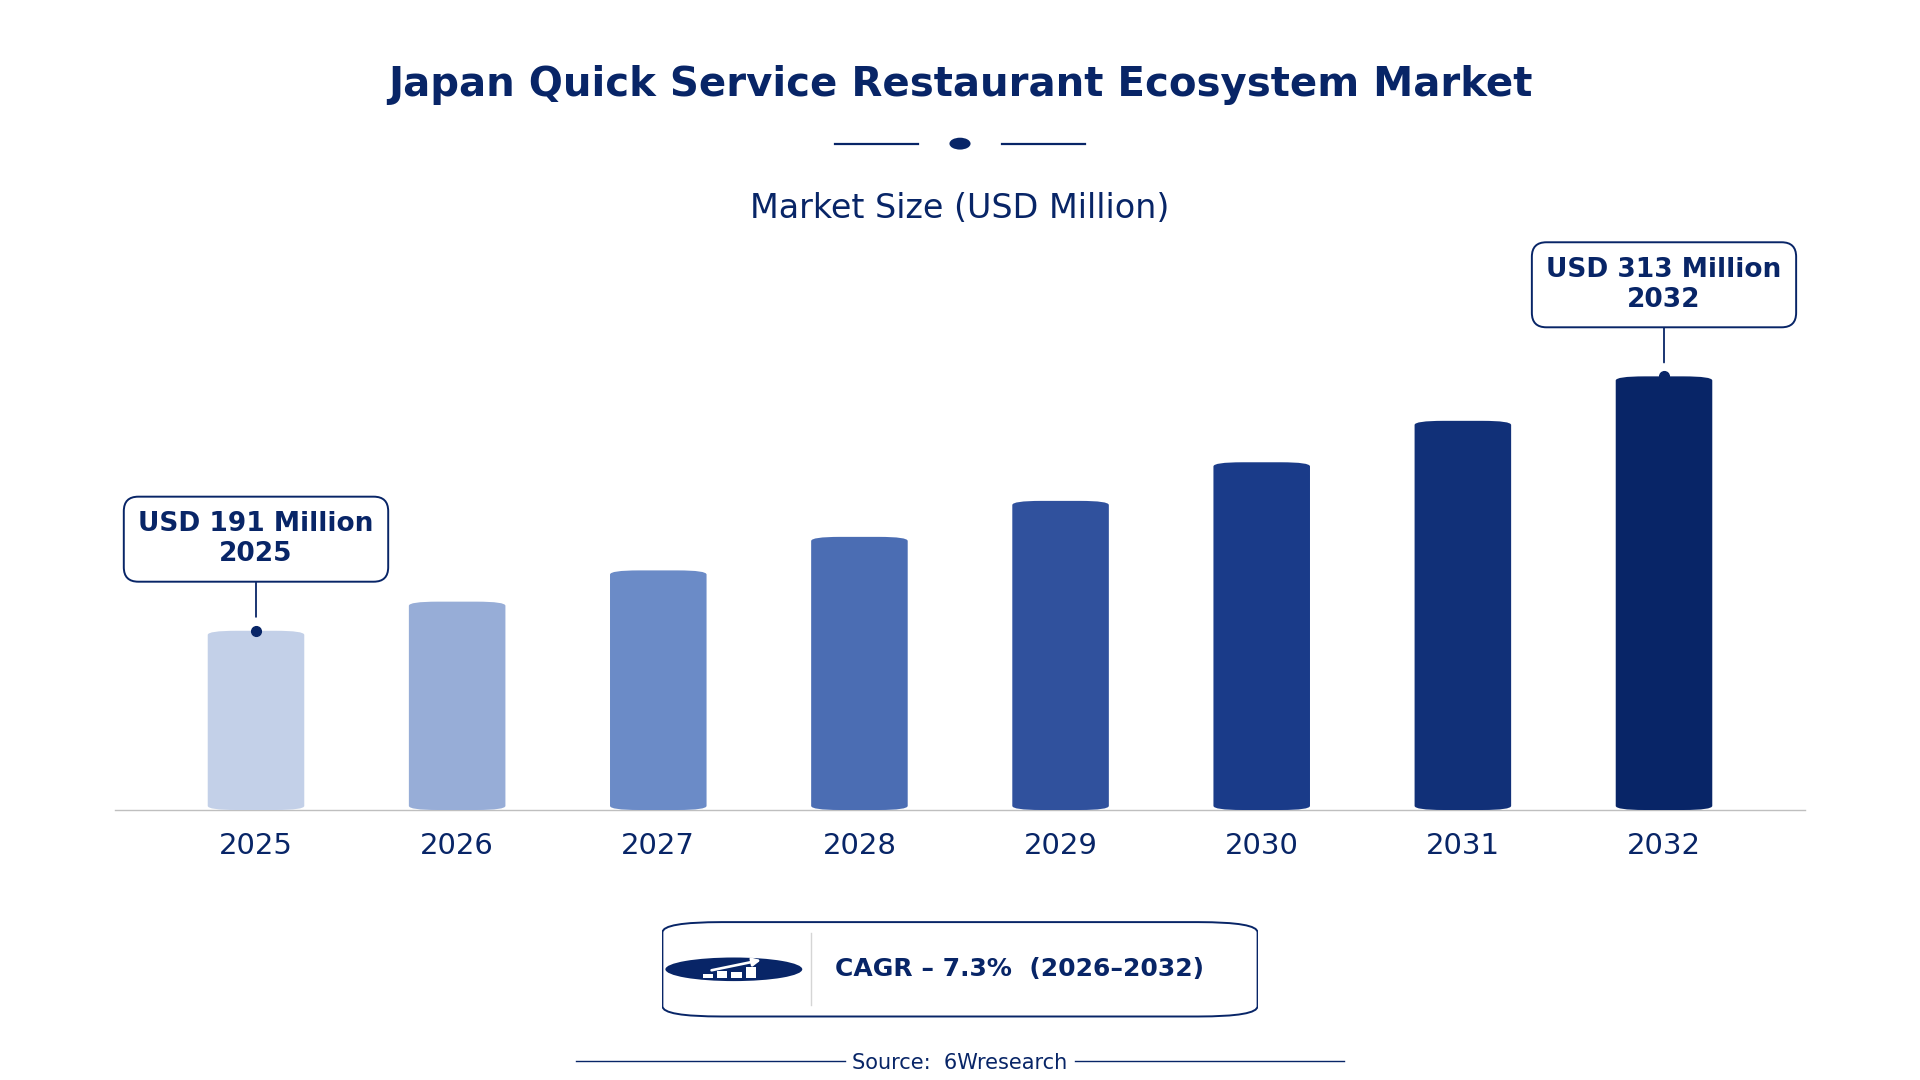
According to 6Wresearch internal database and industry insights, the Japan Quick Service Restaurant Ecosystem Market was valued at USD 191 Million in 2025 and is projected to reach USD 313 Million by 2032, growing at a CAGR of approximately 7.3% during 2026–2032.
Japan Quick Service Restaurant Ecosystem Market Highlights
| Report Metric | Details |
| Report Name | Japan Quick Service Restaurant Ecosystem Market (2026-2032) |
| Market Size 2025 | USD 191 Million |
| Market Size 2032 | USD 313 Million |
| Absolute Growth 2025–2032 | USD 122 Million |
| CAGR 2026–2032 | 7.3% |
| Peak Annual Growth | 7.8% in 2028 |
| Forecast Period | 2026–2032 |
| Historical Data | 2022–2025 |
| Base Year | 2025 |
| Leading Service Type, 2025 | Food Delivery Apps (45% share) |
| Leading Functionality, 2025 | Order Management (39% share) |
| Leading Application Area, 2025 | Restaurants (42% share) |
| Leading Distribution Channel, 2025 | Online Platforms (35% share) |
| Leading End User, 2025 | QSR Chains (42% share) |
| Fastest-Growing Functionality | Customer Engagement (9.3% CAGR) |
| Fastest-Growing Application Area | Kitchens (8.6% CAGR) |
| Fastest-Growing Distribution Channel | SaaS Platforms (9.5% CAGR) |
| Fastest-Growing End User | Franchise Owners (9.2% CAGR) |
| Growing Sector | Quick Service Restaurants |
| Key End Users | QSR Chains, Franchise Owners, Restaurant Managers, Consumers |
Japan Quick Service Restaurant Ecosystem Market Year-wise Growth Rate and Key Drivers (2022–2032)
This graph illustrates the annual growth rates of the market from 2022 to 2032, highlighting a steady upward trajectory and projected market expansion over the forecast period.
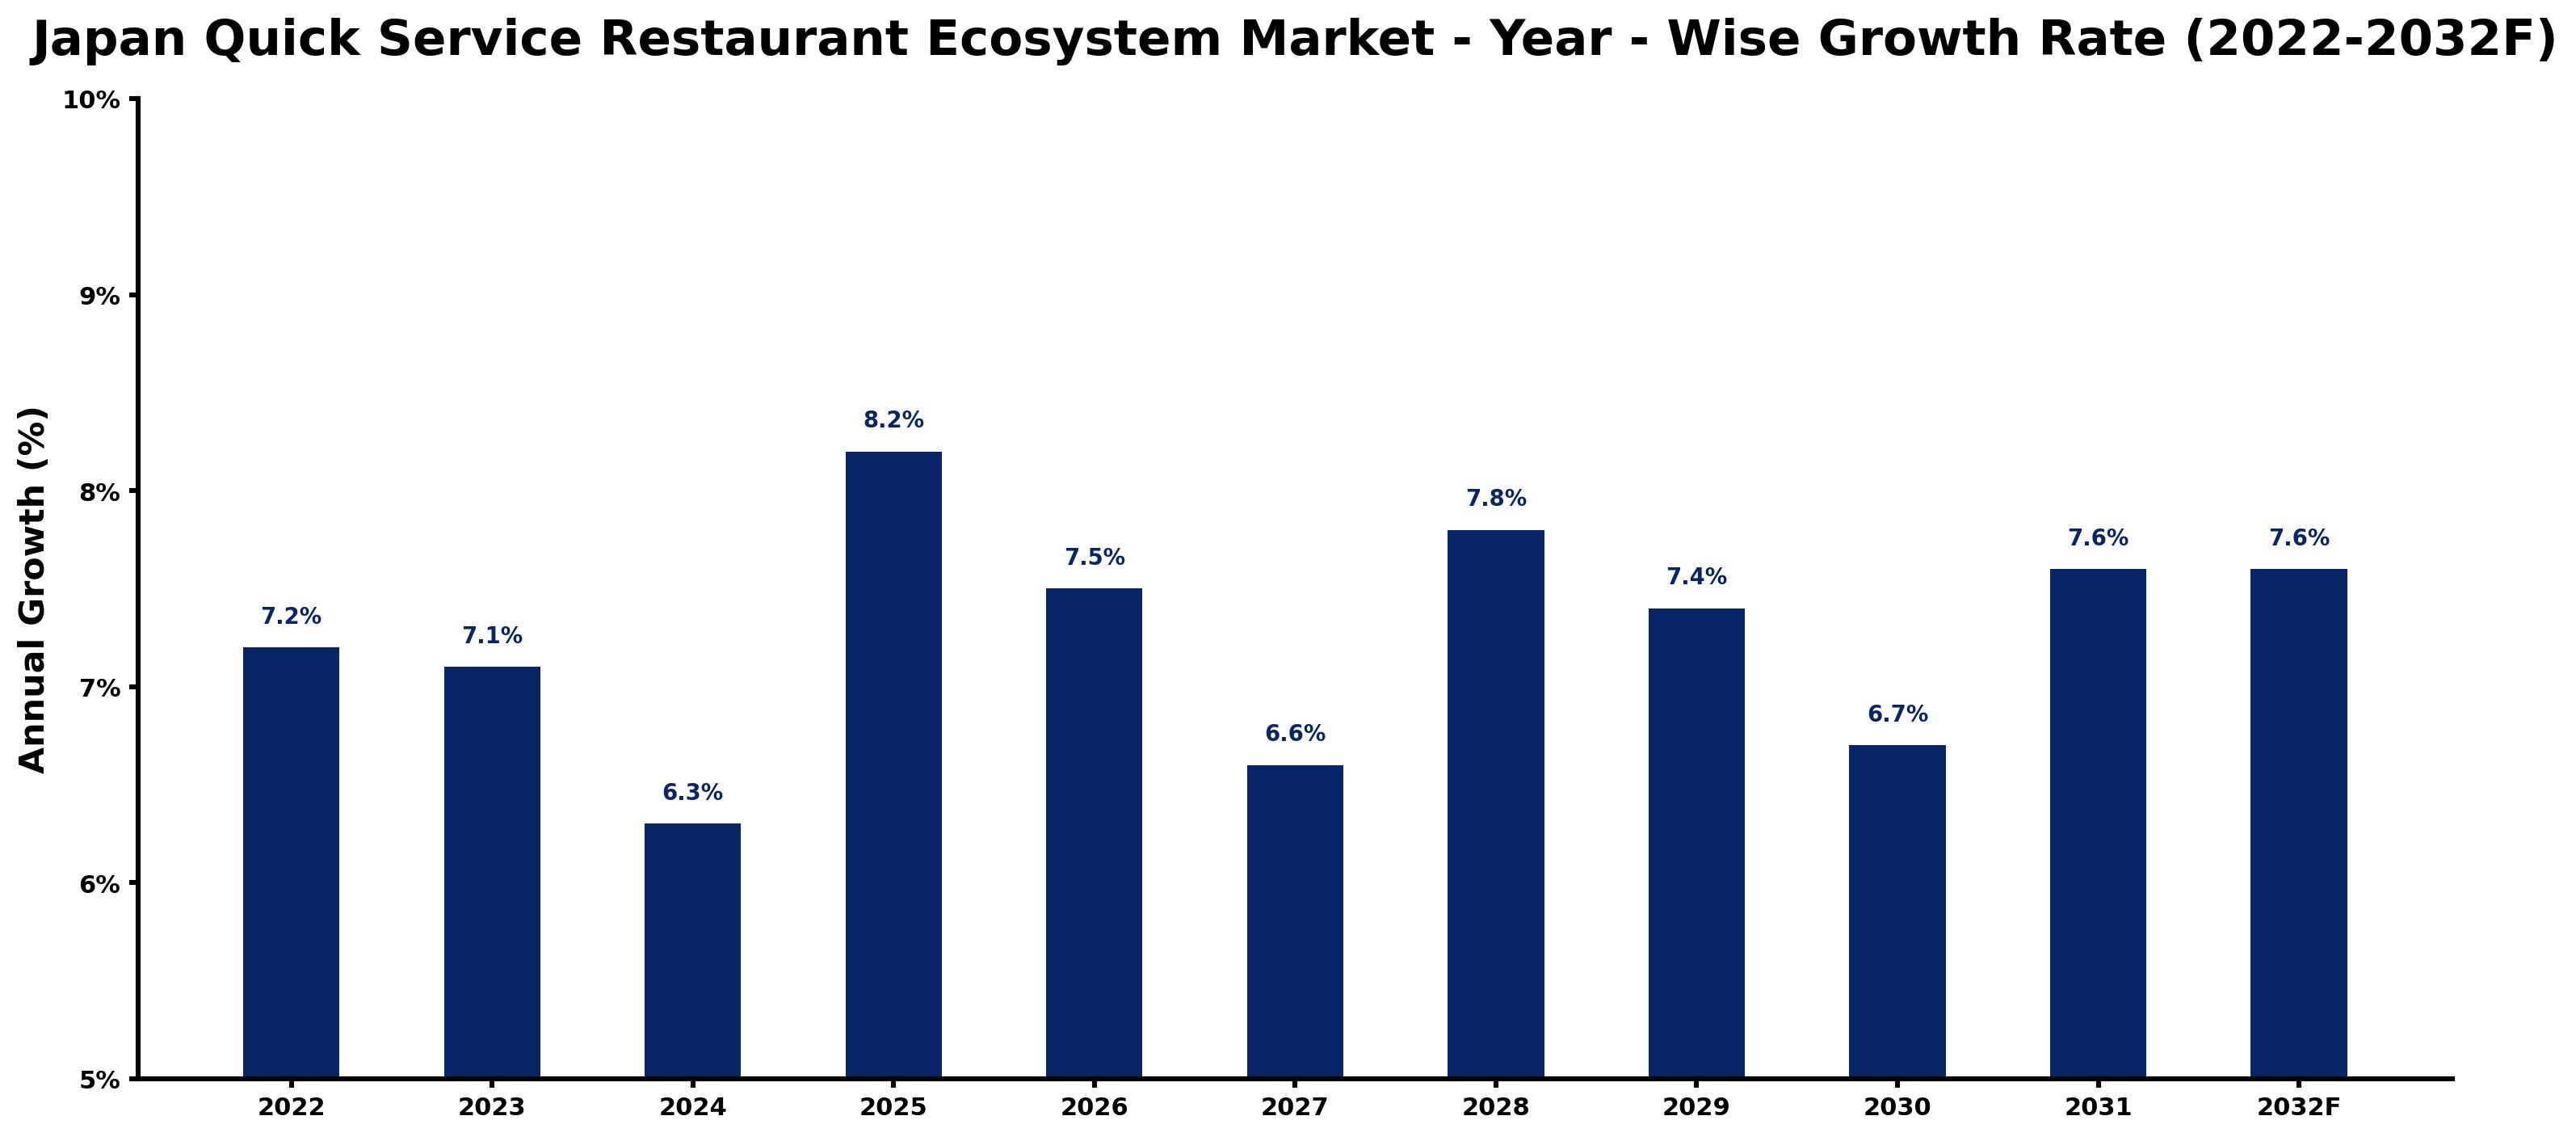
For each year, the table pairs the estimated growth rate with the leading influence on demand, showing how the drivers changed across the period.
| Year | Estimated Annual Growth (%) | Market Rationale |
| 2022 | 7.2 | The market experienced steady growth due to rising consumer interest in fast food. |
| 2023 | 7.1 | Growth slowed slightly as inflationary pressures affected consumer spending habits. |
| 2024 | 6.3 | The market continued to grow but at a slower pace amid economic uncertainties. |
| 2025 | 8.2 | Growth accelerated as consumer demand surged, driven by increased urbanisation. |
| 2026 | 7.5 | A slowdown occurred as market saturation began to impact growth rates. |
| 2027 | 6.6 | Demand continued to grow, albeit at a reduced rate, reflecting market maturity. |
| 2028 | 7.8 | Growth picked up again, supported by technological advancements in QSR operations. |
| 2029 | 7.4 | A slowdown was observed as competition intensified among QSR providers. |
| 2030 | 6.7 | The market grew more slowly as consumer preferences shifted towards healthier options. |
| 2031 | 7.6 | Growth rebounded as new technology adoption revitalised the sector. |
| 2032 | 7.6 | The market maintained its growth, driven by ongoing digital transformation. |
Note: Market size estimations and growth projections presented in this report are based on 6Wresearch's proprietary forecasting methodology, utilizing the latest available industry data, government publications, and primary research inputs.
Japan Quick Service Restaurant Ecosystem Market Synopsis
The Quick Service Restaurant Ecosystem Market in Japan encompasses technology and services that streamline operations in fast-food establishments. Valued at approximately 5 trillion JPY annually, the market sees demand from local consumers and international tourism. The adoption of food delivery apps surged by 40% since 2022, while government support for digital transformation drives further growth. Urban areas account for 80% of QSR sales, reflecting a strong focus on technology solutions that improve customer experience and operational efficiency.
Market Dynamics Impact Analysis (2026–2032)
| Factor | Type | Impact | Primary Segment Affected |
| Growing consumer preference for convenience and speed in dining options | Driver | High | Food Delivery Apps |
| Increased investment in technology solutions by franchise owners | Driver | High | POS Solutions |
| Expansion of urban areas leading to higher QSR establishment density | Opportunity | High | Restaurants |
| Rising demand for cloud-based services to enhance operational efficiency | Opportunity | High | Cloud-based Services |
| Regulatory compliance costs associated with food safety standards | Restraint | Medium | Inventory Management |
| Market saturation in urban areas limiting new QSR openings | Restraint | Medium | Restaurants |
| Intense competition among QSR chains affecting pricing strategies | Challenge | High | QSR Chains |
| Supply chain disruptions impacting inventory management and delivery | Challenge | High | Food Delivery Apps |
Evaluation of Drivers in Japan Quick Service Restaurant Ecosystem Market (2026–2032)
The table below links each growth driver to the segment it affects and the evidence for it.
| Drivers | Primary Segment Affected | Why It Matters (Evidence) |
| Increased consumer visits to QSRs, averaging three times a week | Restaurants | This frequency drives demand for efficient order management systems, leading to higher sales. |
| The rise of food delivery apps, with a 40% increase in usage since 2022 | Food Delivery Apps | This trend compels QSRs to invest in technology to reach more customers. |
| The average QSR spends about 1 million JPY annually on technology solutions | POS Solutions | This investment is necessary for maintaining competitive advantage and operational efficiency. |
| Cloud-based services adoption increased by 30% in 2023 | Cloud-based Services | This growing trend allows QSRs to manage operations remotely and effectively. |
| Loyalty programs utilized by 60% of QSRs to improve retention | Customer Engagement | These programs encourage repeat business, vital for sustaining revenue in a competitive market. |
A wider customer base explains much of the growth, as Tokyo boasts over 10,000 QSR establishments, boosting demand for technology solutions. Consumers visit QSRs three times weekly, driving the need for efficient order management systems. The average QSR spends approximately 1 million JPY annually on technology solutions, which is necessary for operational efficiency. The adoption of food delivery apps has surged by 40% since 2022, prompting QSRs to invest in digital platforms. Urban areas account for 80% of QSR sales, reflecting a shift in consumer preferences towards convenience and speed.
Evaluation of Restraints in Japan Quick Service Restaurant Ecosystem Market
The following restraints limit how fast demand can grow.
| Market Restraint | Primary Segment Affected | Why It Matters (Evidence) |
| Compliance costs associated with the Food Sanitation Act | Inventory Management | These costs limit resources for technology investment, affecting operational efficiency. |
| Market saturation in urban areas limiting new QSR openings | Restaurants | This saturation restricts growth opportunities for existing QSRs, impacting overall market expansion. |
| Increased operational costs due to rising minimum wage in Japan | POS Solutions | Higher labour costs reduce profit margins for QSRs, limiting their ability to invest in technology. |
| Supply chain disruptions affecting inventory management | Food Delivery Apps | These disruptions lead to delays and increased costs, impacting service delivery and customer satisfaction. |
| Intense competition among QSR chains leading to price wars | QSR Chains | This competition erodes profit margins, making it challenging for QSRs to sustain growth. |
Japan Quick Service Restaurant Ecosystem Market Challenges
High turnover rates create skills shortages for producers, leading to increased training costs and operational inefficiencies that can raise expenses by up to 15%. Intense competition among QSRs reduces profit margins, forcing many to cut staff hours, which delays service and diminishes customer satisfaction. Rapid technological advancements necessitate continuous investment, with QSRs averaging 1 million JPY annually on technology solutions, straining budgets and limiting growth potential. Supply chain disruptions, intensified by urban demand, can delay deliveries, causing potential food waste for buyers reliant on timely inventory management, costing them approximately 10% of their annual revenue.
Trends in the Japan Quick Service Restaurant Ecosystem Market
The following changes are redrawing the Japan Quick Service Restaurant Ecosystem Market.
- Shift from Traditional Dining to Food Delivery Services: Since 2022, the trend towards food delivery services has accelerated, with a 40% increase in usage. This shift is evident in urban areas, where convenience is paramount, prompting QSRs to adapt their business models.
- Increase in Technology Adoption for Operational Efficiency: In 2023, cloud-based services adoption rose by 30%, highlighting a shift towards technology-driven operations. This trend is reshaping how QSRs manage their processes, resulting in improved service delivery.
- Growing Importance of Customer Engagement Initiatives: In 2023, customer engagement initiatives increased customer satisfaction ratings by 20%. This focus on building relationships is essential for retaining customers in a competitive market.
- Expansion of Loyalty Programs in QSRs: By 2023, 60% of QSRs implemented loyalty programs to improve customer retention. This trend reflects a strategic move to encourage repeat business and increase overall sales.
Investment Opportunities in the Japan Quick Service Restaurant Ecosystem Market
The following areas offer the clearest openings for investors and suppliers in the Japan Quick Service Restaurant Ecosystem Market.
- Franchise Owners Seeking Technology Solutions: Franchise owners are increasingly investing in technology, with 70% adopting new systems in 2023. This presents an opportunity for suppliers to offer tailored solutions to improve operational efficiency.
- High QSR Density in Urban Areas: Urban areas account for 80% of QSR sales, creating a demand for advanced inventory management systems. Suppliers can enter this market by partnering with local QSR chains.
- Supply of Cloud-Based Services for QSRs: With a 30% increase in cloud-based service adoption, there is a growing need for scalable solutions. Providers can target QSR chains looking to improve their operational capabilities.
- Investment in Customer Engagement Technologies: As 60% of QSRs utilize loyalty programs, there is a demand for advanced customer analytics tools. Suppliers can capitalize on this trend by offering tailored solutions to improve customer retention.
Government Initiatives in the Japan Quick Service Restaurant Ecosystem Market
The Food Sanitation Act amendment introduced in 2018 mandates HACCP-based hygiene management for food businesses. This law ensures that QSRs maintain high safety standards, impacting their operational practices and compliance costs. Additionally, the Food Recycling Law requires QSRs to manage food waste effectively, influencing their operational strategies and sustainability efforts.
The Digital Agency oversees government digital transformation initiatives, funding projects aimed at improving technology adoption in the food service sector. This support assists QSRs in their transition to modern operational frameworks, improving their efficiency and competitiveness.
Future Insight of the Japan Quick Service Restaurant Ecosystem Market
Government initiatives will drive technology adoption in QSRs, prompting suppliers to innovate their offerings. New digital transformation programs will improve operational efficiency, particularly in metropolitan regions where 80% of sales occur. As consumer preferences evolve, QSRs will increasingly utilise data-driven strategies to engage customers, directing substantial budgets to online channels. The rise of food delivery services will continue, with a 40% increase in usage reported since 2023, reshaping market dynamics and enhancing customer accessibility.
Market Segmentation Analysis
Japan Quick Service Restaurant Ecosystem Market report covers a detailed analysis of the following market segments:
By Service Type – Food Delivery Apps Lead and Record the Fastest Growth
According to Ayushi Shukla, Senior Research Analyst at 6Wresearch, Food Delivery Apps accounted for 45% of the market by service type in 2025. Food delivery apps hold the largest share as they are crucial for reaching customers outside restaurant premises, particularly in urban areas where convenience is paramount. The significant 40% increase in usage since 2022 underscores their importance in the QSR ecosystem. Food Delivery Apps are also forecast to expand faster than any other category, at a CAGR of 9.6% over 2026–2032. The rapid growth of food delivery apps is fuelled by consumers increasingly prioritising convenience in their dining choices. This shift is evidenced by the substantial rise in app usage, indicating a strong market trajectory. Suppliers should focus on enhancing app functionalities to meet the rising expectations of consumers.
By Functionality – Order Management Leads, Customer Engagement Expected to Grow Fastest
Order Management took 39% of functionality revenue in 2025, more than any other category. Order management systems dominate the market due to their essential role in efficiently processing customer orders, which is vital for the smooth operation of QSRs. Their widespread adoption highlights the critical need for operational efficiency in fast-paced food service environments. Customer Engagement is set to record the highest CAGR in this split, 9.3% over 2026–2032. Customer engagement functionalities are gaining momentum as QSRs recognise the importance of building strong relationships with their patrons. This trend is supported by a 20% increase in customer satisfaction ratings linked to engagement initiatives in 2023. Investing in customer engagement tools will be crucial for QSRs aiming to boost loyalty and encourage repeat business.
By Application Area – Restaurants Lead, Kitchens Expected to Grow Fastest
With 42% of application area revenue in 2025, Restaurants was the largest category. Restaurants are the primary application area for QSR solutions, serving as the core establishments where these technologies are implemented. The high concentration of QSRs, especially in urban settings, emphasises the significance of this segment. Over 2026–2032, Kitchens are expected to post the fastest growth, at a CAGR of 8.6%. Kitchens are emerging as the fastest-growing application area, driven by the need for enhanced operational efficiency in food preparation. As QSRs seek to optimise kitchen processes, this segment is set for rapid growth. Suppliers should tailor solutions specifically for kitchen operations to capitalise on this growth opportunity.
By Distribution Channel – Online Platforms Lead, SaaS Platforms Expected to Grow Fastest
In 2025, Online Platforms led the distribution channel split with a 35% share. Online platforms lead the distribution channel segment by facilitating digital ordering and enhancing customer engagement within the QSR market. Their role in streamlining operations has made them essential for modern QSRs. SaaS Platforms are projected to grow fastest, at a CAGR of 9.5% during 2026–2032. SaaS platforms are experiencing rapid growth as they provide scalable solutions that meet the evolving needs of QSRs. Their flexibility and ease of integration with existing systems are driving this swift adoption. Suppliers must enhance their SaaS offerings to attract more QSR clients seeking adaptable solutions.
By End User – QSR Chains Lead, Franchise Owners Expected to Grow Fastest
The largest end user category in 2025 was QSR Chains, at 42% of revenue. QSR chains represent the largest user group of QSR technologies, leveraging these systems to improve operational efficiency and customer service. Their extensive network of establishments necessitates robust technological support to maintain competitiveness. The quickest growth will come from Franchise Owners, forecast to expand at a CAGR of 9.2% between 2026 and 2032. Franchise owners are increasingly adopting new technologies, reflecting their vital role in the QSR ecosystem. This trend is highlighted by the 70% adoption rate of new systems among franchise owners in 2023. Suppliers should focus on developing tailored solutions that specifically address the needs of franchise owners.
Key Attractiveness of the Report
- 10 Years of Market Numbers
- Historical Data Starting from 2022 to 2025
- Base Year 2025
- Forecast Data until 2032
- Key Performance Indicators Impacting the Market
- Major Upcoming Developments and Projects
Key Highlights of the Report:
- Japan Quick Service Restaurant Ecosystem Market Outlook
- Market Size of Japan Quick Service Restaurant Ecosystem Market, 2025
- Forecast of Japan Quick Service Restaurant Ecosystem Market, 2032
- Historical Data and Forecast of Japan Quick Service Restaurant Ecosystem Market Revenues & Volume for the Period 2022-2032F
- Japan Quick Service Restaurant Ecosystem Market Trend Evolution
- Japan Quick Service Restaurant Ecosystem Market Drivers and Challenges
- Japan Quick Service Restaurant Ecosystem Market Price Trends
- Japan Quick Service Restaurant Ecosystem Market Porter's Five Forces
- Japan Quick Service Restaurant Ecosystem Market Industry Life Cycle
- Historical Data and Forecast of Japan Quick Service Restaurant Ecosystem Market Revenues & Volume By Service Type for the Period 2022-2032F
- Historical Data and Forecast of Japan Quick Service Restaurant Ecosystem Market Revenues & Volume By POS Solutions for the Period 2022-2032F
- Historical Data and Forecast of Japan Quick Service Restaurant Ecosystem Market Revenues & Volume By Food Delivery Apps for the Period 2022-2032F
- Historical Data and Forecast of Japan Quick Service Restaurant Ecosystem Market Revenues & Volume By Inventory Management for the Period 2022-2032F
- Historical Data and Forecast of Japan Quick Service Restaurant Ecosystem Market Revenues & Volume By Customer Analytics for the Period 2022-2032F
- Historical Data and Forecast of Japan Quick Service Restaurant Ecosystem Market Revenues & Volume By Functionality for the Period 2022-2032F
- Historical Data and Forecast of Japan Quick Service Restaurant Ecosystem Market Revenues & Volume By Order Management for the Period 2022-2032F
- Historical Data and Forecast of Japan Quick Service Restaurant Ecosystem Market Revenues & Volume By Customer Engagement for the Period 2022-2032F
- Historical Data and Forecast of Japan Quick Service Restaurant Ecosystem Market Revenues & Volume By Stock Tracking for the Period 2022-2032F
- Historical Data and Forecast of Japan Quick Service Restaurant Ecosystem Market Revenues & Volume By Loyalty Programs for the Period 2022-2032F
- Historical Data and Forecast of Japan Quick Service Restaurant Ecosystem Market Revenues & Volume By Application Area for the Period 2022-2032F
- Historical Data and Forecast of Japan Quick Service Restaurant Ecosystem Market Revenues & Volume By Restaurants for the Period 2022-2032F
- Historical Data and Forecast of Japan Quick Service Restaurant Ecosystem Market Revenues & Volume By Urban Areas for the Period 2022-2032F
- Historical Data and Forecast of Japan Quick Service Restaurant Ecosystem Market Revenues & Volume By Kitchens for the Period 2022-2032F
- Historical Data and Forecast of Japan Quick Service Restaurant Ecosystem Market Revenues & Volume By Marketing for the Period 2022-2032F
- Historical Data and Forecast of Japan Quick Service Restaurant Ecosystem Market Revenues & Volume By Distribution Channel for the Period 2022-2032F
- Historical Data and Forecast of Japan Quick Service Restaurant Ecosystem Market Revenues & Volume By SaaS Platforms for the Period 2022-2032F
- Historical Data and Forecast of Japan Quick Service Restaurant Ecosystem Market Revenues & Volume By Online Platforms for the Period 2022-2032F
- Historical Data and Forecast of Japan Quick Service Restaurant Ecosystem Market Revenues & Volume By Direct Sales for the Period 2022-2032F
- Historical Data and Forecast of Japan Quick Service Restaurant Ecosystem Market Revenues & Volume By Cloud-based Services for the Period 2022-2032F
- Historical Data and Forecast of Japan Quick Service Restaurant Ecosystem Market Revenues & Volume By End User for the Period 2022-2032F
- Historical Data and Forecast of Japan Quick Service Restaurant Ecosystem Market Revenues & Volume By QSR Chains for the Period 2022-2032F
- Historical Data and Forecast of Japan Quick Service Restaurant Ecosystem Market Revenues & Volume By Consumers for the Period 2022-2032F
- Historical Data and Forecast of Japan Quick Service Restaurant Ecosystem Market Revenues & Volume By Restaurant Managers for the Period 2022-2032F
- Historical Data and Forecast of Japan Quick Service Restaurant Ecosystem Market Revenues & Volume By Franchise Owners for the Period 2022-2032F
- Japan Quick Service Restaurant Ecosystem Market Import Export Trade Statistics
- Market Opportunity Assessment By Service Type
- Market Opportunity Assessment By Functionality
- Market Opportunity Assessment By Application Area
- Market Opportunity Assessment By Distribution Channel
- Market Opportunity Assessment By End User
- Japan Quick Service Restaurant Ecosystem Market Top Companies Market Share
- Japan Quick Service Restaurant Ecosystem Market Competitive Benchmarking By Technical and Operational Parameters
- Japan Quick Service Restaurant Ecosystem Market Company Profiles
- Japan Quick Service Restaurant Ecosystem Market Key Strategic Recommendations
Market Covered
The following segment groups are covered in the report.
By Service Type
- POS Solutions
- Food Delivery Apps
- Inventory Management
- Customer Analytics
By Functionality
- Order Management
- Customer Engagement
- Stock Tracking
- Loyalty Programs
By Application Area
- Restaurants
- Urban Areas
- Kitchens
- Marketing
By Distribution Channel
- SaaS Platforms
- Online Platforms
- Direct Sales
- Cloud-based Services
By End User
- QSR Chains
- Consumers
- Restaurant Managers
- Franchise Owners