Japan Surface Combatant Market Size & Growth Rate
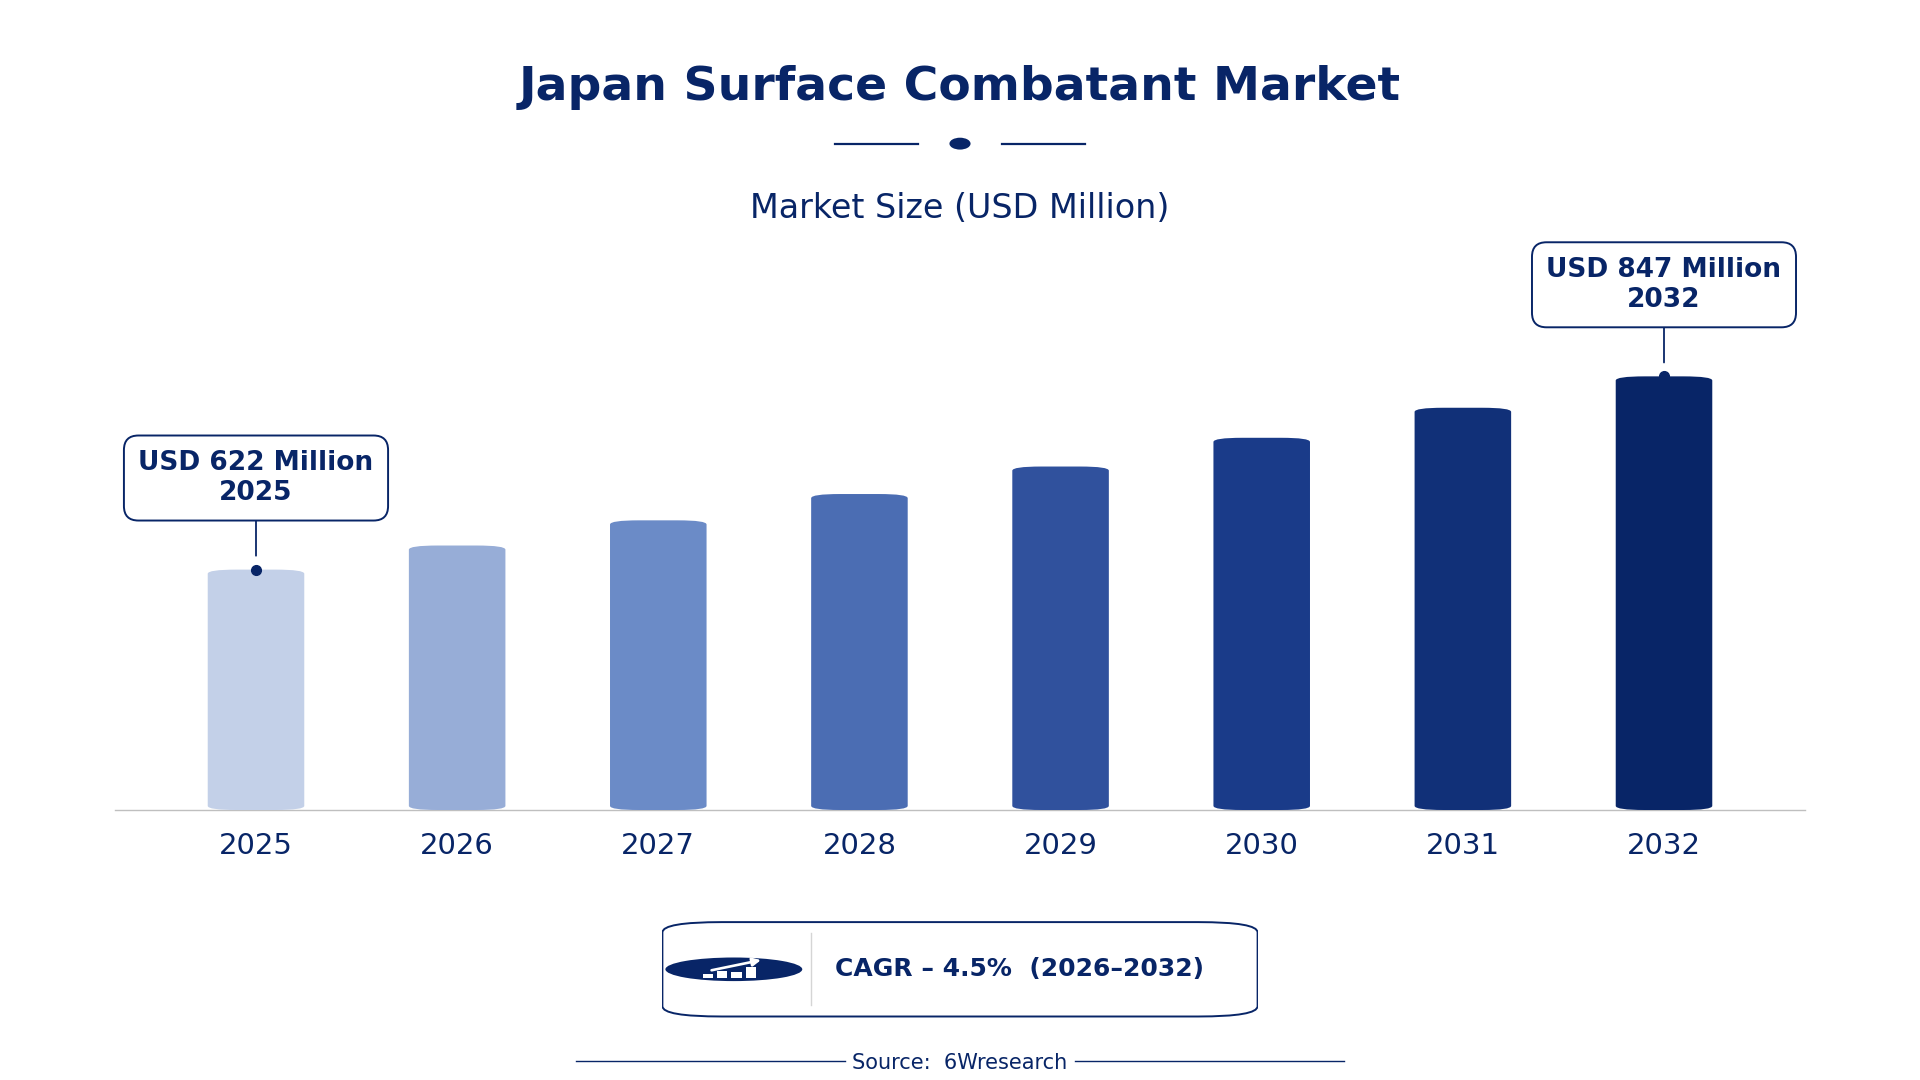
According to 6Wresearch internal database and industry insights, the Japan Surface Combatant Market was valued at USD 622 Million in 2025 and is projected to reach USD 847 Million by 2032, growing at a CAGR of approximately 4.5% during 2026–2032.
Japan Surface Combatant Market Highlights
| Report Metric | Details |
| Report Name | Japan Surface Combatant Market (2026-2032) |
| Market Size 2025 | USD 622 Million |
| Market Size 2032 | USD 847 Million |
| Absolute Growth 2025–2032 | USD 225 Million |
| CAGR 2026–2032 | 4.5% |
| Peak Annual Growth | 5.7% in 2029 |
| Forecast Period | 2026–2032 |
| Historical Data | 2022–2025 |
| Base Year | 2025 |
| Leading Type, 2025 | Destroyer (67% share) |
| Leading Application, 2025 | Naval Operations (54% share) |
| Leading Component, 2025 | Weapon Systems (69% share) |
| Leading End User, 2025 | Military (56% share) |
| Fastest-Growing Type | Frigate (5.8% CAGR) |
| Fastest-Growing Application | Defense Operations (5.6% CAGR) |
| Fastest-Growing End User | Government (5.5% CAGR) |
| Growing Sector | Naval Operations |
| Key End Users | Military, Government, Defense Contractors |
Japan Surface Combatant Market Year-wise Growth Rate and Key Drivers (2022–2032)
This graph illustrates the annual growth rates of the market from 2022 to 2032, highlighting a steady upward trajectory and projected market expansion over the forecast period.
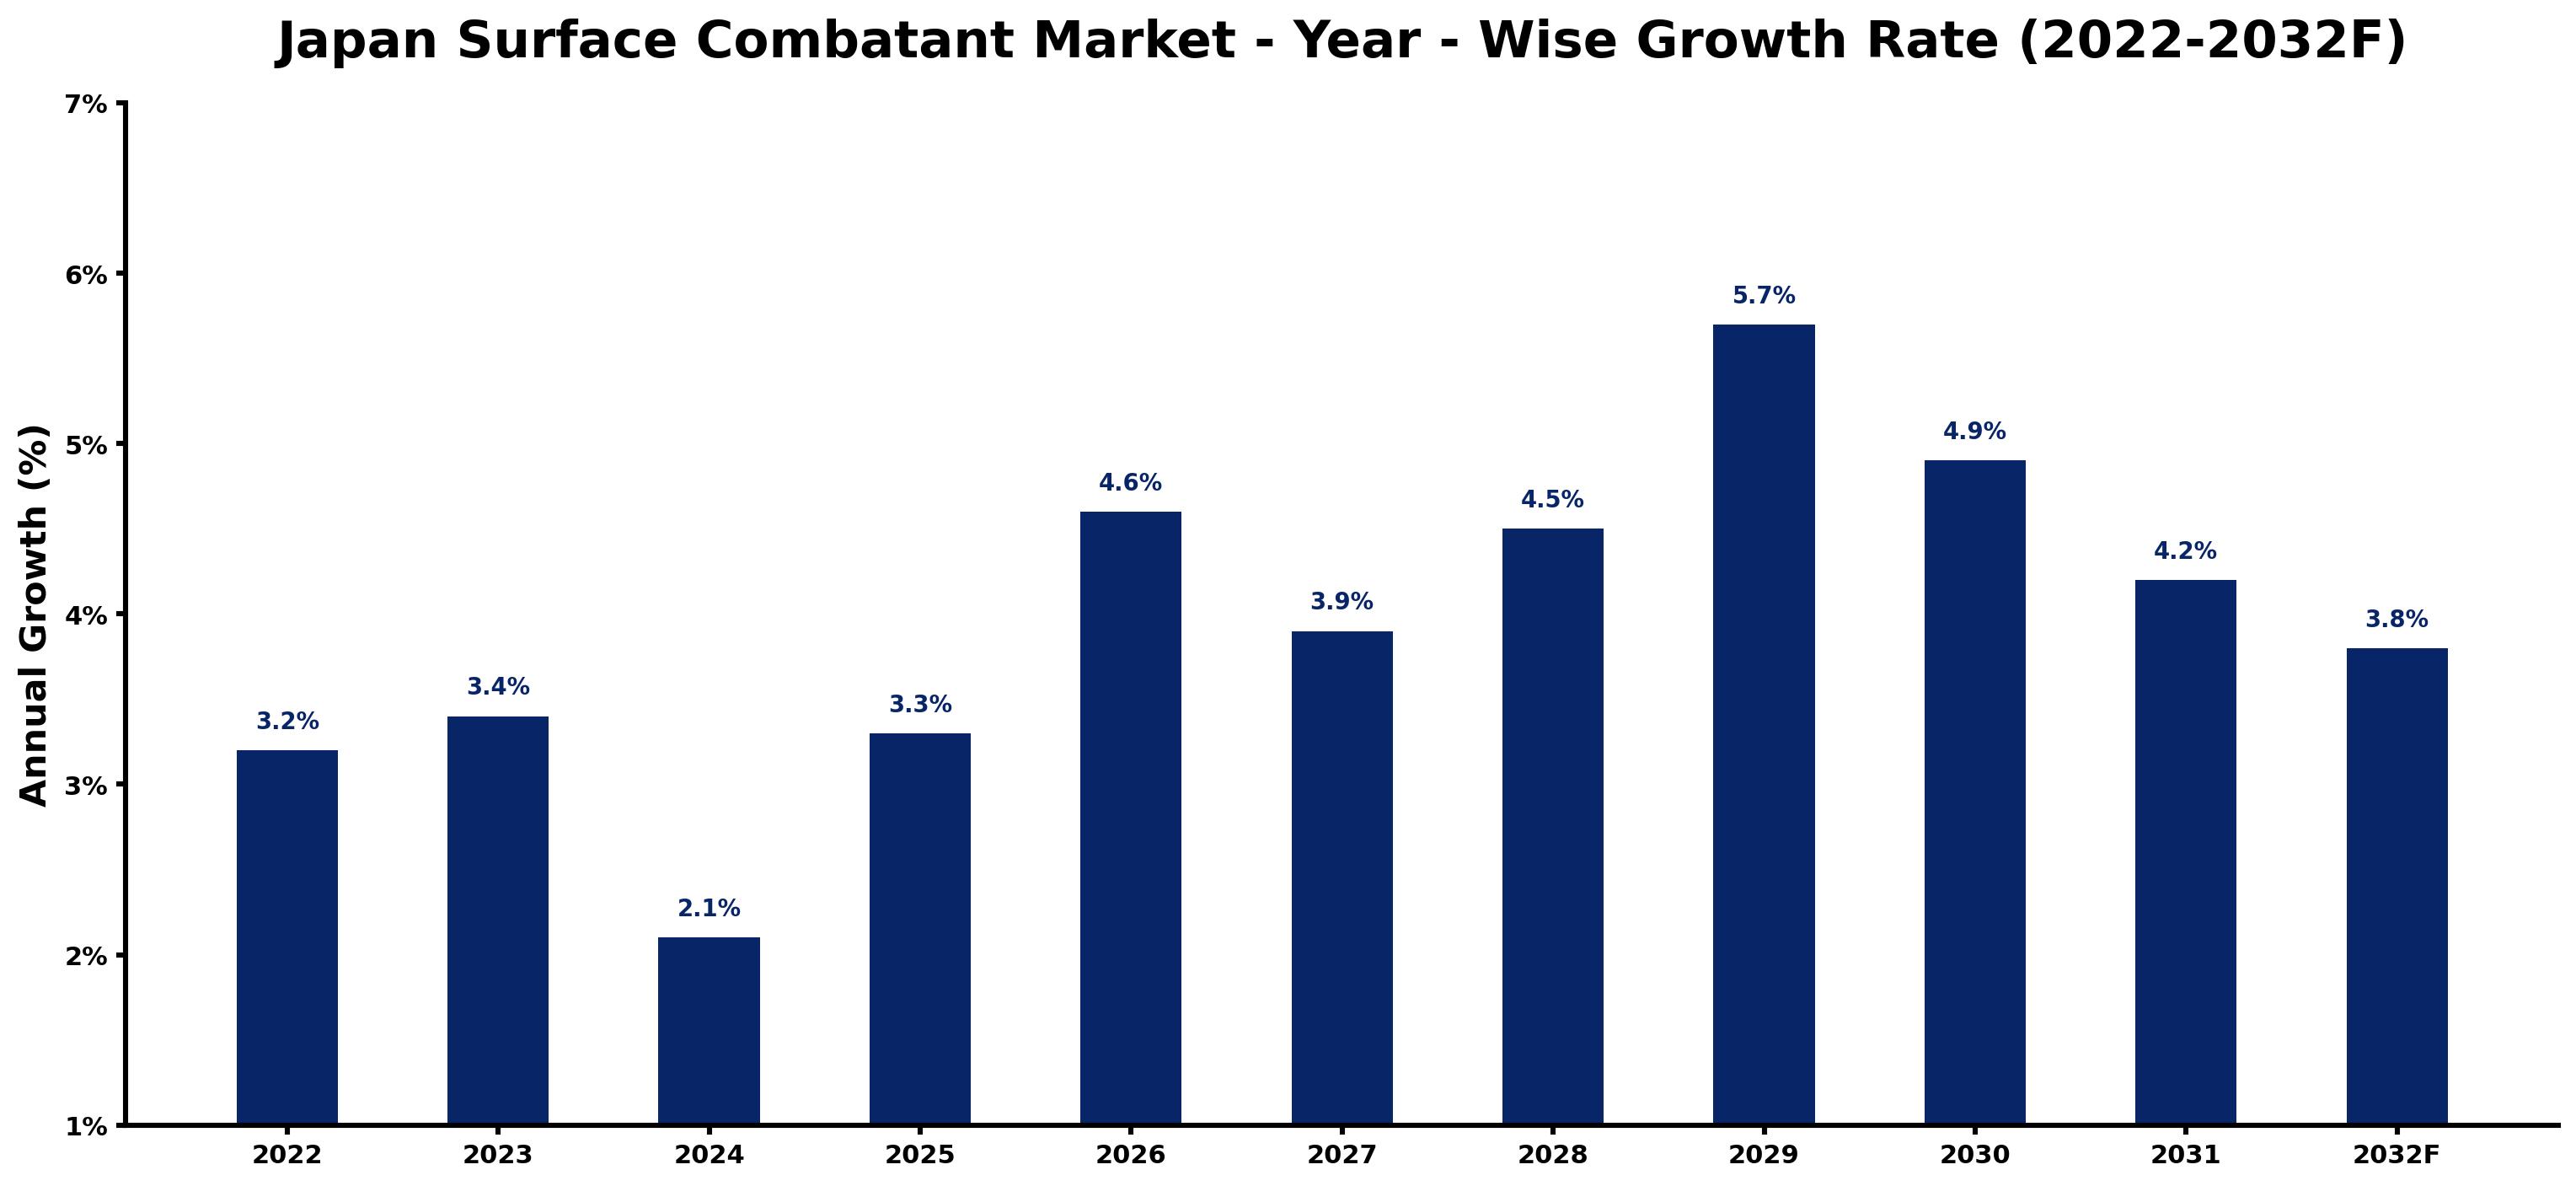
Below, each year's estimated growth is shown next to the factor that most influenced it.
| Year | Estimated Annual Growth (%) | Market Rationale |
| 2022 | 3.2 | The market experienced moderate growth due to ongoing national defense initiatives. |
| 2023 | 3.4 | Demand increased as Japan allocated ¥5 trillion for defense spending, improving naval capabilities. |
| 2024 | 2.1 | Growth slowed as procurement processes adjusted to new strategic priorities. |
| 2025 | 3.3 | Investment in naval operations accelerated, driven by regional security concerns and alliances. |
| 2026 | 4.6 | The market is expected to expand as Japan focuses on improving interoperability with U.S. naval forces. |
| 2027 | 3.9 | Growth is projected to slow slightly as the market adjusts to the previous year's surge in demand. |
| 2028 | 4.5 | Demand is expected to rise again, supported by increased participation in joint naval exercises. |
| 2029 | 5.7 | The market will peak with significant investments in advanced naval technologies and systems. |
| 2030 | 4.9 | Growth is projected to decelerate as the market stabilises after the peak year. |
| 2031 | 4.2 | Demand will continue to slow as strategic planning for future naval capabilities takes shape. |
| 2032 | 3.8 | The market is expected to maintain steady growth driven by ongoing defense commitments. |
Note: Market size estimations and growth projections presented in this report are based on 6Wresearch's proprietary forecasting methodology, utilizing the latest available industry data, government publications, and primary research inputs.
Japan Surface Combatant Market Synopsis
Surface combatants are naval vessels designed for warfare, primarily constructed using advanced materials and technologies. Their main uses include naval defense and maritime security. The Japan Surface Combatant Market is growing due to increased defense spending, with ¥5 trillion allocated in 2023, and a strategy to improve maritime security in the Indo-Pacific. The military remains the primary buyer group, driving demand for advanced naval capabilities and interoperability with allied forces.
Market Dynamics Impact Analysis (2026–2032)
| Factor | Type | Impact | Primary Segment Affected |
| Increased defense spending | Driver | High | Naval Operations |
| Enhanced regional security initiatives | Driver | High | Defense Operations |
| Growing need for advanced naval capabilities | Opportunity | High | Frigate |
| Expansion of joint naval exercises | Opportunity | High | Destroyer |
| Complex procurement processes | Restraint | Medium | Weapon Systems |
| Compliance with international standards | Restraint | Medium | Navigation Systems |
| High production costs | Challenge | High | Frigate |
| Limited domestic manufacturing capacity | Challenge | Medium | Destroyer |
Evaluation of Drivers in Japan Surface Combatant Market (2026–2032)
Key forces behind demand, with the segment each one moves most, are listed below.
| Drivers | Primary Segment Affected | Why It Matters (Evidence) |
| Increased defense budget allocations | Naval Operations | Japan's allocation of ¥5 trillion for defense in 2023 drives demand for naval capabilities. |
| Focus on maritime security | Defense Operations | The 2023 strategy to improve maritime security boosts procurement of surface combatants. |
| Technological advancements in naval systems | Frigate | Investments in advanced technologies lead to higher demand for modern frigates. |
| Joint exercises with allied forces | Destroyer | Participation in joint naval exercises increases the need for interoperable destroyers. |
| Growing geopolitical tensions | Naval Operations | Regional security concerns prompt the military to invest more in naval operations. |
Volumes grow due to increased defense spending, with Japan allocating ¥5 trillion for naval capabilities in 2023. The emphasis on maritime security has led to a rise in procurement of surface combatants, as the military seeks to improve its operational readiness. Investments in advanced technologies are driving demand for modern frigates, while joint exercises with allied forces increase the need for interoperable destroyers. Geopolitical tensions in the Indo-Pacific region further stimulate investments in naval operations, resulting in a more active surface combatant market.
Evaluation of Restraints in Japan Surface Combatant Market
Several factors work against faster growth; the main ones are summarised below.
| Market Restraint | Primary Segment Affected | Why It Matters (Evidence) |
| Complex procurement processes delay project timelines | Weapon Systems | Lengthy procurement procedures can hinder timely delivery of critical weapon systems. |
| Compliance with international standards increases costs | Navigation Systems | Adhering to ISO 9001 standards raises production costs for navigation systems. |
| High production costs limit new projects | Frigate | The expense of advanced materials and technologies restricts new frigate developments. |
| Limited domestic manufacturing capacity affects supply | Destroyer | Insufficient local production capabilities can delay destroyer availability. |
| Market dependency on government contracts | Naval Operations | Reliance on government funding can create instability in naval operations. |
Japan Surface Combatant Market Challenges
Japan's complex procurement process for surface combatants poses a major challenge, as strict regulations can extend project timelines by 20%, delaying producers from fulfilling defence requirements. Increased competition from regional manufacturers pressures domestic suppliers to reduce prices, potentially lowering profit margins by 15% and hindering their capacity for technological advancements. Rising raw material costs, particularly steel, have surged by 10% in the past year, forcing buyers to reassess budgets and possibly postpone acquisitions. Geopolitical tensions disrupt supply chains, leading to shortages of critical components and impacting delivery schedules for producers, which compromises operational readiness for buyers.
Trends in the Japan Surface Combatant Market
The shifts below are changing how Japan Surface Combatant Market products are bought and supplied.
- Shift towards Advanced Naval Technologies: Japan's focus on advanced naval technologies is clear in its 2023 strategy, which allocates ¥5 trillion for modernization efforts, improving capabilities across the fleet.
- Increased Interoperability with Allied Forces: The JSDF's goal to improve interoperability with U.S. naval forces by 2025 is driving demand for compatible systems, creating a more integrated defense approach.
- Growing Emphasis on Maritime Security: The Japanese government's 2023 strategy highlights maritime security as a priority, prompting increased investment in surface combatants to address regional threats.
- Expansion of Joint Naval Exercises: Participation in joint naval exercises with allied nations in 2023 reflects a commitment to improving operational readiness and interoperability, strengthening defense ties.
Investment Opportunities in the Japan Surface Combatant Market
The following areas offer the clearest openings for investors and suppliers in the Japan Surface Combatant Market.
- ¥150 trillion investment gap in decarbonisation: Japan's GX Basic Policy aims for JPY 150 trillion in public-private investment over ten years, creating opportunities for suppliers in sustainable naval technologies.
- Demand for advanced frigates: The military's emphasis on modernizing destroyers presents opportunities for suppliers of advanced weapon systems and technologies.
- Investment in Yokohama and Nagasaki facilities: The shipbuilding facilities in Yokohama and Nagasaki are key locations for investment, offering opportunities for local partnerships in surface combatant production.
- Growing need for advanced navigation systems: The military's focus on improving operational effectiveness creates demand for innovative navigation systems, particularly in joint operations.
Government Initiatives in the Japan Surface Combatant Market
The Industrial Standardization Act, amended in 2019, governs product and test standards for defense manufacturing, ensuring quality and compliance in surface combatant production. The Act against Unjustifiable Premiums and Misleading Representations prohibits misleading advertising, protecting buyers and ensuring transparency in the market.
In 2023, ¥5 trillion was allocated for defense spending, overseen by the Ministry of Defense, which is responsible for the procurement and modernization of surface combatants. This funding supports various projects aimed at improving Japan's naval capabilities and security.
Future Insight of the Japan Surface Combatant Market
The integration of advanced materials will reshape demand for surface combatants by 2032, enhancing durability and operational efficiency. The ongoing development of the Aegis Combat System will elevate combat capabilities, drawing interest from defence strategists. Japan's commitment to ISO 9001 standards will ensure consistent quality in production, instilling confidence in buyers regarding reliability. By 2025, enhanced interoperability with U.S. naval forces will streamline joint operations, providing strategic advantages for both buyers and suppliers.
Market Segmentation Analysis
Japan Surface Combatant Market report covers a detailed analysis of the following market segments:
By Type – Destroyer Leads, Frigate Expected to Grow Fastest
According to Sachin Kumar Rai, Senior Research Analyst at 6Wresearch, in 2025, Destroyer led the type split with a 67% share. Destroyers hold the largest share in Japan's surface combatant market due to their critical role in national maritime defence, particularly in the Indo-Pacific region. Their advanced capabilities, exemplified by the Aegis Combat System, are vital for operational success and security. Over 2026–2032, Frigate is expected to post the fastest growth, at a CAGR of 5.8%. Frigates are experiencing rapid growth as their adaptability in various naval operations becomes increasingly recognised, especially with Japan's strategic emphasis on maritime security. The ongoing joint naval exercises with allied nations further highlight the expanding role of frigates in contemporary defence strategies. Suppliers should focus on enhancing frigate capabilities to meet the rising demand in the market.
By Application – Naval Operations Lead, Defense Operations Expected to Grow Fastest
Naval Operations accounted for 54% of the market by application in 2025. Naval operations account for the largest share as they represent the primary function of surface combatants in Japan's defence framework. The 2023 defence white paper highlights the importance of these operations in maintaining regional security and operational readiness. Defense Operations are projected to grow fastest, at a CAGR of 5.6% during 2026–2032. Defense operations are rapidly growing as Japan intensifies its focus on national security in light of regional threats. The government's strategic initiatives to bolster maritime security are driving this swift expansion in the defence operations segment. Suppliers must adapt their products to align with the increasing emphasis on defence operations to capture market opportunities.
By Component – Weapon Systems Lead and Record the Fastest Growth
The largest component category in 2025 was Weapon Systems, at 69% of revenue. Weapon systems dominate the market as they are integral to the functionality of surface combatants, ensuring effective naval defence. The adherence to ISO 9001 standards in their production underscores the emphasis on quality and reliability in these systems. The same category are also set to grow fastest, at a CAGR of 6.0% during 2026–2032. The weapon systems segment is also the fastest-growing due to ongoing advancements and increasing investment in naval capabilities, particularly in response to defence spending increases. As the primary component of surface combatants, their growth will likely continue to outpace other segments. Suppliers should focus on innovation in weapon systems to maintain competitive advantage in a growing market.
By End User – Military Leads, Government Expected to Grow Fastest
Military took 56% of end user revenue in 2025, more than any other category. The military is the predominant end user of surface combatants, as they are the primary operators responsible for national defence. The commitment of the Japanese Self-Defence Forces to enhance naval capabilities ensures a steady demand from this sector. Government is set to record the highest CAGR in this split, 5.5% over 2026–2032. The government segment is expanding quickly due to increased funding and oversight for naval capabilities, which enhances its role in surface combatant procurement. This trend indicates a growing recognition of the government's crucial support in military operations. Suppliers should engage with government entities to align with changing procurement strategies.
Key Attractiveness of the Report
- 10 Years of Market Numbers
- Historical Data Starting from 2022 to 2025
- Base Year 2025
- Forecast Data until 2032
- Key Performance Indicators Impacting the Market
- Major Upcoming Developments and Projects
Key Highlights of the Report:
- Japan Surface Combatant Market Outlook
- Market Size of Japan Surface Combatant Market,2025
- Forecast of Japan Surface Combatant Market, 2032
- Historical Data and Forecast of Japan Surface Combatant Revenues & Volume for the Period 2022-2032
- Japan Surface Combatant Market Trend Evolution
- Japan Surface Combatant Market Drivers and Challenges
- Japan Surface Combatant Price Trends
- Japan Surface Combatant Porter's Five Forces
- Japan Surface Combatant Industry Life Cycle
- Historical Data and Forecast of Japan Surface Combatant Market Revenues & Volume By Type for the Period 2022-2032
- Historical Data and Forecast of Japan Surface Combatant Market Revenues & Volume By Frigate for the Period 2022-2032
- Historical Data and Forecast of Japan Surface Combatant Market Revenues & Volume By Destroyer for the Period 2022-2032
- Historical Data and Forecast of Japan Surface Combatant Market Revenues & Volume By Application for the Period 2022-2032
- Historical Data and Forecast of Japan Surface Combatant Market Revenues & Volume By Naval Operations for the Period 2022-2032
- Historical Data and Forecast of Japan Surface Combatant Market Revenues & Volume By Defense Operations for the Period 2022-2032
- Historical Data and Forecast of Japan Surface Combatant Market Revenues & Volume By Component for the Period 2022-2032
- Historical Data and Forecast of Japan Surface Combatant Market Revenues & Volume By Weapon Systems for the Period 2022-2032
- Historical Data and Forecast of Japan Surface Combatant Market Revenues & Volume By Navigation Systems for the Period 2022-2032
- Historical Data and Forecast of Japan Surface Combatant Market Revenues & Volume By End User for the Period 2022-2032
- Historical Data and Forecast of Japan Surface Combatant Market Revenues & Volume By Military for the Period 2022-2032
- Historical Data and Forecast of Japan Surface Combatant Market Revenues & Volume By Government for the Period 2022-2032
- Japan Surface Combatant Import Export Trade Statistics
- Market Opportunity Assessment By Type
- Market Opportunity Assessment By Application
- Market Opportunity Assessment By Component
- Market Opportunity Assessment By End User
- Japan Surface Combatant Top Companies Market Share
- Japan Surface Combatant Competitive Benchmarking By Technical and Operational Parameters
- Japan Surface Combatant Company Profiles
- Japan Surface Combatant Key Strategic Recommendations
Market Covered
The report covers the following segments.
By Type
- Frigate
- Destroyer
By Application
- Naval Operations
- Defense Operations
By Component
- Weapon Systems
- Navigation Systems
By End User
- Military
- Government