Jordan Chromium Oxide Market (2026-2032) Outlook | Industry, Companies, Growth, Analysis, Size, Forecast, Revenue, Value, Trends, Share
Market Forecast By Form (Powder, Pellets, Pieces, Others), By Grade (Pigment grade, Refractory grade, Metallurgy grade, Abrasive grade, Others), By Application (Glass, Inks, Paints and coatings, Others) And Competitive Landscape
| Product Code: ETC087725 | Publication Date: Jun 2021 | Updated Date: Jun 2026 | Product Type: Report | |
| Publisher: 6Wresearch | Author: Ravi Bhandari | No. of Pages: 70 | No. of Figures: 35 | No. of Tables: 5 |
Jordan Chromium Oxide Market Size, Share & Growth Rate
The Jordan Chromium Oxide Market was estimated at USD 311 Million in 2025 and is projected to reach USD 410 Million by 2032, growing at a CAGR of 4.0% from 2026 to 2032. This growth trajectory is propelled by the robust expansion of the construction sector, which drives demand for chromium oxide in high-performance paints and coatings. Moreover, the automotive industry's continual advancement further boosts the market, as manufacturers seek durable and corrosion-resistant coatings for vehicles.
Jordan Chromium Oxide Market Growth Rate Analysis (2021-2032)
The Jordan Chromium Oxide market displays a stable growth trajectory, marked by a robust annual increase of 4.4% in 2021, followed by consistent 4.9% growth in both 2022 and 2023. The demand for chromium oxide, driven largely by its application in the ceramics and coatings sectors, reflects strengthening industrial activity and investment in infrastructure throughout Jordan. While growth is projected to hover around 4.5% to 4.8% through 2032, fluctuations can be linked to shifts in consumer preferences and initiatives for energy transition, which may impact raw material sourcing. As Jordan continues to embrace digitalization within manufacturing processes, efficiencies are likely to sustain medium-term growth within the market.
Jordan Chromium Oxide Market Year-wise Growth Rate and Key Drivers
This graph highlights how the Jordan Chromium Oxide Market has steadily grown over the past five years, supported by major growth factors.
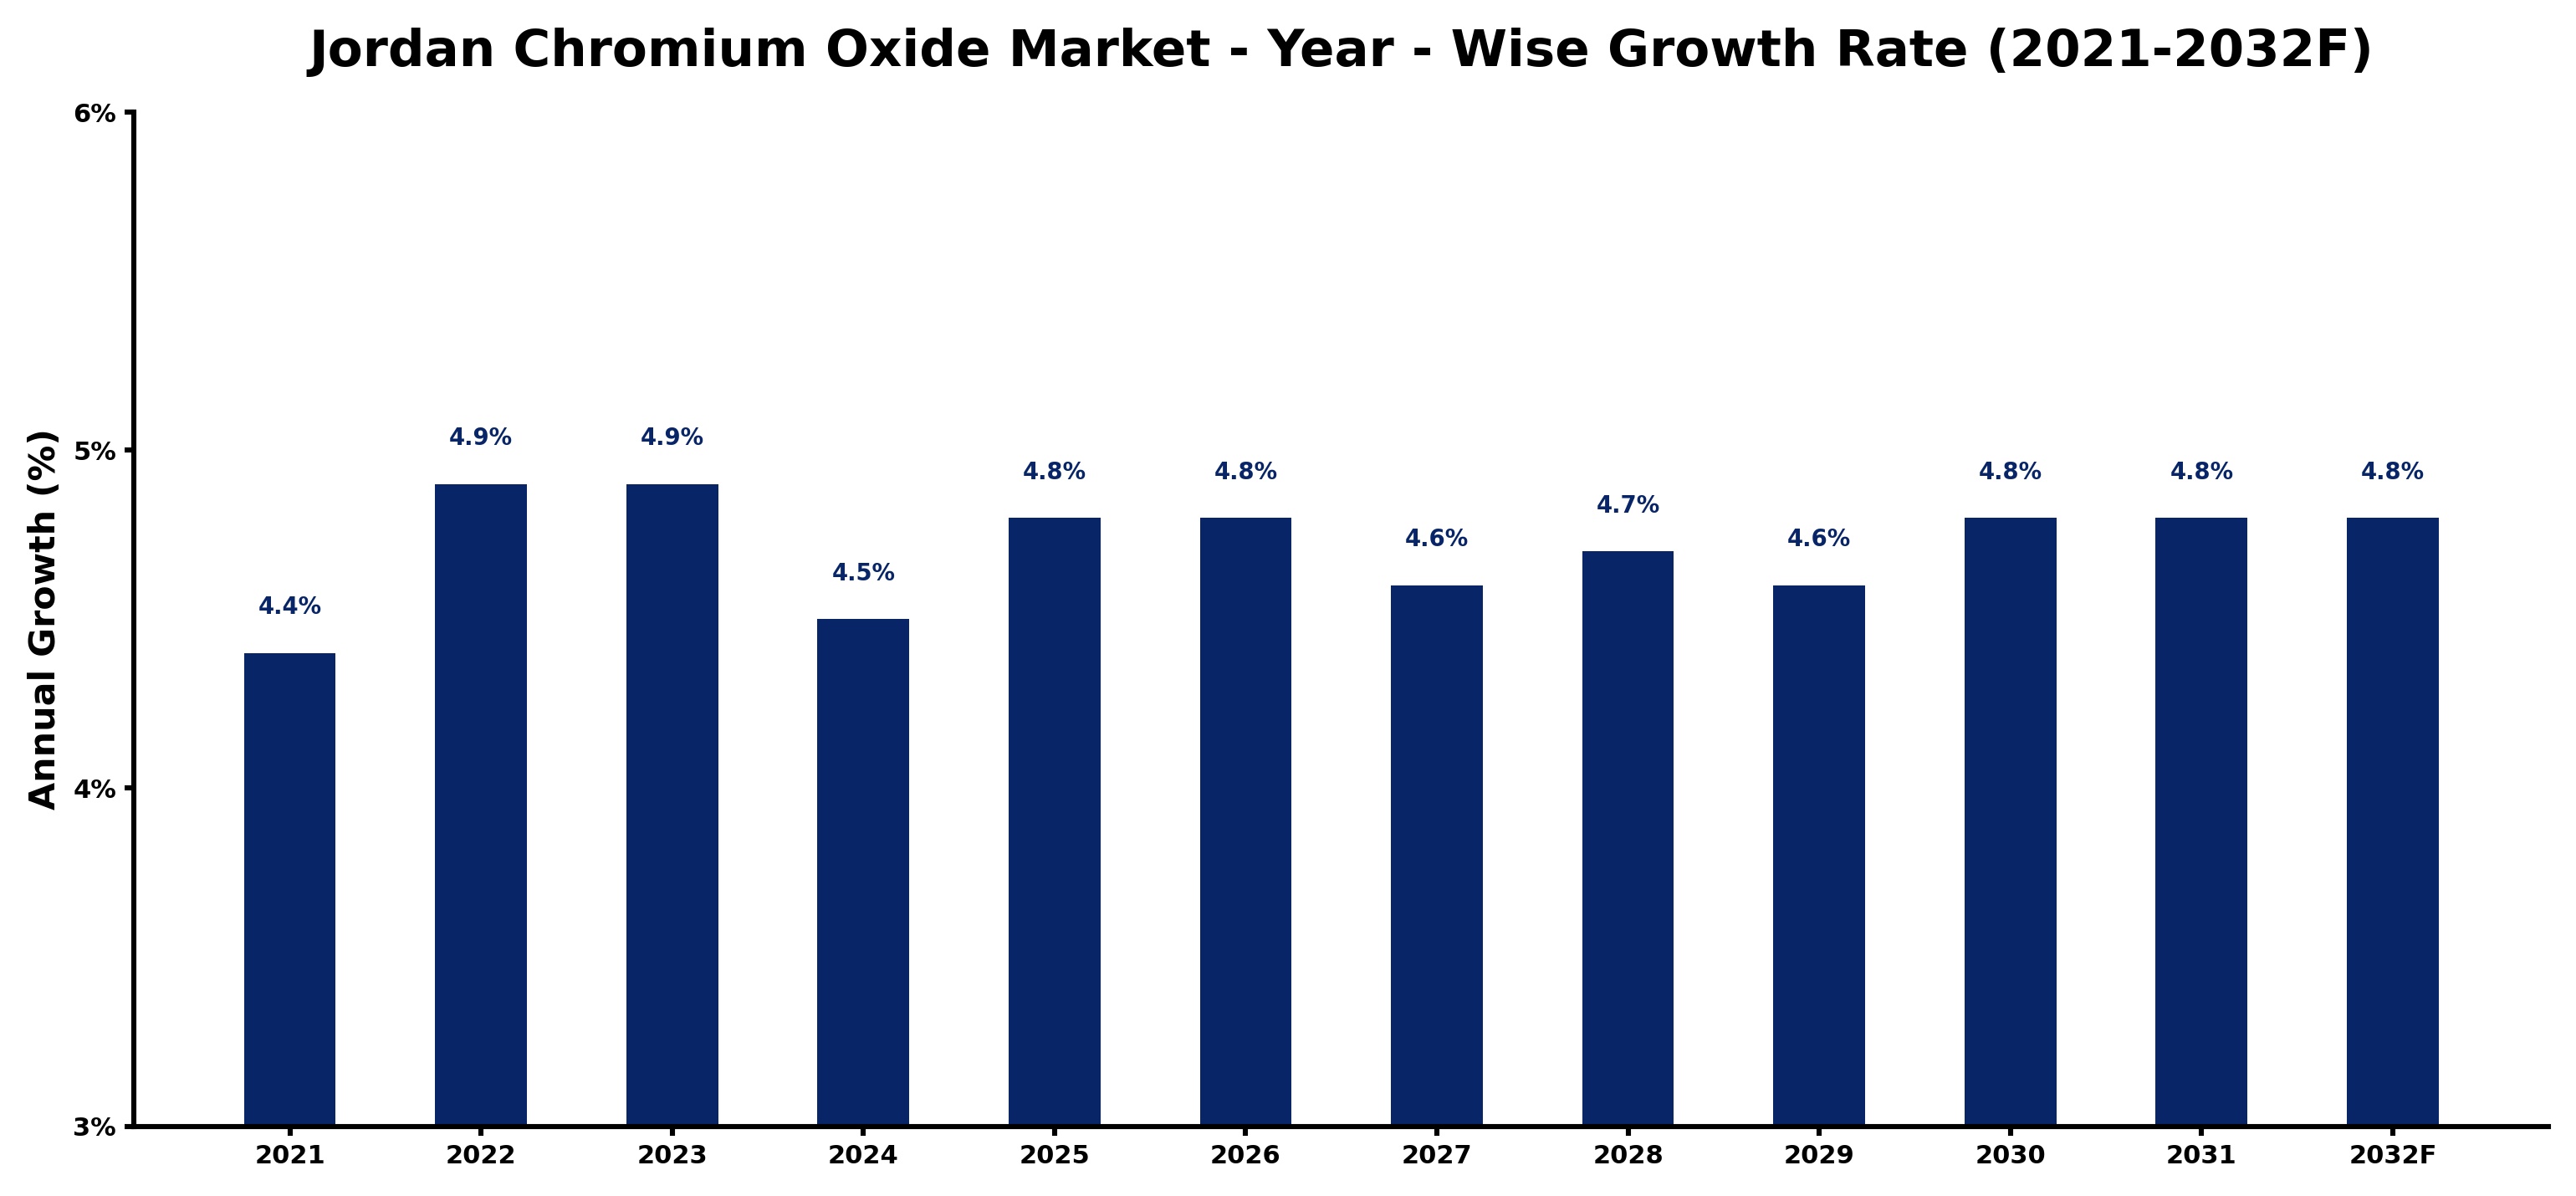
The table below presents the year‑wise growth rates along with the key drivers influencing the market
| Year | Growth Rate | Major Drivers |
| 2021 | 4.4% | Expansion of transportation and logistics networks |
| 2022 | 4.9% | Increasing industrial automation investments |
| 2023 | 4.9% | Growing urbanization and commercial development |
| 2024 | 4.5% | Increasing industrial automation investments |
| 2025 | 4.8% | Increasing industrial infrastructure investments |
| 2026 | 4.8% | Rising electricity demand across industries |
| 2027 | 4.6% | Expansion of transportation and logistics networks |
| 2028 | 4.7% | Expansion of commercial construction activities |
| 2029 | 4.6% | Increasing industrial infrastructure investments |
| 2030 | 4.8% | Expansion of manufacturing activities |
| 2031 | 4.8% | Expansion of manufacturing activities |
| 2032 | 4.8% | Increasing smart city development projects |
Note - Market size estimations and growth projections presented in this report are based on 6Wresearch’s advanced forecasting approach, validated with industry datasets as of June 2026.
Jordan Chromium Oxide Market Synopsis
The rising demand for chromium oxide in the ceramics and glass industries is creating new opportunities for local manufacturers. As construction activities increase, the requirement for chromic oxide as a pigment in architectural glass and tiles is becoming particularly significant.
Additionally, the emphasis on sustainability has led to a notable shift towards eco-friendly chromium oxide products. This trend is prompting manufacturers to innovate and adapt to changing consumer preferences while focusing on reducing environmental impacts.
Jordan Chromium Oxide Market Key Takeaways
- The market is expected to grow steadily due to increasing demand across several key industries.
- Sustainability and environmental considerations are reshaping product development in the chromium oxide sector.
- Intense competition from global players poses challenges for local manufacturers in pricing and market share.
- Investments in research and development are essential for enhancing product quality and meeting regulatory standards.
- Jordan's strategic location facilitates access to international markets, enhancing export opportunities for chromium oxide products.
Evaluation of Restraints in Jordan Chromium Oxide Market
The Jordan Chromium Oxide Market faces several restraints that could impede growth. Key among them is the fierce competition from established global players, who often leverage economies of scale to offer lower prices. This dynamic puts pressure on local manufacturers, who must find ways to differentiate their products. Furthermore, fluctuations in raw material prices, particularly for chromium ore, can adversely affect production costs and profit margins. Lastly, stringent environmental regulations require companies to adopt sustainable practices, which can be costly and complex to implement.
Jordan Chromium Oxide Market Trends
Current trends indicate a growing preference for high-quality, durable products across various applications, from ceramics to automotive coatings. This trend is closely tied to the expanding construction sector, which increasingly demands innovative solutions for architectural and design applications. Moreover, there is a noticeable shift towards eco-friendly chromium oxide products as manufacturers align with global sustainability goals.
Technological advancements in production processes are also playing a crucial role in shaping the market. Manufacturers are investing in new technologies to enhance production efficiency while minimizing environmental impact, thereby catering to an increasingly environmentally conscious consumer base.
Jordan Chromium Oxide Market Opportunities
The Jordan Chromium Oxide Market offers significant investment opportunities due to the country’s rich chromium resources. Investors can explore avenues in mining and extraction operations, which hold the potential for high returns given the rising demand from various sectors, including aerospace and automotive. Additionally, partnerships with local producers could enhance market penetration and bolster product development tailored to both local and international markets.
Government Initiatives in the Jordan Chromium Oxide Market
The Jordanian government, through the Ministry of Energy and Mineral Resources, is focused on promoting responsible mining and sustainable practices within the chromium oxide sector. Policies aimed at encouraging research and development initiatives are in place, and there are incentives for companies that comply with environmental regulations. Additionally, the government is keen on balancing domestic production with international trade dynamics to foster a stable market environment.
Future Insights of the Jordan Chromium Oxide Market
Looking ahead to the period from 2026 to 2032, the Jordan Chromium Oxide Market is poised for further growth driven by the increasing application of chromium oxide in multiple sectors. The anticipated rise in demand for sustainable products, coupled with technological innovations, will likely shape market dynamics. However, stakeholders must remain vigilant regarding fluctuating raw material prices and evolving regulatory landscapes, which could influence market stability.
Jordan Chromium Oxide Market Latest Developments (May 2025 - June 2026)
Recent developments in the Jordan Chromium Oxide Market indicate a continued focus on sustainability and eco-friendly production practices. Several manufacturers are adopting new technologies to optimize their production processes, aiming to reduce their environmental footprint while meeting the rising demand for high-quality chromium oxide products. Collaborative efforts between industry stakeholders and government bodies are also on the rise to ensure the sustainable growth of this vital sector.
Jordan Chromium Oxide Market - Key Attractiveness of the Report
- 10 Years of Market Numbers
- Historical Data Starting from 2022 to 2025
- Base Year: 2025
- Forecast Data until 2032
- Key Performance Indicators Impacting the Market
- Major Upcoming Developments and Projects
Key Highlights of the Report:
- Jordan Chromium Oxide Market Outlook
- Market Size of Jordan Chromium Oxide Market, 2025
- Forecast of Jordan Chromium Oxide Market, 2032
- Historical Data and Forecast of Jordan Chromium Oxide Revenues & Volume for the Period 2022-2032F
- Jordan Chromium Oxide Market Trend Evolution
- Jordan Chromium Oxide Market Drivers and Challenges
- Jordan Chromium Oxide Price Trends
- Jordan Chromium Oxide Porter's Five Forces
- Jordan Chromium Oxide Industry Life Cycle
- Historical Data and Forecast of Jordan Chromium Oxide Market Revenues & Volume By Form for the Period 2022-2032F
- Historical Data and Forecast of Jordan Chromium Oxide Market Revenues & Volume By Powder for the Period 2022-2032F
- Historical Data and Forecast of Jordan Chromium Oxide Market Revenues & Volume By Pellets for the Period 2022-2032F
- Historical Data and Forecast of Jordan Chromium Oxide Market Revenues & Volume By Pieces for the Period 2022-2032F
- Historical Data and Forecast of Jordan Chromium Oxide Market Revenues & Volume By Others for the Period 2022-2032F
- Historical Data and Forecast of Jordan Chromium Oxide Market Revenues & Volume By Grade for the Period 2022-2032F
- Historical Data and Forecast of Jordan Chromium Oxide Market Revenues & Volume By Pigment grade for the Period 2022-2032F
- Historical Data and Forecast of Jordan Chromium Oxide Market Revenues & Volume By Refractory grade for the Period 2022-2032F
- Historical Data and Forecast of Jordan Chromium Oxide Market Revenues & Volume By Metallurgy grade for the Period 2022-2032F
- Historical Data and Forecast of Jordan Chromium Oxide Market Revenues & Volume By Abrasive grade for the Period 2022-2032F
- Historical Data and Forecast of Jordan Chromium Oxide Market Revenues & Volume By Others for the Period 2022-2032F
- Historical Data and Forecast of Jordan Chromium Oxide Market Revenues & Volume By Application for the Period 2022-2032F
- Historical Data and Forecast of Jordan Chromium Oxide Market Revenues & Volume By Glass for the Period 2022-2032F
- Historical Data and Forecast of Jordan Chromium Oxide Market Revenues & Volume By Inks for the Period 2022-2032F
- Historical Data and Forecast of Jordan Chromium Oxide Market Revenues & Volume By Paints and coatings for the Period 2022-2032F
- Historical Data and Forecast of Jordan Chromium Oxide Market Revenues & Volume By Others for the Period 2022-2032F
- Jordan Chromium Oxide Import Export Trade Statistics
- Market Opportunity Assessment By Form
- Market Opportunity Assessment By Grade
- Market Opportunity Assessment By Application
- Jordan Chromium Oxide Top Companies Market Share
- Jordan Chromium Oxide Competitive Benchmarking By Technical and Operational Parameters
- Jordan Chromium Oxide Company Profiles
- Jordan Chromium Oxide Key Strategic Recommendations
Jordan Chromium Oxide Market - Frequently Asked Questions
The market was estimated at USD 311 Million in 2025 and is projected to reach USD 410 Million by 2032, reflecting a CAGR of 4.0% from 2026 to 2032.
The primary consumers include the construction sector, automotive industry, and ceramics, with each sector demanding high-quality, durable products that leverage chromium oxide’s unique properties.
Increasing consumer awareness regarding environmental issues is driving demand for eco-friendly chromium oxide products, compelling manufacturers to innovate and adopt sustainable practices in their production processes.
Local manufacturers contend with intense competition from international players who benefit from economies of scale, as well as fluctuating raw material prices that can strain production budgets.
The Jordanian government supports sustainable practices through regulations and incentives, while also working to ensure compliance with environmental standards, which helps to create a stable market environment.
Yes, the market presents promising investment opportunities, particularly in mining and extraction operations, as well as potential partnerships with local producers to capitalize on the growing global demand for chromium oxide.
6Wresearch actively monitors the Jordan Chromium Oxide Market and publishes its comprehensive annual report, highlighting emerging trends, growth drivers, revenue analysis, and forecast outlook. Our insights help businesses to make data-backed strategic decisions with ongoing market dynamics. Our analysts track relevent industries related to the Jordan Chromium Oxide Market, allowing our clients with actionable intelligence and reliable forecasts tailored to emerging regional needs.
Yes, we provide customisation as per your requirements. To learn more, feel free to contact us on sales@6wresearch.com
1 Executive Summary |
2 Introduction |
2.1 Key Highlights of the Report |
2.2 Report Description |
2.3 Market Scope & Segmentation |
2.4 Research Methodology |
2.5 Assumptions |
3 Jordan Chromium Oxide Market Overview |
3.1 Jordan Country Macro Economic Indicators |
3.2 Jordan Chromium Oxide Market Revenues & Volume, 2022 & 2032F |
3.3 Jordan Chromium Oxide Market - Industry Life Cycle |
3.4 Jordan Chromium Oxide Market - Porter's Five Forces |
3.5 Jordan Chromium Oxide Market Revenues & Volume Share, By Form, 2022 & 2032F |
3.6 Jordan Chromium Oxide Market Revenues & Volume Share, By Grade, 2022 & 2032F |
3.7 Jordan Chromium Oxide Market Revenues & Volume Share, By Form, 2022 & 2032F |
4 Jordan Chromium Oxide Market Dynamics |
4.1 Impact Analysis |
4.2 Market Drivers |
4.3 Market Restraints |
5 Jordan Chromium Oxide Market Trends |
6 Jordan Chromium Oxide Market, By Types |
6.1 Jordan Chromium Oxide Market, By Form |
6.1.1 Overview and Analysis |
6.1.2 Jordan Chromium Oxide Market Revenues & Volume, By Form, 2022-2032F |
6.1.3 Jordan Chromium Oxide Market Revenues & Volume, By Powder, 2022-2032F |
6.1.4 Jordan Chromium Oxide Market Revenues & Volume, By Pellets, 2022-2032F |
6.1.5 Jordan Chromium Oxide Market Revenues & Volume, By Pieces, 2022-2032F |
6.1.6 Jordan Chromium Oxide Market Revenues & Volume, By Others, 2022-2032F |
6.2 Jordan Chromium Oxide Market, By Grade |
6.2.1 Overview and Analysis |
6.2.2 Jordan Chromium Oxide Market Revenues & Volume, By Pigment grade, 2022-2032F |
6.2.3 Jordan Chromium Oxide Market Revenues & Volume, By Refractory grade, 2022-2032F |
6.2.4 Jordan Chromium Oxide Market Revenues & Volume, By Metallurgy grade, 2022-2032F |
6.2.5 Jordan Chromium Oxide Market Revenues & Volume, By Abrasive grade, 2022-2032F |
6.2.6 Jordan Chromium Oxide Market Revenues & Volume, By Others, 2022-2032F |
6.3 Jordan Chromium Oxide Market, By Application |
6.3.1 Overview and Analysis |
6.3.2 Jordan Chromium Oxide Market Revenues & Volume, By Glass, 2022-2032F |
6.3.3 Jordan Chromium Oxide Market Revenues & Volume, By Inks, 2022-2032F |
6.3.4 Jordan Chromium Oxide Market Revenues & Volume, By Paints and coatings, 2022-2032F |
6.3.5 Jordan Chromium Oxide Market Revenues & Volume, By Others, 2022-2032F |
7 Jordan Chromium Oxide Market Import-Export Trade Statistics |
7.1 Jordan Chromium Oxide Market Export to Major Countries |
7.2 Jordan Chromium Oxide Market Imports from Major Countries |
8 Jordan Chromium Oxide Market Key Performance Indicators |
9 Jordan Chromium Oxide Market - Opportunity Assessment |
9.1 Jordan Chromium Oxide Market Opportunity Assessment, By Form, 2022 & 2032F |
9.2 Jordan Chromium Oxide Market Opportunity Assessment, By Grade, 2022 & 2032F |
9.3 Jordan Chromium Oxide Market Opportunity Assessment, By Application, 2022 & 2032F |
10 Jordan Chromium Oxide Market - Competitive Landscape |
10.1 Jordan Chromium Oxide Market Revenue Share, By Companies, 2025 |
10.2 Jordan Chromium Oxide Market Competitive Benchmarking, By Operating and Technical Parameters |
11 Company Profiles |
12 Recommendations |
13 Disclaimer |
Global Go To Market Strategy - 2030
Export potential enables firms to identify high-growth global markets with greater confidence by combining advanced trade intelligence with a structured quantitative methodology. The framework analyzes emerging demand trends and country-level import patterns while integrating macroeconomic and trade datasets such as GDP and population forecasts, bilateral import–export flows, tariff structures, elasticity differentials between developed and developing economies, geographic distance, and import demand projections. Using weighted trade values from 2020–2024 as the base period to project country-to-country export potential for 2030, these inputs are operationalized through calculated drivers such as gravity model parameters, tariff impact factors, and projected GDP per-capita growth. Through an analysis of hidden potentials, demand hotspots, and market conditions that are most favorable to success, this method enables firms to focus on target countries, maximize returns, and global expansion with data, backed by accuracy.
By factoring in the projected importer demand gap that is currently unmet and could be potential opportunity, it identifies the potential for the Exporter (Country) among 190 countries, against the general trade analysis, which identifies the biggest importer or exporter.
To discover high-growth global markets and optimize your business strategy:
Click Here
Pricing
- Single User License$ 1,995
- Department License$ 2,400
- Site License$ 3,120
- Global License$ 3,795

Leadership Perspectives from Industry Events
Search
Thought Leadership and Analyst Meet


Our Clients
6WResearch In News
- India Air Conditioner Market Set for Strong Rebound in 2026 After Weather-Led Correction and GST-Driven Recovery: 6Wresearch
- ADAS in India: How Automatic Emergency Braking, Blind Spot Detection & Driver Monitoring are Transforming Road Safety
- Doha a strategic location for EV manufacturing hub: IPA Qatar
- Demand for luxury TVs surging in the GCC, says Samsung
- Empowering Growth: The Thriving Journey of Bangladesh’s Cable Industry
- Demand for luxury TVs surging in the GCC, says Samsung
Latest Reports
- Poland Fire Protection Systems Market (2026-2032)
- Cape Verde Portable Hand-Thrown Extinguisher Market (2026-2032)
- Canada Portable Hand-Thrown Extinguisher Market (2026-2032)
- Cameroon Portable Hand-Thrown Extinguisher Market (2026-2032)
- Burundi Portable Hand-Thrown Extinguisher Market (2026-2032)
- Burkina Faso Portable Hand-Thrown Extinguisher Market (2026-2032)
- Bulgaria Portable Hand-Thrown Extinguisher Market (2026-2032)
- Brunei Portable Hand-Thrown Extinguisher Market (2026-2032)
- Botswana Portable Hand-Thrown Extinguisher Market (2026-2032)
- Bosnia and Herzegovina Portable Hand-Thrown Extinguisher Market (2026-2032)
Industry Events and Analyst Meet

HIMTEX 2026

India Refining Summit 2026

India EV Show 2026

EV tech India Expo 2026

Auto Tech Asia 2026
Whitepaper
- Middle East & Africa Commercial Security Market Click here to view more.
- Middle East & Africa Fire Safety Systems & Equipment Market Click here to view more.
- GCC Drone Market Click here to view more.
- Middle East Lighting Fixture Market Click here to view more.
- GCC Physical & Perimeter Security Market Click here to view more.