Jordan Clay Products And Refractories Market (2026-2032) Outlook | Revenue, Size, Analysis, Growth, Forecast, Value, Share, Trends, Companies & Industry
Market Forecast By Type (Pottery, Ceramics, Plumbing Fixtures, Clay Building Material, Refractories), By Process (Grinding , Cutting , Mixing , Shaping, Honing), By Material (Quartz, Chamatte, Sand, Sawdust, Slag, Pulverized , Coal), By End-User Vertical (Construction , Automobiles , Steel Making , Cosmetics, Food Industry, Others) And Competitive Landscape
| Product Code: ETC319126 | Publication Date: Aug 2022 | Updated Date: Jul 2026 | Product Type: Market Research Report | |
| Publisher: 6Wresearch | Author: Shubham Padhi | No. of Pages: 75 | No. of Figures: 35 | No. of Tables: 20 |
Jordan Clay Products And Refractories Market Size, Share & Growth Rate
The Jordan Clay Products And Refractories Market was estimated at USD 1450 Million in 2025 and is projected to reach USD 2063 Million by 2032, growing at a CAGR of 5.2% from 2026 to 2032. This growth trajectory is primarily driven by the robust expansion of the construction sector, which continually fuels demand for refractory materials. Key industries such as steel, cement, and glass manufacturing are increasingly relying on these heat-resistant materials, further solidifying the markets upward momentum.
Jordan Clay Products And Refractories Market Year-wise Growth Rate and Key Drivers
This graph highlights how the Jordan Clay Products And Refractories Market has steadily grown over the years, supported by major growth factors.
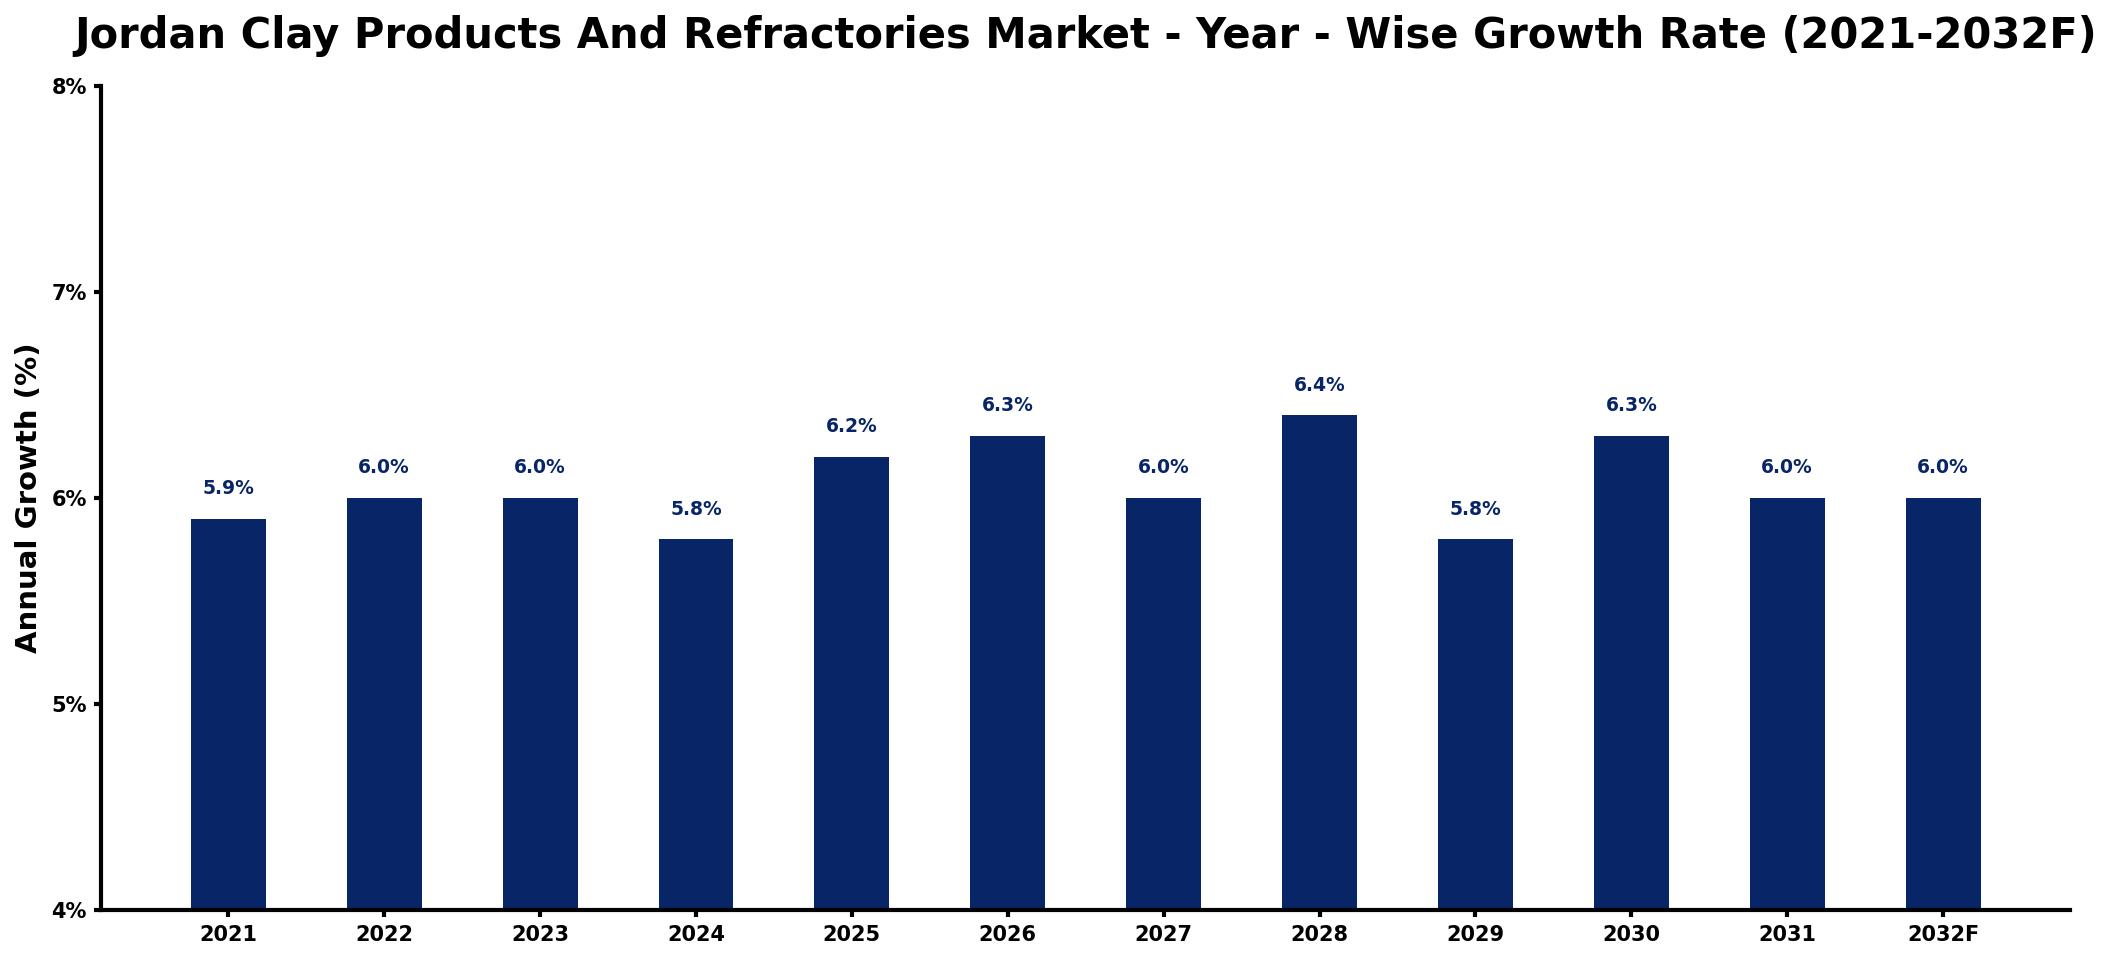
The table below presents the year‑wise growth rates along with the key drivers influencing the market
| Year | Growth Rate | Major Drivers |
| 2021 | 5.9% | Construction sector demand increases significantly |
| 2022 | 6.0% | Manufacturing investments drive market growth |
| 2023 | 6.0% | Infrastructure projects stimulate regional demand |
| 2024 | 5.8% | Energy sector investments reduce activity |
| 2025 | 6.2% | Technological advancements enhance production efficiency |
| 2026 | 6.3% | Export opportunities expand international reach |
| 2027 | 6.0% | Environmental regulations boost sustainability practices |
| 2028 | 6.4% | Urbanization trends create higher consumption |
| 2029 | 5.8% | Market saturation limits new investments |
| 2030 | 6.3% | Government initiatives support local industries |
| 2031 | 6.0% | R&D funding fosters innovative applications |
| 2032 | 6.0% | Partnerships strengthen supply chain networks |
Note: Market size estimations and growth projections presented in this report are based on 6Wresearch's proprietary forecasting methodology, utilizing the latest available industry data, government publications, and primary research inputs.
Jordan Clay Products And Refractories Market Synopsis
A noteworthy aspect of the Jordan Clay Products and Refractories market is the essential role of refractory materials in high-temperature applications, particularly in kilns and furnaces. These materials ensure operational efficiency and safety in various industrial processes, making them indispensable to sectors ranging from metal production to ceramics.
As domestic manufacturers increasingly compete with international players, there is a burgeoning emphasis on innovation and quality enhancements in product offerings. The governments commitment to supporting industrial development through strategic initiatives is expected to bolster local production capabilities and market competitiveness.
Jordan Clay Products And Refractories Market Key Takeaways
- The Jordan Clay Products and Refractories market is on a solid growth trajectory, projected to reach USD 2063 Million by 2032.
- Key industries driving demand include steel, cement, and glass manufacturing, all of which require high-performance refractory materials.
- Government support in the form of subsidies and regulations aims to enhance product quality and competitiveness.
- Both domestic and international manufacturers are vital to meeting the diverse needs of Jordan's industrial landscape.
- Innovation and quality control remain central to sustaining market growth and meeting evolving industry standards.
Evaluation of Restraints in Jordan Clay Products And Refractories Market
The Jordan Clay Products and Refractories market faces challenges that could impede its progress. One significant restraint is the ongoing need for innovation, as manufacturers must continuously adapt to evolving industry standards and regulatory requirements. Additionally, sourcing high-quality raw materials at competitive prices is critical; fluctuations in raw material costs can affect overall production margins. Moreover, maintaining energy efficiency during production processes is becoming increasingly important, posing a challenge to manufacturers who strive for sustainability while ensuring profitability.
Jordan Clay Products And Refractories Market Trends
Emerging trends in the Jordan Clay Products and Refractories market highlight a growing preference for eco-friendly materials and sustainable production practices. Companies are increasingly exploring alternative sources of raw materials and implementing energy-efficient technologies to reduce their carbon footprint. Additionally, the rise of automation in manufacturing processes is enhancing operational efficiency and product quality, positioning businesses to respond swiftly to market demands.
Jordan Clay Products And Refractories Market Opportunities
The market presents numerous opportunities for investment and growth, particularly in research and development initiatives aimed at improving product performance. As the construction sector expands, there is significant potential for innovation in refractory applications, particularly for advanced ceramics and composites. Furthermore, the increasing demand for energy-efficient solutions opens avenues for companies to differentiate themselves by offering sustainable and cost-effective refractory materials.
Government Initiatives in the Jordan Clay Products And Refractories Market
The Jordanian government is actively promoting policies to bolster the quality and competitiveness of clay products and refractories in the international arena. The Ministry of Industry and Trade has launched various subsidies aimed at encouraging research and development initiatives to enhance product quality and innovation. Moreover, stringent regulations have been established to ensure that imported and locally-produced refractory materials meet the high standards required for industrial applications, ultimately fostering a competitive market environment.
Future Insights of the Jordan Clay Products And Refractories Market
Looking ahead to 2026-2032, the Jordan Clay Products and Refractories market is expected to continue its upward trajectory, driven by sustained industrial growth and construction activities. The increasing adoption of advanced refractory technologies will likely play a crucial role in meeting the demands of modern industries. Additionally, as global markets evolve, local manufacturers will need to adapt and innovate to stay competitive, ensuring their offerings align with international standards.
Jordan Clay Products And Refractories Market Latest Developments (2025 - 2026)
Recent developments in the Jordan Clay Products and Refractories market indicate a strategic shift towards sustainable practices, with several companies announcing initiatives focused on reducing environmental impact through energy-efficient production processes. Investment in advanced technologies and automation is becoming more prevalent, as firms seek to enhance operational efficiency and product quality. Furthermore, collaborative efforts between local manufacturers and research institutions are paving the way for innovative product development and improved material properties.
Jordan Clay Products And Refractories Market - Key Attractiveness of the Report
- 10 Years of Market Numbers
- Historical Data Starting from 2022 to 2025
- Base Year: 2025
- Forecast Data until 2032
- Key Performance Indicators Impacting the Market
- Major Upcoming Developments and Projects
Key Highlights of the Report:
- Jordan Clay Products And Refractories Market Outlook
- Market Size of Jordan Clay Products And Refractories Market, 2025
- Forecast of Jordan Clay Products And Refractories Market, 2032
- Historical Data and Forecast of Jordan Clay Products And Refractories Revenues & Volume for the Period 2022-2032F
- Jordan Clay Products And Refractories Market Trend Evolution
- Jordan Clay Products And Refractories Market Drivers and Challenges
- Jordan Clay Products And Refractories Price Trends
- Jordan Clay Products And Refractories Porter's Five Forces
- Jordan Clay Products And Refractories Industry Life Cycle
- Historical Data and Forecast of Jordan Clay Products And Refractories Market Revenues & Volume By Type for the Period 2022-2032F
- Historical Data and Forecast of Jordan Clay Products And Refractories Market Revenues & Volume By Pottery for the Period 2022-2032F
- Historical Data and Forecast of Jordan Clay Products And Refractories Market Revenues & Volume By Ceramics for the Period 2022-2032F
- Historical Data and Forecast of Jordan Clay Products And Refractories Market Revenues & Volume By Plumbing Fixtures for the Period 2022-2032F
- Historical Data and Forecast of Jordan Clay Products And Refractories Market Revenues & Volume By Clay Building Material for the Period 2022-2032F
- Historical Data and Forecast of Jordan Clay Products And Refractories Market Revenues & Volume By Refractories for the Period 2022-2032F
- Historical Data and Forecast of Jordan Clay Products And Refractories Market Revenues & Volume By Process for the Period 2022-2032F
- Historical Data and Forecast of Jordan Clay Products And Refractories Market Revenues & Volume By Grinding for the Period 2022-2032F
- Historical Data and Forecast of Jordan Clay Products And Refractories Market Revenues & Volume By Cutting for the Period 2022-2032F
- Historical Data and Forecast of Jordan Clay Products And Refractories Market Revenues & Volume By Mixing for the Period 2022-2032F
- Historical Data and Forecast of Jordan Clay Products And Refractories Market Revenues & Volume By Shaping for the Period 2022-2032F
- Historical Data and Forecast of Jordan Clay Products And Refractories Market Revenues & Volume By Honing for the Period 2022-2032F
- Historical Data and Forecast of Jordan Clay Products And Refractories Market Revenues & Volume By Material for the Period 2022-2032F
- Historical Data and Forecast of Jordan Clay Products And Refractories Market Revenues & Volume By Quartz for the Period 2022-2032F
- Historical Data and Forecast of Jordan Clay Products And Refractories Market Revenues & Volume By Chamatte for the Period 2022-2032F
- Historical Data and Forecast of Jordan Clay Products And Refractories Market Revenues & Volume By Sand for the Period 2022-2032F
- Historical Data and Forecast of Jordan Clay Products And Refractories Market Revenues & Volume By Sawdust for the Period 2022-2032F
- Historical Data and Forecast of Jordan Clay Products And Refractories Market Revenues & Volume By Slag for the Period 2022-2032F
- Historical Data and Forecast of Jordan Clay Products And Refractories Market Revenues & Volume By Pulverized for the Period 2022-2032F
- Historical Data and Forecast of Jordan Clay Products And Refractories Market Revenues & Volume By Coal for the Period 2022-2032F
- Historical Data and Forecast of Jordan Clay Products And Refractories Market Revenues & Volume By End-User Vertical for the Period 2022-2032F
- Historical Data and Forecast of Jordan Clay Products And Refractories Market Revenues & Volume By Construction for the Period 2022-2032F
- Historical Data and Forecast of Jordan Clay Products And Refractories Market Revenues & Volume By Automobiles for the Period 2022-2032F
- Historical Data and Forecast of Jordan Clay Products And Refractories Market Revenues & Volume By Steel Making for the Period 2022-2032F
- Historical Data and Forecast of Jordan Clay Products And Refractories Market Revenues & Volume By Cosmetics for the Period 2022-2032F
- Historical Data and Forecast of Jordan Clay Products And Refractories Market Revenues & Volume By Food Industry for the Period 2022-2032F
- Historical Data and Forecast of Jordan Clay Products And Refractories Market Revenues & Volume By Others for the Period 2022-2032F
- Jordan Clay Products And Refractories Import Export Trade Statistics
- Market Opportunity Assessment By Type
- Market Opportunity Assessment By Process
- Market Opportunity Assessment By Material
- Market Opportunity Assessment By End-User Vertical
- Jordan Clay Products And Refractories Top Companies Market Share
- Jordan Clay Products And Refractories Competitive Benchmarking By Technical and Operational Parameters
- Jordan Clay Products And Refractories Company Profiles
- Jordan Clay Products And Refractories Key Strategic Recommendations
Frequently Asked Questions About the Market Study (FAQs):
The market was estimated at USD 1450 Million in 2025 and is projected to reach USD 2063 Million by 2032, growing at a CAGR of 5.2% from 2026 to 2032.
The Jordanian government fosters an environment for growth through subsidies for R&D and stringent regulations to enhance product quality, significantly affecting local manufacturers' competitiveness.
Key sectors include steel, cement, glass, and ceramics, all of which rely on refractories for high-temperature applications, such as kiln linings and furnace insulation.
Manufacturers are challenged by the need for constant innovation and sourcing high-quality raw materials at competitive prices, as well as ensuring energy efficiency in production processes.
Current trends include a move towards eco-friendly materials, increased automation in production, and a greater emphasis on energy-efficient technologies to meet market demands.
6Wresearch actively monitors the Jordan Clay Products And Refractories Market and publishes its comprehensive annual report, highlighting emerging trends, growth drivers, revenue analysis, and forecast outlook. Our insights help businesses to make data-backed strategic decisions with ongoing market dynamics. Our analysts track relevent industries related to the Jordan Clay Products And Refractories Market, allowing our clients with actionable intelligence and reliable forecasts tailored to emerging regional needs.
Yes, we provide customisation as per your requirements. To learn more, feel free to contact us on sales@6wresearch.com
1 Executive Summary |
2 Introduction |
2.1 Key Highlights of the Report |
2.2 Report Description |
2.3 Market Scope & Segmentation |
2.4 Research Methodology |
2.5 Assumptions |
3 Jordan Clay Products And Refractories Market Overview |
3.1 Jordan Country Macro Economic Indicators |
3.2 Jordan Clay Products And Refractories Market Revenues & Volume, 2022 & 2032F |
3.3 Jordan Clay Products And Refractories Market - Industry Life Cycle |
3.4 Jordan Clay Products And Refractories Market - Porter's Five Forces |
3.5 Jordan Clay Products And Refractories Market Revenues & Volume Share, By Type, 2022 & 2032F |
3.6 Jordan Clay Products And Refractories Market Revenues & Volume Share, By Process , 2022 & 2032F |
3.7 Jordan Clay Products And Refractories Market Revenues & Volume Share, By Material , 2022 & 2032F |
3.8 Jordan Clay Products And Refractories Market Revenues & Volume Share, By End-User Vertical , 2022 & 2032F |
4 Jordan Clay Products And Refractories Market Dynamics |
4.1 Impact Analysis |
4.2 Market Drivers |
4.2.1 Growing construction industry in Jordan, leading to increased demand for clay products and refractories. |
4.2.2 Rising investments in infrastructure projects stimulating the market for clay products and refractories. |
4.2.3 Innovation in manufacturing processes and materials enhancing product quality and expanding market opportunities. |
4.3 Market Restraints |
4.3.1 Fluctuating raw material prices impacting production costs and profitability. |
4.3.2 Environmental regulations and sustainability concerns affecting production practices and product offerings. |
4.3.3 Intense competition from alternative building materials posing a challenge to the market growth. |
5 Jordan Clay Products And Refractories Market Trends |
6 Jordan Clay Products And Refractories Market, By Types |
6.1 Jordan Clay Products And Refractories Market, By Type |
6.1.1 Overview and Analysis |
6.1.2 Jordan Clay Products And Refractories Market Revenues & Volume, By Type, 2022-2032F |
6.1.3 Jordan Clay Products And Refractories Market Revenues & Volume, By Pottery, 2022-2032F |
6.1.4 Jordan Clay Products And Refractories Market Revenues & Volume, By Ceramics, 2022-2032F |
6.1.5 Jordan Clay Products And Refractories Market Revenues & Volume, By Plumbing Fixtures, 2022-2032F |
6.1.6 Jordan Clay Products And Refractories Market Revenues & Volume, By Clay Building Material, 2022-2032F |
6.1.7 Jordan Clay Products And Refractories Market Revenues & Volume, By Refractories, 2022-2032F |
6.2 Jordan Clay Products And Refractories Market, By Process |
6.2.1 Overview and Analysis |
6.2.2 Jordan Clay Products And Refractories Market Revenues & Volume, By Grinding , 2022-2032F |
6.2.3 Jordan Clay Products And Refractories Market Revenues & Volume, By Cutting , 2022-2032F |
6.2.4 Jordan Clay Products And Refractories Market Revenues & Volume, By Mixing , 2022-2032F |
6.2.5 Jordan Clay Products And Refractories Market Revenues & Volume, By Shaping, 2022-2032F |
6.2.6 Jordan Clay Products And Refractories Market Revenues & Volume, By Honing, 2022-2032F |
6.3 Jordan Clay Products And Refractories Market, By Material |
6.3.1 Overview and Analysis |
6.3.2 Jordan Clay Products And Refractories Market Revenues & Volume, By Quartz, 2022-2032F |
6.3.3 Jordan Clay Products And Refractories Market Revenues & Volume, By Chamatte, 2022-2032F |
6.3.4 Jordan Clay Products And Refractories Market Revenues & Volume, By Sand, 2022-2032F |
6.3.5 Jordan Clay Products And Refractories Market Revenues & Volume, By Sawdust, 2022-2032F |
6.3.6 Jordan Clay Products And Refractories Market Revenues & Volume, By Slag, 2022-2032F |
6.3.7 Jordan Clay Products And Refractories Market Revenues & Volume, By Pulverized , 2022-2032F |
6.4 Jordan Clay Products And Refractories Market, By End-User Vertical |
6.4.1 Overview and Analysis |
6.4.2 Jordan Clay Products And Refractories Market Revenues & Volume, By Construction , 2022-2032F |
6.4.3 Jordan Clay Products And Refractories Market Revenues & Volume, By Automobiles , 2022-2032F |
6.4.4 Jordan Clay Products And Refractories Market Revenues & Volume, By Steel Making , 2022-2032F |
6.4.5 Jordan Clay Products And Refractories Market Revenues & Volume, By Cosmetics, 2022-2032F |
6.4.6 Jordan Clay Products And Refractories Market Revenues & Volume, By Food Industry, 2022-2032F |
6.4.7 Jordan Clay Products And Refractories Market Revenues & Volume, By Others, 2022-2032F |
7 Jordan Clay Products And Refractories Market Import-Export Trade Statistics |
7.1 Jordan Clay Products And Refractories Market Export to Major Countries |
7.2 Jordan Clay Products And Refractories Market Imports from Major Countries |
8 Jordan Clay Products And Refractories Market Key Performance Indicators |
8.1 Percentage of revenue from new product developments. |
8.2 Adoption rate of innovative manufacturing technologies. |
8.3 Customer satisfaction index based on product quality and service. |
8.4 Percentage of market share in key segments. |
8.5 Number of strategic partnerships and collaborations established for market expansion. |
9 Jordan Clay Products And Refractories Market - Opportunity Assessment |
9.1 Jordan Clay Products And Refractories Market Opportunity Assessment, By Type, 2022 & 2032F |
9.2 Jordan Clay Products And Refractories Market Opportunity Assessment, By Process , 2022 & 2032F |
9.3 Jordan Clay Products And Refractories Market Opportunity Assessment, By Material , 2022 & 2032F |
9.4 Jordan Clay Products And Refractories Market Opportunity Assessment, By End-User Vertical , 2022 & 2032F |
10 Jordan Clay Products And Refractories Market - Competitive Landscape |
10.1 Jordan Clay Products And Refractories Market Revenue Share, By Companies, 2025 |
10.2 Jordan Clay Products And Refractories Market Competitive Benchmarking, By Operating and Technical Parameters |
11 Company Profiles |
12 Recommendations |
13 Disclaimer |
Global Go To Market Strategy - 2030
Export potential enables firms to identify high-growth global markets with greater confidence by combining advanced trade intelligence with a structured quantitative methodology. The framework analyzes emerging demand trends and country-level import patterns while integrating macroeconomic and trade datasets such as GDP and population forecasts, bilateral import–export flows, tariff structures, elasticity differentials between developed and developing economies, geographic distance, and import demand projections. Using weighted trade values from 2020–2024 as the base period to project country-to-country export potential for 2030, these inputs are operationalized through calculated drivers such as gravity model parameters, tariff impact factors, and projected GDP per-capita growth. Through an analysis of hidden potentials, demand hotspots, and market conditions that are most favorable to success, this method enables firms to focus on target countries, maximize returns, and global expansion with data, backed by accuracy.
By factoring in the projected importer demand gap that is currently unmet and could be potential opportunity, it identifies the potential for the Exporter (Country) among 190 countries, against the general trade analysis, which identifies the biggest importer or exporter.
To discover high-growth global markets and optimize your business strategy:
Click Here
Pricing
- Single User License$ 1,995
- Department License$ 2,400
- Site License$ 3,120
- Global License$ 3,795

Leadership Perspectives from Industry Events
Search
Thought Leadership and Analyst Meet


Our Clients
6WResearch In News
- India Air Conditioner Market Set for Strong Rebound in 2026 After Weather-Led Correction and GST-Driven Recovery: 6Wresearch
- ADAS in India: How Automatic Emergency Braking, Blind Spot Detection & Driver Monitoring are Transforming Road Safety
- Doha a strategic location for EV manufacturing hub: IPA Qatar
- Demand for luxury TVs surging in the GCC, says Samsung
- Empowering Growth: The Thriving Journey of Bangladesh’s Cable Industry
- Demand for luxury TVs surging in the GCC, says Samsung
Latest Reports
- Nicaragua RPG Gaming Market (2026-2032)
- New Zealand RPG Gaming Market (2026-2032)
- Netherlands RPG Gaming Market (2026-2032)
- Nauru RPG Gaming Market (2026-2032)
- Namibia RPG Gaming Market (2026-2032)
- Mozambique RPG Gaming Market (2026-2032)
- Montenegro RPG Gaming Market (2026-2032)
- Mongolia RPG Gaming Market (2026-2032)
- Monaco RPG Gaming Market (2026-2032)
- Micronesia RPG Gaming Market (2026-2032)
Industry Events and Analyst Meet

EV India Expo 2026

HIMTEX 2026

India Refining Summit 2026

India EV Show 2026

EV tech India Expo 2026
Whitepaper
- Middle East & Africa Commercial Security Market Click here to view more.
- Middle East & Africa Fire Safety Systems & Equipment Market Click here to view more.
- GCC Drone Market Click here to view more.
- Middle East Lighting Fixture Market Click here to view more.
- GCC Physical & Perimeter Security Market Click here to view more.