Jordan Niobium Market (2026-2032) Outlook | Analysis, Industry, Trends, Companies, Revenue, Value, Size, Forecast, Share & Growth
Market Forecast By Occurrence (Carbonatites and Associates, Columbite-Tantalite), By Type (Ferroniobium, Niobium Oxide, Niobium Metal, Vacuum Grade Niobium Alloys), By Application (Steel, Super Alloys, Superconducting Magnets, Capacitors, Glass, Others), By End-user Industry (Construction, Automotive and Transportation, Aerospace and Defence, Oil and Gas, Others) And Competitive Landscape
| Product Code: ETC197818 | Publication Date: May 2022 | Updated Date: Jun 2026 | Product Type: Market Research Report | |
| Publisher: 6Wresearch | Author: Sachin Kumar Rai | No. of Pages: 60 | No. of Figures: 40 | No. of Tables: 7 |
Jordan Niobium Market Size, Share & Growth Rate
The Jordan Niobium Market was estimated at USD 262 Million in 2025 and is projected to reach USD 359 Million by 2032, growing at a CAGR of 4.6% from 2026 to 2032. This growth trajectory is primarily driven by the increasing demand for high-strength materials in key industries such as aerospace, automotive, and electronics. Furthermore, the growing emphasis on lightweight and sustainable solutions positions niobium as a strategic element for manufacturers looking to enhance performance while adhering to environmental regulations.
Jordan Niobium Market Growth Rate Analysis (2021-2032)
The Jordan Niobium market has exhibited a stable growth pattern, with a yearly increase of 5.4% in 2021 and 2022, followed by a slight uptick to 5.6% in 2023. This growth trajectory can be attributed to rising demand for high-strength alloys and superconducting materials, essential for the energy transition and advanced technology sectors. Although growth moderates slightly in 2024 at 5.3%, it bounces back to 5.5% in 2025, reflecting ongoing investments in infrastructure and industrial applications. By 2029, growth is anticipated to reach 5.7%, driven by digitalization and evolving consumer demand in emerging markets, before stabilizing again leading into the next decade.
Jordan Niobium Market Year-wise Growth Rate and Key Drivers
This graph highlights how the Jordan Niobium Market has steadily grown over the past five years, supported by major growth factors.
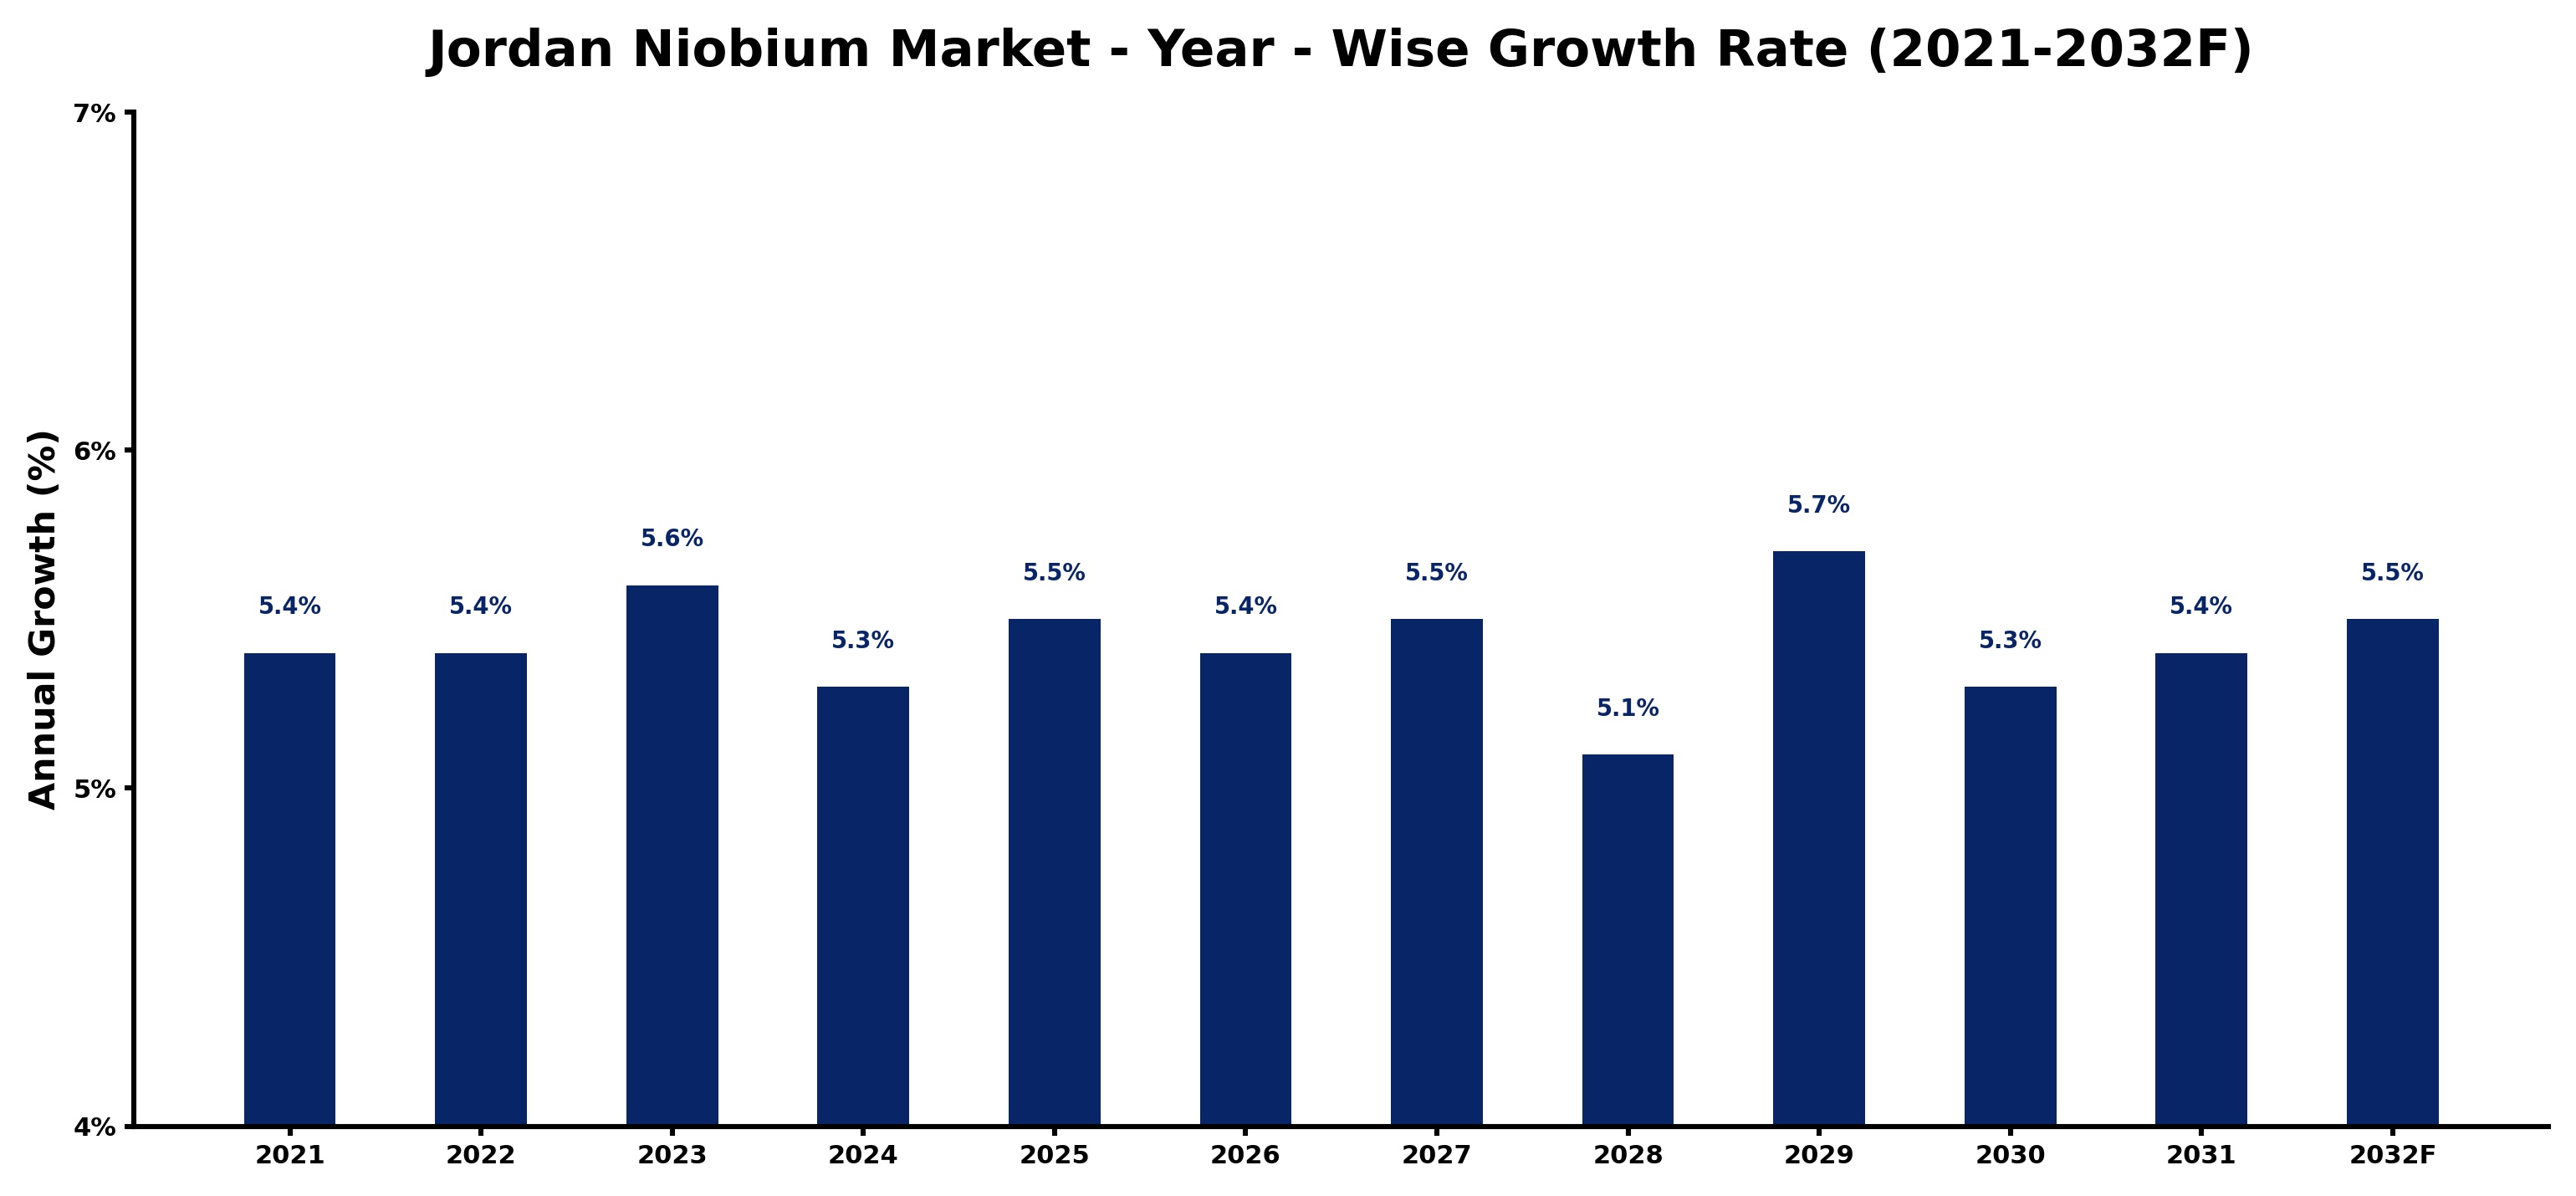
The table below presents the year‑wise growth rates along with the key drivers influencing the market
| Year | Growth Rate | Major Drivers |
| 2021 | 5.4% | Increased industrial applications emerged |
| 2022 | 5.4% | Technological advancements enhanced production |
| 2023 | 5.6% | Rising demand from electronics sector |
| 2024 | 5.3% | Growth in renewable energy investments |
| 2025 | 5.5% | Expansion of automotive manufacturing sector |
| 2026 | 5.4% | Research initiatives improved extraction methods |
| 2027 | 5.5% | Emergence of new market players |
| 2028 | 5.1% | Sustainability initiatives drove innovation |
| 2029 | 5.7% | Global partnerships expanded market reach |
| 2030 | 5.3% | Investment in mining infrastructure increased |
| 2031 | 5.4% | Rising interest in advanced materials |
| 2032 | 5.5% | Collaboration with research institutions grew |
Note - Market size estimations and growth projections presented in this report are based on 6Wresearch’s advanced forecasting approach, validated with industry datasets as of June 2026.
Jordan Niobium Market Synopsis
In recent years, the Jordan Niobium market has experienced a significant upward momentum, buoyed by robust demand across various sectors. However, as the market approaches 2032, this growth is expected to be sustained by technological advancements and increased application of niobium in innovative material solutions.
Looking ahead, the Jordan Niobium market is poised for continued expansion, fueled by the country’s substantial reserves and strategic geographic positioning. With ongoing government support and a focus on sustainable development, Jordan is set to leverage its niobium resources effectively, ensuring a steady supply for global markets.
Jordan Niobium Market Key Takeaways
- The Jordan Niobium Market is projected to grow from USD 262 Million in 2025 to USD 359 Million by 2032.
- Key industries driving demand include aerospace, automotive, and electronics, primarily due to niobium's lightweight and corrosion-resistant properties.
- Jordan's strategic location and strong infrastructure bolster its position in the global niobium landscape.
- Technological advancements and a growing focus on sustainability are pivotal in shaping market trends.
- Government initiatives support innovation and sustainable practices within the niobium sector.
Evaluation of Restraints in Jordan Niobium Market
Despite the promising outlook, the Jordan Niobium market faces several constraints that could impede growth. Fluctuating global demand and prices create uncertainty, impacting profitability for producers. Moreover, competition from other niobium-producing nations adds pressure on Jordan's market share. Infrastructure challenges, such as limited facilities for mining and processing, restrict operational efficiency. Geopolitical dynamics in the region may also pose risks to the stability of production and export capabilities. Addressing these issues will be crucial for maintaining competitiveness in the global market.
Jordan Niobium Market Trends
Several trends are shaping the Jordan Niobium market. The shift toward high-strength steel and superalloys, particularly for automotive and aerospace applications, is gaining traction. Additionally, the global push for sustainable materials is driving innovation in niobium applications, as industries prioritize eco-friendly alternatives. The rise of electric vehicles and renewable energy technologies is also fostering increased demand for niobium-based components. As companies prioritize research and development, the integration of cutting-edge technologies promises to enhance niobium’s role in various sectors.
Jordan Niobium Market Opportunities
Investors looking at the Jordan Niobium market will find abundant opportunities stemming from the rising global demand for advanced materials. With the country holding significant niobium reserves, investment in mining and processing operations could yield substantial returns. The focus on sustainable manufacturing processes also presents avenues for growth, as environmentally-conscious production practices continue to gain importance. Furthermore, partnerships with international firms could facilitate technology transfer, enhancing operational capabilities and expanding market reach.
Government Initiatives in the Jordan Niobium Market
The Jordanian government has implemented various initiatives aimed at promoting the sustainable development of the niobium market. Policies focus on ensuring fair trade practices while encouraging investment in mining and processing facilities. Additionally, there is an emphasis on innovation and technological advancement to enhance competitiveness. Environmental regulations are also being enforced to promote responsible mining practices, ensuring that the extraction and processing of niobium align with conservation efforts. These initiatives not only strengthen the market but also support local producers.
Future Insights of the Jordan Niobium Market
The future of the Jordan Niobium market looks bright as demand from key industries continues to rise. Technological innovations, alongside government efforts to foster investment, are likely to propel the market forward. Moreover, the trend towards sustainable materials in various applications presents new growth avenues for niobium. By 2032, the strategic positioning of Jordan and its commitment to sustainable practices could solidify its status as a leading player in the global niobium market.
Jordan Niobium Market Latest Developments (May 2025 - June 2026)
In the past year, the Jordan Niobium market has witnessed significant industry developments. Companies have been investing in enhancing extraction technologies to improve operational efficiency and reduce environmental impact. Collaborative efforts between government and private sectors are also increasing, focusing on innovation and sustainable practices. Furthermore, there has been a marked increase in research initiatives aimed at expanding the applications of niobium in high-demand sectors, such as aerospace and electronics, indicating a dynamic shift towards modernization within the market.
Jordan Niobium Market - Key Attractiveness of the Report
- 10 Years of Market Numbers
- Historical Data Starting from 2022 to 2025
- Base Year: 2025
- Forecast Data until 2032
- Key Performance Indicators Impacting the Market
- Major Upcoming Developments and Projects
Key Highlights of the Report:
- Jordan Niobium Market Outlook
- Market Size of Jordan Niobium Market, 2025
- Forecast of Jordan Niobium Market, 2032
- Historical Data and Forecast of Jordan Niobium Revenues & Volume for the Period 2022-2032F
- Jordan Niobium Market Trend Evolution
- Jordan Niobium Market Drivers and Challenges
- Jordan Niobium Price Trends
- Jordan Niobium Porter's Five Forces
- Jordan Niobium Industry Life Cycle
- Historical Data and Forecast of Jordan Niobium Market Revenues & Volume By Occurrence for the Period 2022-2032F
- Historical Data and Forecast of Jordan Niobium Market Revenues & Volume By Carbonatites and Associates for the Period 2022-2032F
- Historical Data and Forecast of Jordan Niobium Market Revenues & Volume By Columbite-Tantalite for the Period 2022-2032F
- Historical Data and Forecast of Jordan Niobium Market Revenues & Volume By Type for the Period 2022-2032F
- Historical Data and Forecast of Jordan Niobium Market Revenues & Volume By Ferroniobium for the Period 2022-2032F
- Historical Data and Forecast of Jordan Niobium Market Revenues & Volume By Niobium Oxide for the Period 2022-2032F
- Historical Data and Forecast of Jordan Niobium Market Revenues & Volume By Niobium Metal for the Period 2022-2032F
- Historical Data and Forecast of Jordan Niobium Market Revenues & Volume By Vacuum Grade Niobium Alloys for the Period 2022-2032F
- Historical Data and Forecast of Jordan Niobium Market Revenues & Volume By Application for the Period 2022-2032F
- Historical Data and Forecast of Jordan Niobium Market Revenues & Volume By Steel for the Period 2022-2032F
- Historical Data and Forecast of Jordan Niobium Market Revenues & Volume By Super Alloys for the Period 2022-2032F
- Historical Data and Forecast of Jordan Niobium Market Revenues & Volume By Superconducting Magnets for the Period 2022-2032F
- Historical Data and Forecast of Jordan Niobium Market Revenues & Volume By Capacitors for the Period 2022-2032F
- Historical Data and Forecast of Jordan Niobium Market Revenues & Volume By Glass for the Period 2022-2032F
- Historical Data and Forecast of Jordan Niobium Market Revenues & Volume By Others for the Period 2022-2032F
- Historical Data and Forecast of Jordan Niobium Market Revenues & Volume By End-user Industry for the Period 2022-2032F
- Historical Data and Forecast of Jordan Niobium Market Revenues & Volume By Construction for the Period 2022-2032F
- Historical Data and Forecast of Jordan Niobium Market Revenues & Volume By Automotive and Transportation for the Period 2022-2032F
- Historical Data and Forecast of Jordan Niobium Market Revenues & Volume By Aerospace and Defence for the Period 2022-2032F
- Historical Data and Forecast of Jordan Niobium Market Revenues & Volume By Oil and Gas for the Period 2022-2032F
- Historical Data and Forecast of Jordan Niobium Market Revenues & Volume By Others for the Period 2022-2032F
- Jordan Niobium Import Export Trade Statistics
- Market Opportunity Assessment By Occurrence
- Market Opportunity Assessment By Type
- Market Opportunity Assessment By Application
- Market Opportunity Assessment By End-user Industry
- Jordan Niobium Top Companies Market Share
- Jordan Niobium Competitive Benchmarking By Technical and Operational Parameters
- Jordan Niobium Company Profiles
- Jordan Niobium Key Strategic Recommendations
Jordan Niobium Market - Frequently Asked Questions
The growth is primarily driven by increasing demand from key industries like aerospace and automotive, coupled with the emphasis on sustainable and lightweight materials.
Jordan is a key player due to its substantial niobium reserves, particularly at the King Talal Deposit, which provides a competitive advantage for production and export.
The Jordan Niobium Market was estimated at USD 262 Million in 2025 and is projected to reach USD 359 Million by 2032, growing at a CAGR of 4.6% from 2026 to 2032.
The Jordanian government has established regulations to promote sustainable practices, fair trade, and investment in niobium mining and processing facilities, all aimed at enhancing competitiveness.
Yes, challenges include fluctuating global demand, competition from other producing countries, and infrastructure limitations that may impact mining and processing capabilities.
6Wresearch actively monitors the Jordan Niobium Market and publishes its comprehensive annual report, highlighting emerging trends, growth drivers, revenue analysis, and forecast outlook. Our insights help businesses to make data-backed strategic decisions with ongoing market dynamics. Our analysts track relevent industries related to the Jordan Niobium Market, allowing our clients with actionable intelligence and reliable forecasts tailored to emerging regional needs.
Yes, we provide customisation as per your requirements. To learn more, feel free to contact us on sales@6wresearch.com
1 Executive Summary |
2 Introduction |
2.1 Key Highlights of the Report |
2.2 Report Description |
2.3 Market Scope & Segmentation |
2.4 Research Methodology |
2.5 Assumptions |
3 Jordan Niobium Market Overview |
3.1 Jordan Country Macro Economic Indicators |
3.2 Jordan Niobium Market Revenues & Volume, 2022 & 2032F |
3.3 Jordan Niobium Market - Industry Life Cycle |
3.4 Jordan Niobium Market - Porter's Five Forces |
3.5 Jordan Niobium Market Revenues & Volume Share, By Occurrence, 2022 & 2032F |
3.6 Jordan Niobium Market Revenues & Volume Share, By Type, 2022 & 2032F |
3.7 Jordan Niobium Market Revenues & Volume Share, By Application, 2022 & 2032F |
3.8 Jordan Niobium Market Revenues & Volume Share, By End-user Industry, 2022 & 2032F |
4 Jordan Niobium Market Dynamics |
4.1 Impact Analysis |
4.2 Market Drivers |
4.2.1 Growing demand for niobium in the aerospace and automotive industries due to its lightweight and high-temperature resistance properties. |
4.2.2 Increasing investments in infrastructure projects in Jordan, leading to higher demand for niobium in construction materials. |
4.2.3 Advancements in technology leading to the development of new applications for niobium in electronics and energy storage sectors. |
4.3 Market Restraints |
4.3.1 Fluctuating prices of niobium in the global market impacting the profitability of Jordan's niobium market. |
4.3.2 Competition from other emerging markets offering cheaper alternatives to niobium-based products. |
4.3.3 Regulatory challenges and environmental concerns related to niobium mining and extraction in Jordan. |
5 Jordan Niobium Market Trends |
6 Jordan Niobium Market, By Types |
6.1 Jordan Niobium Market, By Occurrence |
6.1.1 Overview and Analysis |
6.1.2 Jordan Niobium Market Revenues & Volume, By Occurrence, 2022-2032F |
6.1.3 Jordan Niobium Market Revenues & Volume, By Carbonatites and Associates, 2022-2032F |
6.1.4 Jordan Niobium Market Revenues & Volume, By Columbite-Tantalite, 2022-2032F |
6.2 Jordan Niobium Market, By Type |
6.2.1 Overview and Analysis |
6.2.2 Jordan Niobium Market Revenues & Volume, By Ferroniobium, 2022-2032F |
6.2.3 Jordan Niobium Market Revenues & Volume, By Niobium Oxide, 2022-2032F |
6.2.4 Jordan Niobium Market Revenues & Volume, By Niobium Metal, 2022-2032F |
6.2.5 Jordan Niobium Market Revenues & Volume, By Vacuum Grade Niobium Alloys, 2022-2032F |
6.3 Jordan Niobium Market, By Application |
6.3.1 Overview and Analysis |
6.3.2 Jordan Niobium Market Revenues & Volume, By Steel, 2022-2032F |
6.3.3 Jordan Niobium Market Revenues & Volume, By Super Alloys, 2022-2032F |
6.3.4 Jordan Niobium Market Revenues & Volume, By Superconducting Magnets, 2022-2032F |
6.3.5 Jordan Niobium Market Revenues & Volume, By Capacitors, 2022-2032F |
6.3.6 Jordan Niobium Market Revenues & Volume, By Glass, 2022-2032F |
6.3.7 Jordan Niobium Market Revenues & Volume, By Others, 2022-2032F |
6.4 Jordan Niobium Market, By End-user Industry |
6.4.1 Overview and Analysis |
6.4.2 Jordan Niobium Market Revenues & Volume, By Construction, 2022-2032F |
6.4.3 Jordan Niobium Market Revenues & Volume, By Automotive and Transportation, 2022-2032F |
6.4.4 Jordan Niobium Market Revenues & Volume, By Aerospace and Defence, 2022-2032F |
6.4.5 Jordan Niobium Market Revenues & Volume, By Oil and Gas, 2022-2032F |
6.4.6 Jordan Niobium Market Revenues & Volume, By Others, 2022-2032F |
7 Jordan Niobium Market Import-Export Trade Statistics |
7.1 Jordan Niobium Market Export to Major Countries |
7.2 Jordan Niobium Market Imports from Major Countries |
8 Jordan Niobium Market Key Performance Indicators |
8.1 Research and development investment in niobium-related technologies in Jordan. |
8.2 Number of patents filed for niobium-based innovations by Jordanian companies or research institutions. |
8.3 Percentage of niobium produced in Jordan that meets international quality standards. |
8.4 Adoption rate of niobium-based materials in key industries in Jordan. |
8.5 Sustainability initiatives implemented in niobium mining and processing operations in Jordan. |
9 Jordan Niobium Market - Opportunity Assessment |
9.1 Jordan Niobium Market Opportunity Assessment, By Occurrence, 2022 & 2032F |
9.2 Jordan Niobium Market Opportunity Assessment, By Type, 2022 & 2032F |
9.3 Jordan Niobium Market Opportunity Assessment, By Application, 2022 & 2032F |
9.4 Jordan Niobium Market Opportunity Assessment, By End-user Industry, 2022 & 2032F |
10 Jordan Niobium Market - Competitive Landscape |
10.1 Jordan Niobium Market Revenue Share, By Companies, 2025 |
10.2 Jordan Niobium Market Competitive Benchmarking, By Operating and Technical Parameters |
11 Company Profiles |
12 Recommendations |
13 Disclaimer |
Global Go To Market Strategy - 2030
Export potential enables firms to identify high-growth global markets with greater confidence by combining advanced trade intelligence with a structured quantitative methodology. The framework analyzes emerging demand trends and country-level import patterns while integrating macroeconomic and trade datasets such as GDP and population forecasts, bilateral import–export flows, tariff structures, elasticity differentials between developed and developing economies, geographic distance, and import demand projections. Using weighted trade values from 2020–2024 as the base period to project country-to-country export potential for 2030, these inputs are operationalized through calculated drivers such as gravity model parameters, tariff impact factors, and projected GDP per-capita growth. Through an analysis of hidden potentials, demand hotspots, and market conditions that are most favorable to success, this method enables firms to focus on target countries, maximize returns, and global expansion with data, backed by accuracy.
By factoring in the projected importer demand gap that is currently unmet and could be potential opportunity, it identifies the potential for the Exporter (Country) among 190 countries, against the general trade analysis, which identifies the biggest importer or exporter.
To discover high-growth global markets and optimize your business strategy:
Click Here
Pricing
- Single User License$ 1,995
- Department License$ 2,400
- Site License$ 3,120
- Global License$ 3,795

Leadership Perspectives from Industry Events
Search
Thought Leadership and Analyst Meet


Our Clients
6WResearch In News
- India Air Conditioner Market Set for Strong Rebound in 2026 After Weather-Led Correction and GST-Driven Recovery: 6Wresearch
- ADAS in India: How Automatic Emergency Braking, Blind Spot Detection & Driver Monitoring are Transforming Road Safety
- Doha a strategic location for EV manufacturing hub: IPA Qatar
- Demand for luxury TVs surging in the GCC, says Samsung
- Empowering Growth: The Thriving Journey of Bangladesh’s Cable Industry
- Demand for luxury TVs surging in the GCC, says Samsung
Latest Reports
- Poland Fire Protection Systems Market (2026-2032)
- Cape Verde Portable Hand-Thrown Extinguisher Market (2026-2032)
- Canada Portable Hand-Thrown Extinguisher Market (2026-2032)
- Cameroon Portable Hand-Thrown Extinguisher Market (2026-2032)
- Burundi Portable Hand-Thrown Extinguisher Market (2026-2032)
- Burkina Faso Portable Hand-Thrown Extinguisher Market (2026-2032)
- Bulgaria Portable Hand-Thrown Extinguisher Market (2026-2032)
- Brunei Portable Hand-Thrown Extinguisher Market (2026-2032)
- Botswana Portable Hand-Thrown Extinguisher Market (2026-2032)
- Bosnia and Herzegovina Portable Hand-Thrown Extinguisher Market (2026-2032)
Industry Events and Analyst Meet

HIMTEX 2026

India Refining Summit 2026

India EV Show 2026

EV tech India Expo 2026

Auto Tech Asia 2026
Whitepaper
- Middle East & Africa Commercial Security Market Click here to view more.
- Middle East & Africa Fire Safety Systems & Equipment Market Click here to view more.
- GCC Drone Market Click here to view more.
- Middle East Lighting Fixture Market Click here to view more.
- GCC Physical & Perimeter Security Market Click here to view more.