Jordan Power Convertor Market (2026-2032) | , Growth, Share, Size, Forecast, Industry, Value, Trends, Analysis, Outlook, Revenue & Companies
Market Forecast By Product Types (Low Voltage Power Converter, High Voltage Power Converter), By Applications (Electronics, Industrial, Infrastructure & Transportation, Power Utilities, Others) And Competitive Landscape
| Product Code: ETC005346 | Publication Date: Sep 2020 | Updated Date: Jun 2026 | Product Type: Report | |
| Publisher: 6Wresearch | Author: Ravi Bhandari | No. of Pages: 70 | No. of Figures: 35 | No. of Tables: 5 |
Jordan Power Convertor Market Summary
The jordan power convertor market was estimated at USD 293 Million in 2025 and is projected to reach USD 401 Million by 2032, growing at a CAGR of 5.4% from 2026 to 2032.
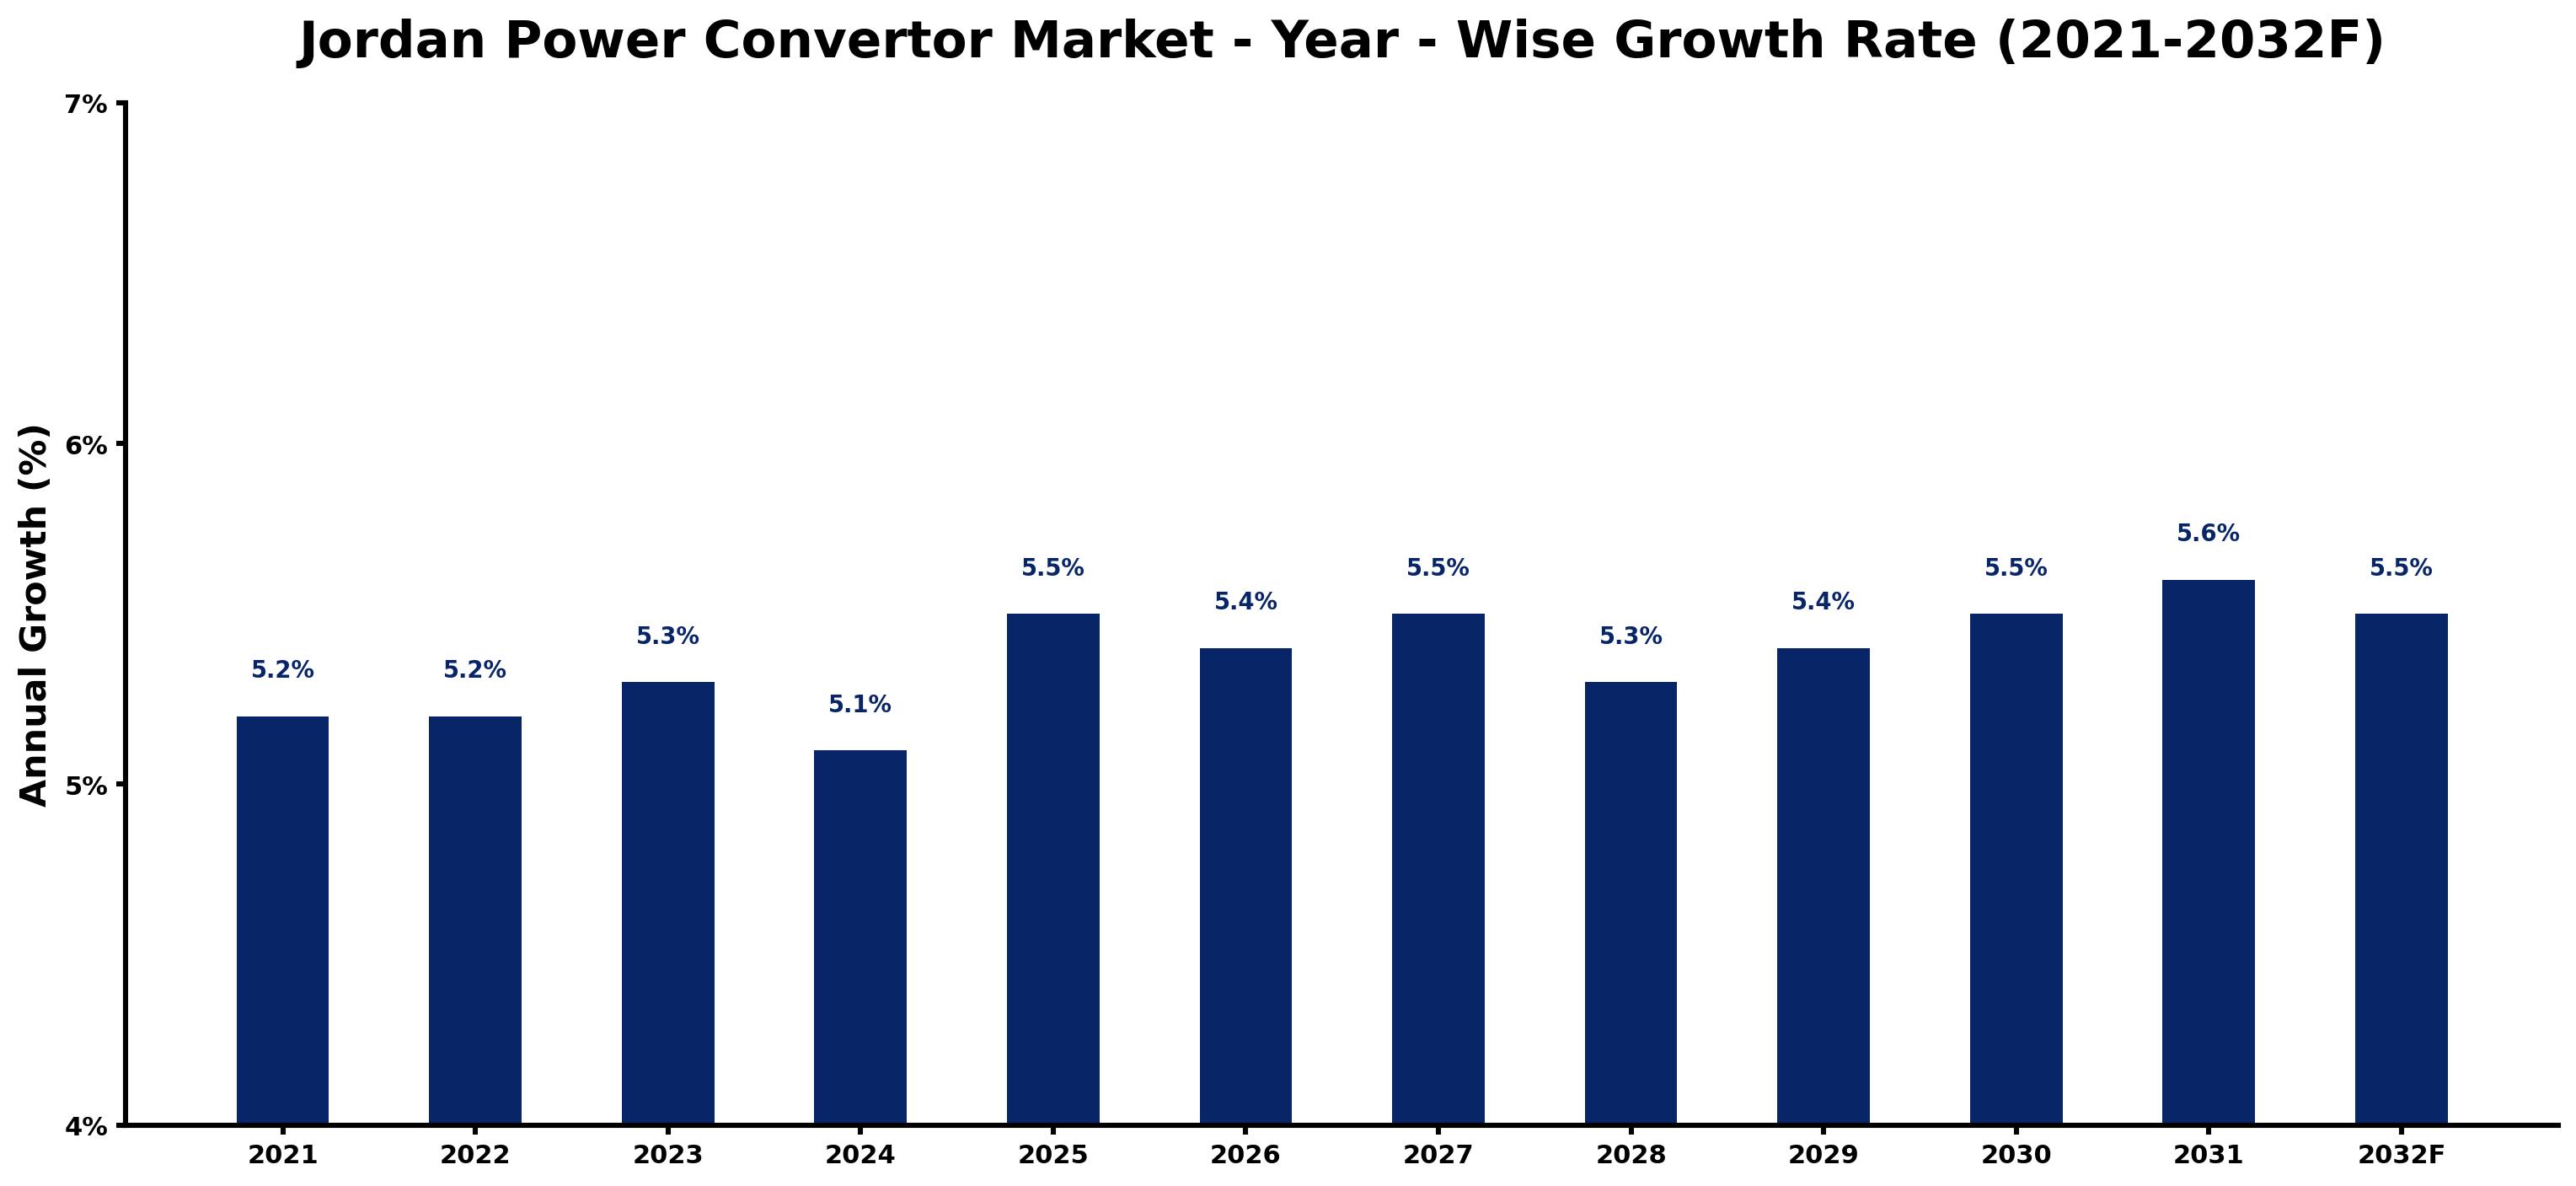
Jordan Power Convertor Market Growth Rate Analysis (2021-2032)
The Jordan Power Converter market has shown stable growth, with year-on-year increases reflecting a robust demand for efficient energy solutions. In 2021 and 2022, the market grew at a steady rate of 5.2%, driven by rising consumer demand for sustainable energy technologies and investments in infrastructure development. The growth slightly accelerated to 5.3% in 2023 as energy transition initiatives gained momentum, alongside digitalization in energy management. A dip to 5.1% in 2024 can be attributed to market saturation and intensifying competition, but it rebounded to 5.5% in 2025, boosted by governmental policies promoting renewable energy. This upward trend is anticipated to continue, with a forecast growth of 5.6% by 2031 as investments in advanced technologies become increasingly paramount.
Jordan Power Convertor Market Year-wise Growth Rate and Key Drivers
This graph highlights how the Jordan Power Convertor Market has steadily grown over the past five years, supported by major growth factors.
The table below presents the year‑wise growth rates along with the key drivers influencing the market
| Year | Growth Rate | Major Drivers |
| 2021 | 5.2% | Energy efficiency concerns prompt businesses to explore innovative power converter solutions. |
| 2022 | 5.2% | Local manufacturing capabilities gain traction, enhancing supply chain resilience and cost-effectiveness. |
| 2023 | 5.3% | Smart grid implementations highlight the need for advanced power conversion technologies. |
| 2024 | 5.1% | Heavy investments in renewable energy projects stimulate demand for robust converter systems. |
| 2025 | 5.5% | Construction boom in urban areas increases requirements for reliable power conversion devices. |
| 2026 | 5.4% | Technological collaborations emerge, fostering innovation in high-efficiency converter designs. |
| 2027 | 5.5% | Corporate sustainability goals drive interest in eco-friendly power conversion alternatives. |
| 2028 | 5.3% | Evolving residential energy consumption patterns necessitate upgrades to existing power infrastructure. |
| 2029 | 5.4% | Emerging markets within Jordan demand localized energy solutions for better accessibility. |
| 2030 | 5.5% | Integration of electric vehicles into the grid demands advanced converter technologies for optimization. |
| 2031 | 5.6% | Consumer awareness regarding energy savings influences purchase decisions for power conversion systems. |
| 2032 | 5.5% | Global supply chain stabilization allows for improved availability of cutting-edge converter technologies. |
Note - Market size estimations and growth projections presented in this report are based on 6Wresearch's advanced forecasting approach, validated with industry datasets as of June 2026.
Key Highlights of the Report:
- Jordan Power Convertor Market Outlook
- Market Size of Jordan Power Convertor Market, 2025
- Forecast of Jordan Power Convertor Market, 2032F
- Historical Data and Forecast of Jordan Power Convertor Revenues & Volume for the Period 2022-2032F
- Jordan Power Convertor Market Trend Evolution
- Jordan Power Convertor Market Drivers and Challenges
- Jordan Power Convertor Price Trends
- Jordan Power Convertor Porter's Five Forces
- Jordan Power Convertor Industry Life Cycle
- Historical Data and Forecast of Jordan Power Convertor Market Revenues & Volume By Product Types for the Period 2022-2032F
- Historical Data and Forecast of Jordan Power Convertor Market Revenues & Volume By Low Voltage Power Converter for the Period 2022-2032F
- Historical Data and Forecast of Jordan Power Convertor Market Revenues & Volume By High Voltage Power Converter for the Period 2022-2032F
- Historical Data and Forecast of Jordan Power Convertor Market Revenues & Volume By Applications for the Period 2022-2032F
- Historical Data and Forecast of Jordan Power Convertor Market Revenues & Volume By Electronics for the Period 2022-2032F
- Historical Data and Forecast of Jordan Power Convertor Market Revenues & Volume By Industrial for the Period 2022-2032F
- Historical Data and Forecast of Jordan Power Convertor Market Revenues & Volume By Infrastructure & Transportation for the Period 2022-2032F
- Historical Data and Forecast of Jordan Power Convertor Market Revenues & Volume By Power Utilities for the Period 2022-2032F
- Historical Data and Forecast of Jordan Power Convertor Market Revenues & Volume By Others for the Period 2022-2032F
- Jordan Power Convertor Import Export Trade Statistics
- Market Opportunity Assessment By Product Types
- Market Opportunity Assessment By Applications
- Jordan Power Convertor Top Companies Market Share
- Jordan Power Convertor Competitive Benchmarking By Technical and Operational Parameters
- Jordan Power Convertor Company Profiles
- Jordan Power Convertor Key Strategic Recommendations
Frequently Asked Questions About the Market Study (FAQs):
6Wresearch actively monitors the Jordan Power Convertor Market and publishes its comprehensive annual report, highlighting emerging trends, growth drivers, revenue analysis, and forecast outlook. Our insights help businesses to make data-backed strategic decisions with ongoing market dynamics. Our analysts track relevent industries related to the Jordan Power Convertor Market, allowing our clients with actionable intelligence and reliable forecasts tailored to emerging regional needs.
Yes, we provide customisation as per your requirements. To learn more, feel free to contact us on sales@6wresearch.com
1 Executive Summary |
2 Introduction |
2.1 Key Highlights of the Report |
2.2 Report Description |
2.3 Market Scope & Segmentation |
2.4 Research Methodology |
2.5 Assumptions |
3 Jordan Power Convertor Market Overview |
3.1 Jordan Country Macro Economic Indicators |
3.2 Jordan Power Convertor Market Revenues & Volume, 2022 & 2032F |
3.3 Jordan Power Convertor Market - Industry Life Cycle |
3.4 Jordan Power Convertor Market - Porter's Five Forces |
3.5 Jordan Power Convertor Market Revenues & Volume Share, By Product Types, 2022 & 2032F |
3.6 Jordan Power Convertor Market Revenues & Volume Share, By Applications, 2022 & 2032F |
4 Jordan Power Convertor Market Dynamics |
4.1 Impact Analysis |
4.2 Market Drivers |
4.3 Market Restraints |
5 Jordan Power Convertor Market Trends |
6 Jordan Power Convertor Market, By Types |
6.1 Jordan Power Convertor Market, By Product Types |
6.1.1 Overview and Analysis |
6.1.2 Jordan Power Convertor Market Revenues & Volume, By Product Types, 2022 - 2032F |
6.1.3 Jordan Power Convertor Market Revenues & Volume, By Low Voltage Power Converter, 2022 - 2032F |
6.1.4 Jordan Power Convertor Market Revenues & Volume, By High Voltage Power Converter, 2022 - 2032F |
6.2 Jordan Power Convertor Market, By Applications |
6.2.1 Overview and Analysis |
6.2.2 Jordan Power Convertor Market Revenues & Volume, By Electronics, 2022 - 2032F |
6.2.3 Jordan Power Convertor Market Revenues & Volume, By Industrial, 2022 - 2032F |
6.2.4 Jordan Power Convertor Market Revenues & Volume, By Infrastructure & Transportation, 2022 - 2032F |
6.2.5 Jordan Power Convertor Market Revenues & Volume, By Power Utilities, 2022 - 2032F |
6.2.6 Jordan Power Convertor Market Revenues & Volume, By Others, 2022 - 2032F |
7 Jordan Power Convertor Market Import-Export Trade Statistics |
7.1 Jordan Power Convertor Market Export to Major Countries |
7.2 Jordan Power Convertor Market Imports from Major Countries |
8 Jordan Power Convertor Market Key Performance Indicators |
9 Jordan Power Convertor Market - Opportunity Assessment |
9.1 Jordan Power Convertor Market Opportunity Assessment, By Product Types, 2022 & 2032F |
9.2 Jordan Power Convertor Market Opportunity Assessment, By Applications, 2022 & 2032F |
10 Jordan Power Convertor Market - Competitive Landscape |
10.1 Jordan Power Convertor Market Revenue Share, By Companies, 2025 |
10.2 Jordan Power Convertor Market Competitive Benchmarking, By Operating and Technical Parameters |
11 Company Profiles |
12 Recommendations |
13 Disclaimer |
Global Go To Market Strategy - 2030
Export potential enables firms to identify high-growth global markets with greater confidence by combining advanced trade intelligence with a structured quantitative methodology. The framework analyzes emerging demand trends and country-level import patterns while integrating macroeconomic and trade datasets such as GDP and population forecasts, bilateral import–export flows, tariff structures, elasticity differentials between developed and developing economies, geographic distance, and import demand projections. Using weighted trade values from 2020–2024 as the base period to project country-to-country export potential for 2030, these inputs are operationalized through calculated drivers such as gravity model parameters, tariff impact factors, and projected GDP per-capita growth. Through an analysis of hidden potentials, demand hotspots, and market conditions that are most favorable to success, this method enables firms to focus on target countries, maximize returns, and global expansion with data, backed by accuracy.
By factoring in the projected importer demand gap that is currently unmet and could be potential opportunity, it identifies the potential for the Exporter (Country) among 190 countries, against the general trade analysis, which identifies the biggest importer or exporter.
To discover high-growth global markets and optimize your business strategy:
Click Here
Pricing
- Single User License$ 1,995
- Department License$ 2,400
- Site License$ 3,120
- Global License$ 3,795

Leadership Perspectives from Industry Events
Search
Thought Leadership and Analyst Meet


Our Clients
6WResearch In News
- Doha a strategic location for EV manufacturing hub: IPA Qatar
- Demand for luxury TVs surging in the GCC, says Samsung
- Empowering Growth: The Thriving Journey of Bangladesh’s Cable Industry
- Demand for luxury TVs surging in the GCC, says Samsung
- Video call with a traditional healer? Once unthinkable, it’s now common in South Africa
- Intelligent Buildings To Smooth GCC’s Path To Net Zero
Latest Reports
- Taiwan Airport Wireless Infrastructure Market (2026-2032)
- Vietnam Airport Wireless Infrastructure Market (2026-2032)
- Thailand Airport Wireless Infrastructure Market (2026-2032)
- South Korea Airport Wireless Infrastructure Market (2026-2032)
- Romania Airport Wireless Infrastructure Market (2026-2032)
- Qatar Airport Wireless Infrastructure Market (2026-2032)
- Philippines Airport Wireless Infrastructure Market (2026-2032)
- Japan Airport Wireless Infrastructure Market (2026-2032)
- Taiwan Airport Winter Services Market (2026-2032)
- Vietnam Airport Winter Services Market (2026-2032)
Industry Events and Analyst Meet

HIMTEX 2026

India Refining Summit 2026

India EV Show 2026

EV tech India Expo 2026

Auto Tech Asia 2026
Whitepaper
- Middle East & Africa Commercial Security Market Click here to view more.
- Middle East & Africa Fire Safety Systems & Equipment Market Click here to view more.
- GCC Drone Market Click here to view more.
- Middle East Lighting Fixture Market Click here to view more.
- GCC Physical & Perimeter Security Market Click here to view more.